Annual Air Monitoring Plan 2019 - Maine Department of Environmental Protection Bureau of Air Quality July 20, 2018
←
→
Page content transcription
If your browser does not render page correctly, please read the page content below
Annual Air Monitoring Plan
           2019

  Maine Department of Environmental Protection
             Bureau of Air Quality
                 July 20, 2018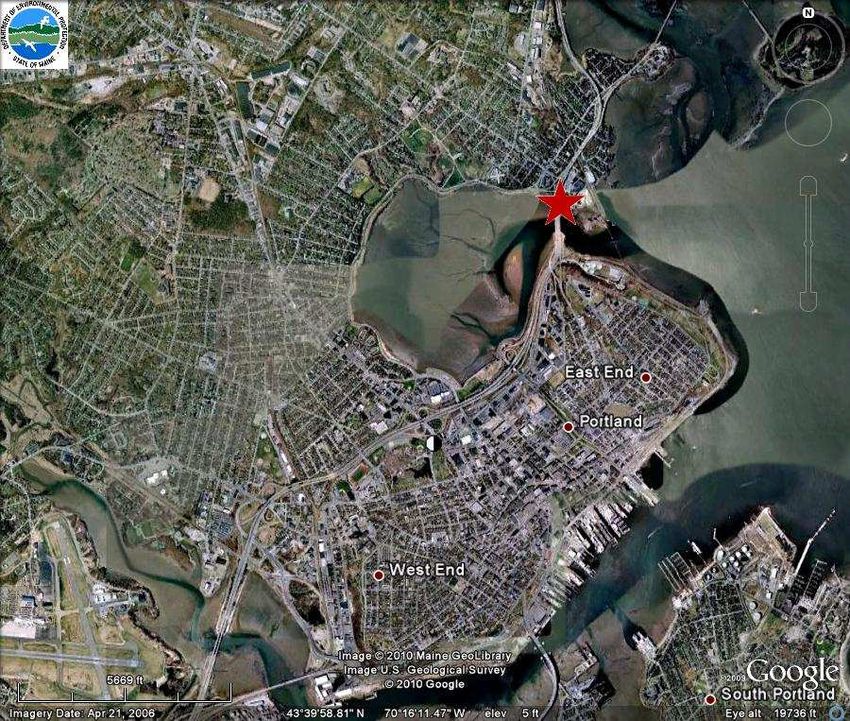

Introduction
The Maine Department of Environmental Protection (DEP) Bureau of Air Quality (BAQ) operates and maintains
a network of air samplers in the state to evaluate ambient air quality in Maine. The Code of Federal Regulations
(CFR) and the Federal Environmental Protection Agency (EPA) requires state and local agencies to conduct
ambient air quality monitoring to determine whether the ambient concentrations of pollutants in the state exceed
ambient air quality standards. The State of Maine remains in attainment with all ambient air quality standards.
Air quality data also documents trends that may be occurring in the concentrations of these pollutants, supports
the Maine DEP in providing background information for the licensing program and, when necessary, the
development of pollution control strategies. For many of the monitored pollutants, BAQ maintains an automated
polling and reporting technology that provides continuous hourly data to the public and scientific community.
These data are also used for timely forecasting of regional air quality conditions for Maine citizens and visitors
to the state.
The Maine BAQ has been monitoring air quality in Maine since the DEP was formed in 1972, working in
partnership with the EPA to uphold the tenets of the 1970 Clean Air Act and subsequent amendments. The BAQ
is responsible for most of the ambient air quality monitors located in Maine. Additional monitoring is conducted
by several federal agencies such as the EPA, the National Park Service, the U.S. Fish and Wildlife Service, the
U.S. Geological Survey, as well as by several of the Indian tribes in Maine. In 2007, Maine BAQ entered into a
Primary Quality Assurance Organization (PQAO) agreement with the Aroostook Band of Micmacs, the
Passamaquoddy Tribe at Pleasant Point and the Penobscot Indian Nation in Maine to conduct air monitoring with
shared quality assurance plans, practices and procedures.
The air-monitoring program in Maine has evolved as air quality standards have tightened, scientific knowledge
has improved, the levels of concern for different pollutants have evolved, and the technology to monitor these
pollutants has developed. The DEP initially concentrated resources on neighborhood monitoring of air pollutants,
primarily from local sources. As the impact on the ambient environment from local sources was reduced, the
state monitoring network began to focus on establishing statewide background levels and improving air quality
forecasts.

Maine is a state with many regions of varying topography. Pollutant impacts in one area of the state may be very
different from pollutant impacts in another area. Mountain valleys in the western part of the state may experience
higher pollution levels at times because of atmospheric inversions, which trap ground-level pollution in the valleys
for extended periods, whereas the coastal locations, with higher dispersion of pollutants due to the constant
onshore and offshore winds, may not. Aroostook County may record higher particulate levels because of
widespread farming operations and the type of soil found in the county. Southern Maine may record higher ozone
levels because of air masses originating from other areas of the U.S. Some pollutants monitored may come from
the other side of the world, such as particulates from volcanic eruptions, large forest fires, or emissions from less-
controlled sources in some of the rapidly developing countries around the world.
The DEP must also deal with changing federal regulations. As more data are collected and more health study
results are published, the impacts of various pollutants are reviewed. Pollution standards and controls may need
to be updated to reflect revised recommendations. The EPA is required to review the National Ambient Air
Quality Standards (NAAQS) every five years. Changing standards may mean the implementation of additional
monitoring requirements. A list of the current State and National Ambient Air Quality Standards (NAAQS) is
presented below.

                                                          1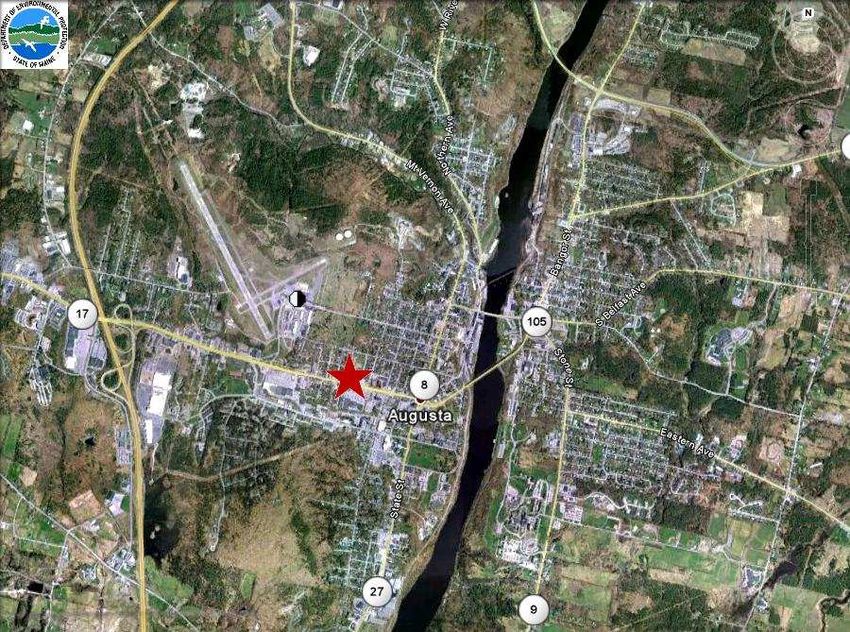
National Ambient Air Quality Standards (NAAQS)
                               from: https://www.epa.gov/criteria-air-pollutants/naaqs-table
                                                   (as of July 2018)

The EPA has set National Ambient Air Quality Standards for six principal pollutants, which are called "criteria"
air pollutants. The current standards are listed below: million (ppm) by volume, parts per billion (ppb) by
volume, and micrograms per cubic meter of air (µg/m3).

          Pollutant              Primary/      Averaging            Level                          Form
 [links to historical tables    Secondary        Time
    of NAAQS reviews]
  Carbon Monoxide (CO)           primary         8 hours           9 ppm         Not to be exceeded more than once per year
                                                 1 hour          35 ppm
         Lead (Pb)              primary and    Rolling 3      0.15 µg/m3 (1)                Not to be exceeded
                                 secondary    month average
  Nitrogen Dioxide (NO2)         primary         1 hour            100 ppb        98th percentile of 1-hour daily maximum
                                                                                   concentrations, averaged over 3 years
                                primary and      1 year         53 ppb (2)                     Annual Mean
                                 secondary
        Ozone (O3)              primary and      8 hours      0.070 ppm (3)     Annual fourth-highest daily maximum 8-hour
                                 secondary                                         concentration, averaged over 3 years

      Particle       PM2.5       primary         1 year        12.0 µg/m3            annual mean, averaged over 3 years
  Pollution (PM)
                                secondary        1 year        15.0 µg/m3            annual mean, averaged over 3 years
                                primary and     24 hours        35 µg/m3           98th percentile, averaged over 3 years
                                 secondary
                     PM10       primary and     24 hours       150 µg/m3       Not to be exceeded more than once per year on
                                 secondary                                                  average over 3 years
   Sulfur Dioxide (SO2)          primary         1 hour         75 ppb (4)        99th percentile of 1-hour daily maximum
                                                                                   concentrations, averaged over 3 years

                                secondary        3 hours           0.5 ppm       Not to be exceeded more than once per year

(1) In areas designated nonattainment for the Pb standards prior to the promulgation of the current (2008) standards, and
for which implementation plans to attain or maintain the current (2008) standards have not been submitted and approved,
the previous standards (1.5 µg/m3 as a calendar quarter average) also remain in effect.

(2) The level of the annual NO2 standard is 0.053 ppm. It is shown here in terms of ppb for the purposes of clearer
comparison to the 1-hour standard level.

(3) Final rule signed October 1, 2015, and effective December 28, 2015. The previous (2008) O3 standards additionally
remain in effect in some areas. Revocation of the previous (2008) O3 standards and transitioning to the current (2015)
standards will be addressed in the implementation rule for the current standards.

(4) The previous SO2 standards (0.14 ppm 24-hour and 0.03 ppm annual) will additionally remain in effect in certain
areas: (1) any area for which it is not yet 1 year since the effective date of designation under the current (2010) standards,
and (2)any area for which an implementation plan providing for attainment of the current (2010) standard has not been
submitted and approved and which is designated nonattainment under the previous SO2 standards or is not meeting the
requirements of a SIP call under the previous SO2 standards (40 CFR 50.4(3)). A SIP call is an EPA action requiring a
state to resubmit all or part of its State Implementation Plan to demonstrate attainment of the required NAAQS.
                                                               2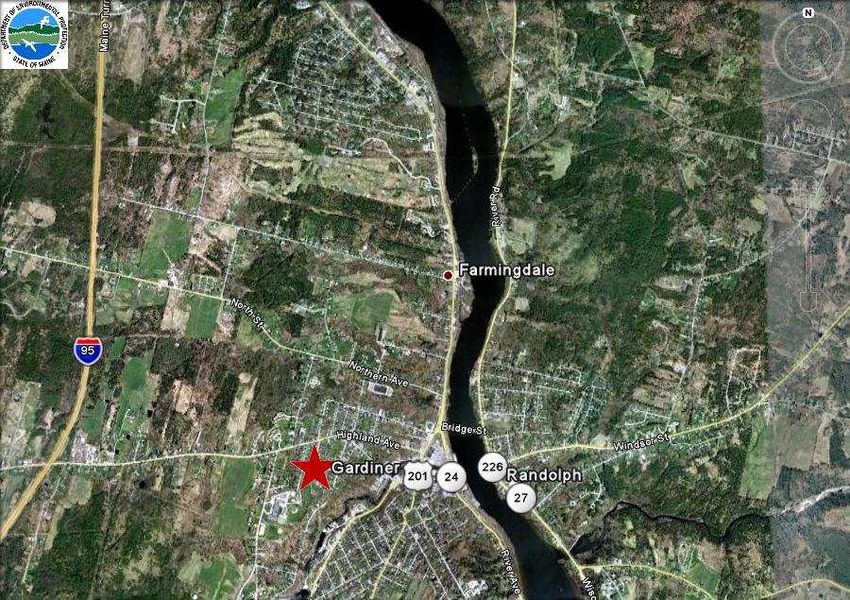
Network Overview

By July 1st of each year, the DEP is required to submit to the EPA a proposed monitoring plan for the next calendar
year. In 2006, the EPA also required states to make their proposed plan available for a 30-day comment period
prior to submittal to the EPA. The DEP annual monitoring plan is constantly subject to change as standards are
revised, new pollutants of concern are identified, monitoring sites are no longer acceptable to property owners
and staffing and budget cuts affect the ability to meet a program objective. Consequently, the monitoring plan
proposed in this document is our best effort to project what we will be able to do next year given our current
standards, staffing, and budget constraints.

The Maine DEP BAQ monitors air quality as required by the 1970 Clean Air Act and subsequent amendments,
the Code of Federal Regulations (CFR), and the Federal Environmental Protection Agency (EPA.) Much of the
monitoring effort focuses on the six criteria pollutants: ground level ozone, particulate matter, sulfur dioxide, and
nitrogen dioxide, carbon monoxide and lead.

Ozone monitoring continues to be a priority for DEP. Ozone at ground level can trigger a variety of health
problems, particularly in young children, the elderly, and those with health problems. It is also harmful to
vegetation, buildings and infrastructure. Ground level ozone is not usually emitted directly into the air from any
source, but it is created through the presence of sunlight acting on other airborne pollutants like those found in
vehicle exhaust, chemical solvents and gasoline vapors. Since the Clean Air Act of 1970, Maine has operated
ozone monitoring stations at many locations, each selected to optimize the assessment of ozone levels across the
state.

Quantification of fine airborne particulate matter (PM2.5) is another major component of the DEP ambient
monitoring program. Particulate matter (PM) is the term used for any air borne mixture of solid particles and
liquid droplets, such as those found in soot, dust, and smoke. The particles can be large enough, like pollen, to
be seen with the unaided eye, while others are so fine that they can only be detected with electron microscopes.
Of particular concern are those particles, generally 10 microns in size (PM10) and less, which are inhalable, for
they can become lodged in the lungs and even enter directly into the bloodstream. Fine particulate (PM2.5)
monitoring in Maine has been evolving since 1999 when the program was initially established. The Total
Suspended Particulate (TSP) and PM10 program in Maine began shortly after the DEP was established in 1972.
Recent DEP efforts have focused on introducing more of the continuous PM2.5 monitors into the network.

Nitrogen dioxide (NO2) is one of a group of highly reactive gasses known as "oxides of nitrogen," or "nitrogen
oxides (NOx)." EPA’s National Ambient Air Quality Standard uses NO2 as the term representing the larger group
of nitrogen oxides that include NO, NO2, NOx, and NOy. Nitrogen Oxide (NO) is created during the combustion
stage of engine and boiler operations. The NO, NO2, NOx, and NOy forms of nitrogen oxides react at different
rates in the atmosphere in a process that is dependent on sunlight and temperature. NOx is measured at ground
level while NOy is the reactive form measured at ten meters above ground level. In addition to contributing to
the formation of ground-level ozone and fine particle pollution, the oxides of nitrogen are linked with a number
of adverse effects on the respiratory system.

Sulfur dioxide (SO2) and a group of other sulfur oxides, collectively known as SOx, are emitted into the
atmosphere from the burning of fossil fuels by power plants, industrial facilities, ships, locomotives and heavy
equipment. Short-term exposure to SO2 and SOx compounds can harm the respiratory system. Children, the
elderly, and those with asthma or other breathing troubles are particularly sensitive to these sulfur compounds.

                                                         3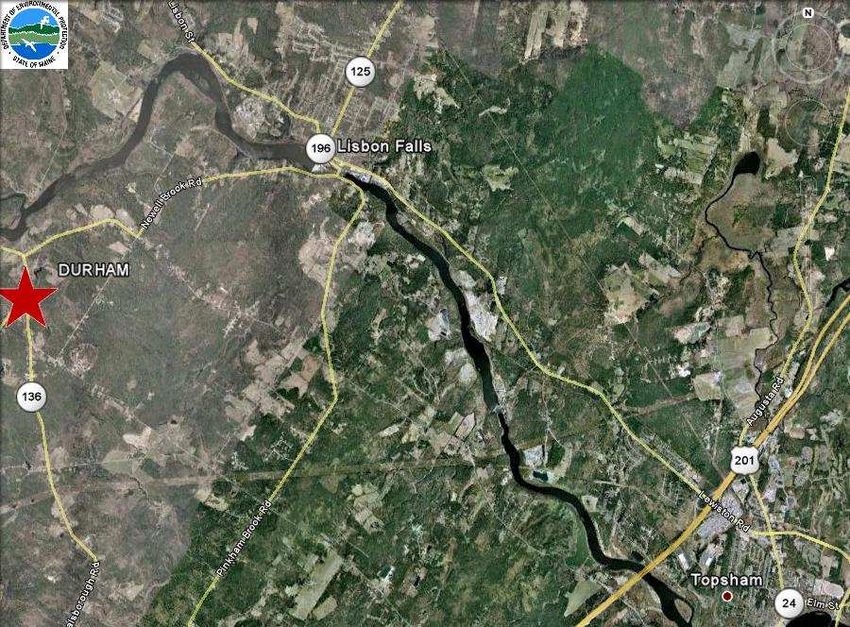
Carbon monoxide (CO) is another harmful gas emitted from combustion processes. Most of this colorless,
odorless yet extremely harmful gas comes from mobile sources like cars and trucks and found primarily in the
United States in and around large urban areas. CO reduces the amount of oxygen that can be absorbed by the
body, particularly the heart and brain. At high concentrations, CO can lead to death.

Lead (Pb) in the atmosphere is emitted as particles - mainly from smelters, ore and metal processing facilities,
waste incinerators, public utilities and lead-acid manufactures. Piston aircraft continue to use leaded aviation fuel.
Since tetraethyl lead was removed from motor vehicle fuel, the ambient levels of lead in Maine dropped
significantly and concentrations are currently at or below minimum detection limits for most Pb monitors.

The DEP also tests the ambient air for many, non-criteria, yet hazardous air pollutants (HAPs) in the state.
Because of this effort, a priority list of hazardous pollutants has been established and DEP is establishing
background concentrations for several of the pollutants on the list. The list is modified as additional data becomes
available.

The following section details the individual networks for the various parameters monitored in Maine, any changes
that are proposed, and present any identified future needs for monitoring.

Monitoring Networks
Most of the sites in the Maine air-monitoring network are designated as SLAMS - State & Local Air Monitoring
Stations. The SLAMS in Maine are part of a standardized, national network administered by the EPA in
accordance with the Clean Air Act and subsequent Federal Regulations. Every state must monitor for the criteria
air pollutants, following strict criteria set by EPA that govern all aspects of the monitoring and reporting process.
SLAMS sites must meet all stringent monitor siting requirements and utilize specified equipment types. The
pollution monitoring instruments at these sites must be approved by the EPA, and be designated as either Federal
Reference Method (FRM) or Federal Equivalence Method (FEM). In addition, SLAM site operators must follow
all quality assurance criteria, and must submit detailed quarterly and annual monitoring results to EPA. Data
from SLAMS stations are used to determine attainment/nonattainment areas.

Established in 2011, the NCore (National Core) network is comprised of a specialized subset of SLAMS sites.

                                                                                Updated July 2011

                                                              4
                https://www3.epa.gov/ttnamti1/ncorenetworks.html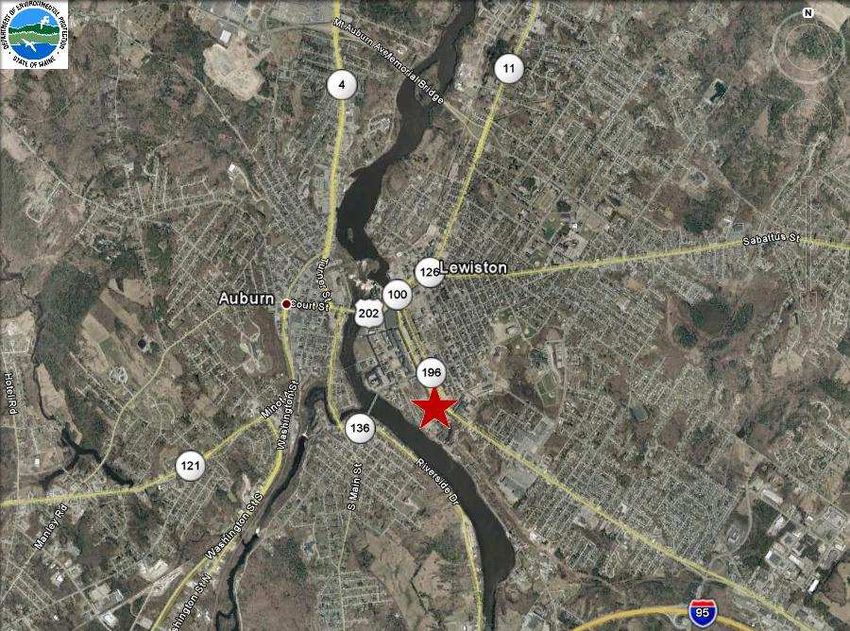
The purpose of the NCore network, in addition to aiding in the determination of nonattainment/attainment areas,
is to provide data to the scientific community, from a specific suite of monitors, that is used to make health and
ecosystem assessments, to establish long-term trends for criteria and certain precursor pollutants, and to develop
and evaluate pollutant transportation models. The NCore site in Maine, located at McFarland Hill in Acadia
National Park, near Bar Harbor, is designated as a rural or background site. At McFarland Hill the following
suite of parameters is monitored:

PM2.5 speciation                     Organic and elemental carbon, major ions and trace metals (24-hour average;
                                     every 3rd day); IMPROVE or CSN
PM2.5 FRM mass                       Filter-based 24 hr. average every 3rd day
Continuous PM2.5 mass                1 hour reporting interval; FEM or pre-FEM monitors
PM(10-2.5) mass - aka PMcoarse       Filter-based 24 hr. average every 3rd day
Ozone (O3)                           Continuous, capable of trace levels (low ppm)
Carbon monoxide (CO)                 Continuous, capable of trace levels (low ppm)
Sulfur dioxide (SO2)                 Continuous, capable of trace levels (low ppb)
Sulfate ion (SO4)                    Continuous, capable of trace levels (low ppm)
Nitrogen oxide (NO)                  Continuous, capable of trace levels (low ppb)
Total reactive nitrogen (NOy)        Continuous, capable of trace levels (low ppb)
Surface meteorology                  Continuous wind speed and direction (reported as "Resultant"), temperature, RH

The CASTNet (Clean Air Status and Trends Network) is a nationwide monitoring operation that collects air
pollutant concentrations to evaluate the effectiveness of national and regional emission control programs, to
determine compliance with the National Ambient Air Quality Standards for ozone, and to determine rural trends
in ozone, nitrogen and sulfur concentrations. It was established in 1991 as a cooperative program with the EPA,
the National Park Service, and state and local partners. CASTNet site locations in Maine are at Ashland, Howland
and at Acadia. The data are now incorporated in several regional air quality models. https://www.epa.gov/castnet

RadNet has more than 130 radiation air monitors in 50 states. Maine has two RadNet sites, one in Portland
operated by DEP, and one in Orono. https://www.epa.gov/radnet The EPA’s Radiation Network runs 24 hours
a day, 7 days a week collecting near-real-time measurements of gamma radiation. The RadNet program monitors
the nation's air, precipitation and drinking water to track radiation in the environment. Over time, RadNet sample
testing and monitoring results show the fluctuations in normal background levels of environmental radiation. The
RadNet system will also detect higher than normal radiation levels during a radiological incident.

Gamma radiation comes from many different radioactive elements, both natural and man-made. Able to penetrate
several feet of concrete or a few inches of lead, gamma particles can pose a serious health threat inside and outside
the body and the radiation can be lethal depending on the amount received. Scientists use the properties of gamma
radiation to detect the presence of radioactive elements. RadNet stationary air monitors measure gamma radiation
emitted from airborne radioactive particles as they collect on the exposed filters. Tracking gamma radiation over
time helps to create a picture of the background (normal) levels and allows EPA scientists to detect anomalies.

                                                         5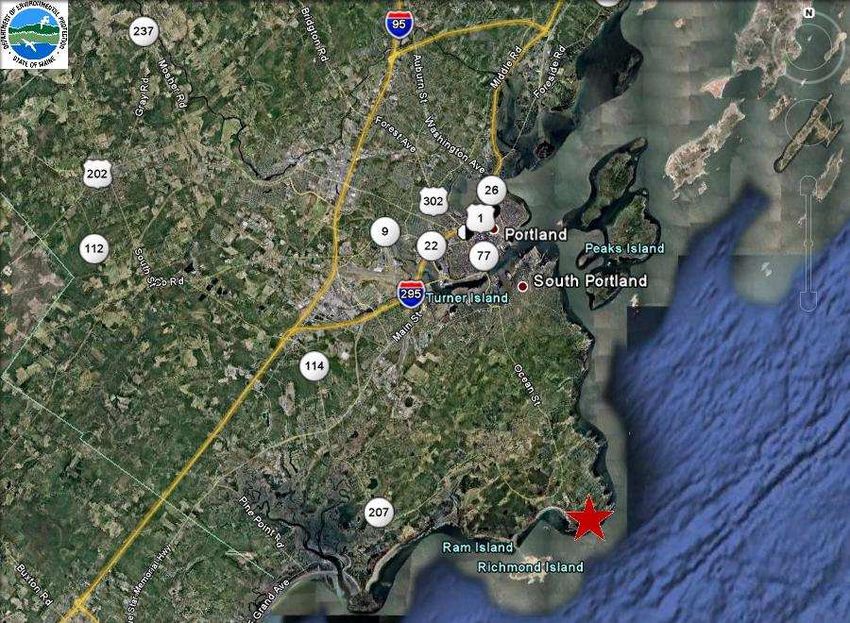
The Maine DEP operates other Special Purpose Monitors around the State. These are often set at locations to
monitor specific pollutants for a period, usually not exceeding two years, to investigate localized complaints, or
to reconnoiter a location for a possible long-term site.

The Deering Oaks Park site in Portland is a special long-term special purpose site. It is in a location, determined
by the American Lung Association, as being representative of the greater Portland area. Monitoring results at the
site are used to provide data useful in tracking relationships between pollutant levels and emergency department
visits. Since the Deering Oaks Park location does not meet SLAMS siting requirements, the ozone and nitrogen
dioxide data are not used in determining attainment or nonattainment status for criteria pollutants. The
information is useful however for other purposes such as air quality forecasting and modeling.

A continuous PM2.5 monitor operated as a special purpose monitor at the Carrabassett Valley Town Office from
November 2016 to September 6, 2017. The hourly PM2.5 values were expected to be helpful in forecasting
inversions in the Western Mountains Region of Maine. The reported values were lower than anticipated and data
from the long-running Rumford monitoring site provided similar information, so the CVTO site was discontinued.

The EPA, National Park Service, U.S. Fish and Wildlife Service (USFWS) and the U.S. Geological Survey each
operate monitoring sites in Maine as part of their respective national networks.

The Aroostook Band of Micmacs, the Passamaquoddy Tribes at Indian Township and Sipayik, and the Penobscot
Nation each operate several monitoring sites in Maine. These are independently managed but each tribe has
agreed to operate their sites in accordance with Maine DEP Quality Assurance Project Plans.

Other long-term specialized networks including IMPROVE, MDN, CAMNET and PAMS are discussed in more
detail below.

Ozone Network
The DEP currently operates ground level ozone monitoring sites throughout
the state in accordance with SLAMS network requirements. Three of the
Maine DEP sites operate year-round while the remainder are “seasonal sites.”
The EPA operates two ozone sites, in Ashland and Howland, as part of the
CASTNet. The ozone site in Howland is at tree top level and the Portland
Deering Oaks site is within a metropolitan setting so the data from these two
sites are not used for regulatory purposes. In January 2018, the Penobscot
Nation at Indian Island chose to discontinue their ozone monitoring program
and focus their efforts into addressing indoor air quality of tribal citizens.
Two other ozone sites in Maine are operated by Maine Indian tribes.

Situating an ozone monitor somewhere on the coast of Maine within the large
gap between ozone sites at Cape Elizabeth and Port Clyde remains a BAQ
objective. No changes to the existing ozone monitoring network are
anticipated in 2019.

Although the federally required ozone season for Maine runs from April through September, most of the Maine
sites now operate from the first of March through the first of October, weather permitting. The Maine sites are
scattered throughout the state, with most of them situated along the coast and in southern Maine. The highest
ozone concentrations tend to occur along the coast because plumes of contaminated air are often transported into
the Gulf of Maine from metropolitan areas to the south. These air masses are subsequently blown ashore and
                                                       6
carried inland. In addition to determining attainment/nonattainment status, the ozone sites in Maine collect data
that is used by the mapping and forecasting programs to provide the public and scientific community with quality
data in a timely fashion and to forecast air quality alerts when necessary.

 Ozone Monitoring Site Address                   Site Type      Monitoring Objective      Sampling Frequency
 Ashland - Loring AFB                            CASTNet       Background                 Continuous
 Bar Harbor - McFarland Hill                     NCore &       Transport, Background      Continuous
                                                 CASTNet
 Bar Harbor - Top of Cadillac Mountain           SLAMS         Transport                  Continuous - Seasonal
 Bethel, Smith Farm Road                         SLAMS         Max. Conc., Transport      Continuous - Seasonal
 Cape Elizabeth - Two Lights State Park          SLAMS         Transport                  Continuous
 Durham - Fire Station - Route 9                 SLAMS         Max. Concentration         Continuous - Seasonal
 Gardiner - Pray Street, Schoolyard              SLAMS         Max. Conc., Transport      Continuous - Seasonal
 Holden - Rider Bluff                            SLAMS         Max. Conc., Transport      Continuous - Seasonal
 Howland - Ameriflux Site                        CASTNet       Treetop Canopy Level       Continuous
 Jonesport - Public Landing                      SLAMS         Max. Concentration         Continuous - Seasonal
 Kennebunkport - Parsons Way                     SLAMS         Max. Conc., Transport      Continuous - Seasonal
 Perry - Pleasant Point/Sipayik, 184 County      Tribal                   -               Continuous
 Road
 Port Clyde - Marshall Point Lighthouse          SLAMS         Max. Conc., Transport      Continuous - Seasonal
 Portland - Deering Oaks                         SPMS          High Pop. Exposure         Continuous
 Presque Isle - 8 Northern Road                  Tribal                   -               Continuous
 Shapleigh - Ball Park, West Newfield Road       SLAMS         Max. Conc., Transport      Continuous - Seasonal
 West Buxton - Plains Road Fire Dept.            SLAMS         Transport                  Continuous - Seasonal

PM2.5 Network
In 1999, the DEP began a PM2.5 monitoring program, on one day in three or
one day in six sampling schedules, using filter-based samplers that met the
Federal Reference Method (FRM), with 15 sites started up during the first
year of operation. After three years of data collection demonstrated
compliance with the PM2.5 standard at all the sites, some of the samplers were
relocated or modified to collect PM10 data. Currently the DEP is monitoring
for PM2.5 using the filter-based FRM samplers at 11 sites. Continuous FEM
PM2.5 monitoring is being conducted at three Tribal sites. All the current sites
continue to comply with the PM2.5 standard yet they remain in operation to
gather additional trend data and to document future attainment status. PM2.5
filters can be analyzed to determine levels of some of the hazardous air
pollutants that are on the priority list.

The DEP initiated continuous monitoring of PM2.5 in 2000 using Tapered
Element Oscillating Microbalance (TEOM) samplers. The continuous monitors generate hourly average data that
is available in near real-time and very useful in helping to forecast air quality. TEOM sites were set up in Bangor,
Bar Harbor, Greenville, Lewiston, and Portland. The Passamaquoddy Tribe operates a TEOM monitor in Perry,
and the Micmac Tribe operates TEOM monitors in Presque Isle and Littleton. The TEOM models employed in
Maine were not an EPA-approved Federal Equivalent Method (FEM), and the DEP did not pursue the required
analysis to exclude the use of their data for comparison with the PM2.5 standards.

                                                          7
In 2012, the TEOMs were nearing the end of their expected life cycle, so that year the DEP initiated a program
to procure new continuous PM2.5 monitors known as Beta Attenuation Monitors (BAM). The BAMs are an EPA-
approved FEM, so Maine DEP monitors PM2.5 NAAQS using both the filter-based FRM and the continuous FEM
monitors throughout the state. BAMs replaced the TEOMs in Lewiston, Bangor, and Bar Harbor. The TEOM in
Portland remained in operation alongside the new BAM for comparison of methods until the end of June 2015.
Initially the BAMs were installed to supplement the filter-based FRM samplers at locations in Madawaska,
Presque Isle, and Rumford. In November 2015, a “stand-alone” continuous PM2.5 monitor was started up at a
special purpose monitoring site in Carrabassett Valley. The DEP determined that the PM data collected at the
Carrabassett Valley was not significantly different from the data being collected at Rumford, so the special
purpose monitoring project in Carrabassett Valley was shut down in early September 2017.

The continuous, hourly averaged PM2.5 record are reported in near real time to both the ME DEP web page and
the EPA AirNow web site. Access to this continuous PM2.5 data has permitted better forecasting for particulate
levels under specific weather conditions for many parts of the state. The Rumford and Carrabassett Valley sites
were chosen to meet a long-standing interest in having real-time continuous data from western mountain valley
locations. Complex meteorological conditions in Maine’s western mountains and the subsequent dispersion of
fine particulates like wood smoke are of particular interest to the DEP as it strives to produce better air quality
forecasts in a region with few monitors and sparse data. The BAQ is considering the replacement of some the
older FRM filter-based samplers with continuous PM2.5 monitors for more real-time hourly data, but the BAQ is
not yet satisfied with the correlations between continuous and filter based results, especially at the low
concentrations often found in the State. As confidence increases and additional continuous monitors are
purchased, ME DEP will be able to establish a collocated pair of continuous monitors, and subsequently stand-
alone NAAQS compliant continuous PM2.5 monitoring sites.

When the Bangor, Kenduskeag Pump Station site was established in 1978, the location was chosen because of
the heavy traffic pattern in the area. Changes in road, bridge and highway configurations over the years have
resulted in a significant reduction in the number of vehicles encountered at that monitoring site. BAQ staff,
working with the Bangor School District established a suite of PM2.5 and HAPs monitors on the roof of Mary
Snow Elementary School in August 2017. This new site is located about 1.3 miles north of the “historic”
monitoring site at the Kenduskeag Pump Station. The BAQ intends to run both monitoring stations for at least
one year to establish a relationship between the two sites. At that time, in consultation with EPA staff, the BAQ
will decide which of the two sites will remain in operation.

No other PM2.5 changes are anticipated for 2019. The following table lists the continuous and filter based sampler
sites in Maine.
                                                                                       Sampling Method and
  PM2.5 Monitoring Site Address           Site Type       Monitoring Objective
                                                                                            Frequency
  Augusta – Lincoln Street School         SLAMS         200K Pop. Coverage            FRM, every 6 days
  Augusta – Lincoln Street School         SLAMS         Collocated                    FRM, every 12 days
  Bangor – Kenduskeag Pump Station        SLAMS         AQI Forecasting/Mapping       FEM, continuous
  Bangor – Kenduskeag Pump Station        SLAMS         200K Pop. Coverage            FRM every 6 days
  Bangor – Mary Snow School               SPM           AQI Forecasting/Mapping       FEM, continuous
  Bangor – Mary Snow School               SPM           200K Pop. Coverage            FRM every 6 days
  Bar Harbor – McFarland Hill             NCore         Transport                     FRM, every 3 days
  Bar Harbor – McFarland Hill             SLAMS         Mapping                       FEM, continuous
  Lewiston – Country Kitchen Lot          SLAMS         200K Pop. Coverage            FRM, every 6 days
  Lewiston – Country Kitchen Lot          SLAMS         Mapping                       FEM, continuous
  Madawaska – Public Safety Bldg.         SLAMS         High Pop. Exposure            FRM, every 6 days
                                                        8
Sampling Method and
PM2.5 Monitoring Site Address Site Type Monitoring Objective
Frequency
Madawaska – Public Safety Bldg. SLAMS AQI Forecasting/Mapping FEM, continuous
Littleton Tribal Mapping TEOM, continuous
Perry - Pleasant Point/Sipayik, 184 Tribal Mapping TEOM, continuous
County Road
Portland – Deering Oaks SLAMS MSA of 200-500K FEM, continuous
Portland – Deering Oaks SLAMS MSA of 200-500K FEM, every 6 days
Portland – Deering Oaks SLAMS Collocated FEM, every 12 days
Portland – Tukey’s Bridge SLAMS High Traffic FRM, every 6 days
Presque Isle – 8 Northern Road Tribal Mapping FEM, continuous
Presque Isle – Regional Office SLAMS Background FRM, every 6 days
Presque Isle – Riverside Street SLAMS AQI Forecasting/Mapping FEM, continuous
Presque Isle – Riverside Street SLAMS 200K Pop. Coverage FRM, every 6 days
Rumford – Rumford Avenue SLAMS AQI Forecasting/Mapping FEM, continuous
Rumford – Rumford Avenue SLAMS High Pop. Exposure FRM, every 6 days
200K Pop. – 200,000 Population; AQI – Air Quality Index; MSA – Metropolitan Statistical Area
PM Speciation Network (IMPROVE)
Many stunning and breathtaking vistas at National Parks and Wilderness Areas
may be lost or diminished due to the haze formed by air pollutants. These light
scattering hazes cause discoloration, loss of texture, and reduced visual range.
Recognizing the importance of visual air quality, Congress included legislation
in the Clean Air Act to prevent and remedy visibility impairment. To aid in the
implementation of this legislation, the Interagency Monitoring of Protected
Visual Environments (IMPROVE) program was initiated in 1985. DEP operates
one IMPROVE site in Freeport, Maine at Wolfe’s Neck Farm. The National
Park Service and the U.S. Fish & Wildlife Service operate IMPROVE sites in
Maine’s designated Class 1 visibility areas in Acadia National Park and
Moosehorn Wildlife Refuge, respectively. IMPROVE sites are also operated by
the Penobscot and Micmac Tribes in Old Town, Indian Island, and Presque Isle,
respectively.
In 2015 the EPA reassessed each of the IMPROVE sites to optimize the Chemical Speciation Network. As a
result of that process, the Bridgton site was discontinued on January 1, 2016. The DEP understands the
continued value and importance of the IMPROVE network, and if BAQ funds become available, the Bridgeton
monitors may be re-installed.
IMPROVE Site Address Site Type Monitoring Objective Sampling Frequency
Bar Harbor – McFarland Hill NPS/NCore Regional Haze Every 3 days
Baring – Moosehorn Wildlife Ref. USFWS Regional Haze Every 3 days
Freeport – Wolfe’s Neck Road SLAMS Deposition Project Every 3 days
Indian Island – Penobscot Tribal Regional Haze Every 3 days
Presque Isle – 8 Northern Road Tribal Regional Haze Every 3 days
9PM10 Network
The DEP operates most of the current filter-based PM10 network using the FRM samplers modified with the fine-
particle separators removed to collect PM10 particles. The dichotomous samplers that collected PM2.5 and PM10-
2.5 (a.k.a., PMcoarse), and calculated PM10 as the sum of the two parameters were removed in early November 2016
and replaced with new single PM2.5 and PM10 samplers after a troublesome maintenance history threatened
recovery rates.
A continuous PM10 TEOM monitor is operated in Presque Isle as part of the
control strategy for the historically high PM10 levels there. The PM10 TEOM
provides hourly data used by city officials to determine when high levels are
occurring and whether street sweeping or other control strategies need to be
implemented.
The current PM10 network is comprised of seven sites around the state. All of the
sites are currently meeting the PM10 NAAQS with no exceedances of the standard
having been recorded anywhere during the last several years. The filters collected
in the PM10 program can be used for the lead monitoring program if needed.
As outlined in the PM2.5 section above, the PM10 monitoring at Bangor
Kenduskeag Pump Station may no longer be representative of the highest
concentration of PM10 in the city. PM10 monitoring began in August 2017 at the Mary Snow Elementary School
in Bangor. The BAQ intends to run simultaneous PM10 monitoring stations at the Kenduskeag Pump Station and
Mary Snow School for at least one year to establish a relationship between the two sites. At that time, in
consultation with EPA staff, the BAQ will decide which of the two sites will remain in operation. No other
changes are planned for 2019.
PM10 Monitoring Site Address Site Type Monitoring Objective Sampling Frequency
Augusta – Lincoln Street School SLAMS Attainment/Nonattainment FRM, every 6 days
Bangor – Kenduskeag Pump Sta. SLAMS Attainment/Nonattainment FRM, every 6 days
Bar Harbor – McFarland Hill NCore Rural Background FRM, every 3 days
Lewiston – Country Kitchen Lot SLAMS Attainment/Nonattainment FRM, every 6 days
Madawaska – Public Safety Bldg. SLAMS Attainment/Nonattainment FRM, every 6 days
Portland – Tukey’s Bridge SLAMS Attainment/Nonattainment FRM, every 6 days
Portland – Tukey’s Bridge SLAMS Collocated FRM, every 12 days
Presque Isle – Riverside Street SLAMS Attainment/Nonattainment TEOM, continuous
PMCoarse Network
Required PMCoarse, or PM10-2.5 measurements at the NCore site in Bar Harbor are obtained by the difference
method. At that site two FRM samplers collect PM10 and PM2.5 data respectively, and the difference between the
two concentrations is reported as PM10-2.5. If it becomes required, PMCoarse data, utilizing the difference method,
can be calculated from the data collected at sites in Madawaska, Bangor, Augusta, and Portland, where
simultaneous PM10 and PM2.5 data are being collected.
PMCoarse Site Address Site Type Monitoring Objective Sampling Frequency
Bar Harbor – McFarland Hill NCore Rural Background FRM, every 3 days
10Sulfur Dioxide Network
The DEP currently operates three long-term monitors for sulfur dioxide (SO2).
Two are trace-level monitors. A required trace-level monitor is located at the
NCore site in Bar Harbor and a second one operates as a rural/background site in
Gardiner. The third SO2 monitor is a special purpose sampler located in Portland
to track levels in the highest population area of the state as well as to provide urban
background data for the air emission licensing program. The Micmac Indian Tribe
operates an SO2 monitor in Presque Isle. No changes in the current long-term SO2
network are anticipated for 2019.
SO2 Monitoring Site Address Site Type Monitoring Objective Sampling Frequency
Bar Harbor – McFarland Hill NCore Background Continuous
Gardiner – Pray Street, Schoolyard SLAMS Background Continuous
Portland – Deering Oaks SPMS High Pop. Exposure Continuous
Presque Isle – 8 Northern Road Tribal - Continuous
Nitrogen Oxides Network (NO2, NOx, NO, NOy)
The DEP currently operates two trace-level NO2 monitors and two NOy monitors. The
NO2 monitors are located at the Deering Oaks site in Portland and at the Pray Street
School site in Gardiner. The two NOy monitors are located at the NCore site in Bar
Harbor and the Cape Elizabeth PAMS location. The Micmac Tribe also operates a
trace-level NO2 monitor at their site in Presque Isle. There are no other changes in
the Nitrogen Oxides Network planned for 2019.
Nitrogen Oxides Network Site Address Site Type Monitoring Objective Sampling Frequency
Portland – Deering Oaks (NO2) SPMS Maximum Concentration, Continuous
Urban Background
Bar Harbor – McFarland Hill (NOy) NCore Transport (trace-level) Continuous
Cape Elizabeth – Two Lights State Park PAMS Transport (trace-level) Continuous
(NOy)
Gardiner – Pray Street, Schoolyard (NO2) SPMS Background (trace-level) Continuous
Presque Isle – 8 Northern Road (NO2) Tribal (trace-level) Continuous
Carbon Monoxide Network
The DEP currently operates two carbon monoxide (CO) monitors. Monitors are located
at the NCore site in Bar Harbor (a trace-level) and the Deering Oaks site in Portland. The
Micmac Indian Tribe also operates a trace-level CO monitor at their site in Presque Isle.
The CO standard has been reviewed, and no change was made in the level or the form of
the standard. No changes in the Carbon Monoxide Network are planned for 2019.
11Carbon Monoxide Site Address Site Type Monitoring Objective Sampling Frequency
Bar Harbor – McFarland Hill NCore Transport Continuous
Portland – Deering Oaks SPMs High Pop. Exposure Continuous
Presque Isle – 8 Northern Road Tribal - Continuous
Enhanced Monitoring Plan
Regional transport of hazardous air pollutants has been well documented by the two
Photochemical Assessment Monitoring Station (PAMS) locations that operated in
Maine from 1993 until 2014. The PAMS compounds, known as ozone precursors,
measured at these sites play a large role in ozone formation. The data trends from
the two sites in Maine helped track the effectiveness of pollution control strategies
in upwind states. Both PAMS locations in Maine were initially required by the EPA
because of serious non-attainment areas in other states. The Maine PAMS
equipment were required to be operational for the June – August period, but
historically they were in operation during May and September also. At the end of
2014, the Cadillac Mountain PAMS site in Acadia National Park was shut down
after the EPA revised the National PAMS program.
In 2015 Appendix D to Part 58 CFR was revised such that State and local monitoring agencies “are required to
collect and report PAMS measurements at each NCore site…in a CBSA (Core-Based Statistical Area) with a
population of 1,000,000 or more.” The State of Maine is therefore no longer required to participate in the PAMS
network. Maine remains within the Eastern U.S. Ozone Transport Region however. The remaining PAMS
location at Cape Elizabeth Two Lights State Park (CETL), represents an extreme downwind site for the Greater
Connecticut area, which continues to remain in a moderate non-attainment status of the 8-hour ozone standard.
The new monitoring regulations for PAMS provide for the collection of an “enhanced” ambient air quality
database, which can be used to better characterize the nature and extent of the ozone problem, aid in tracking
volatile organic compounds (VOC) and nitrogen oxides (NOx) emission inventory reductions, assess air quality
trends, make attainment/non-attainment decisions, and evaluate photochemical grid-model performance.
The 2015 Ozone NAAQS regulation requires that all O3 moderate (and worse) Non-Attainment areas and states
in the Ozone Transport Region must develop and implement Enhanced Monitoring Plans that document the need
to collect additional data to help determine the distribution of ozone in the state and region. While the State of
Maine is not required to participate in future PAMS operations, a Regional Enhanced Monitoring Plan that
includes Maine as a contributing partner is under consideration at EPA. The BAQ contends that the continued
operation of the Cape Elizabeth site in Maine, as a part of any Enhanced Monitoring Plan, is justified as a means
to achieve historical trends, additional information and knowledge about regional ozone formation, and transport.
Additionally, ozone data collected at Maine sites in March, a month earlier than the required start of our official
ozone season yet coinciding with the official start of the season for New Hampshire, provides critical information
about ozone transport in the western region of Maine during the weeks before ozone scrubbing leaves begin to
appear on deciduous trees, and should be included in any enhanced ozone monitoring network.
Both the installation of a Pandora spectrometer at CETL (if included in an approved Enhanced Monitoring Plan),
and (if funds are available) a Ceilometer site situated somewhere near the NCore site, perhaps along the seawall
in Bar Harbor or Southwest Harbor, could be managed with existing Maine DEP staff. The Pandora spectrometer
was developed by NASA to measure total columnar concentrations of formaldehyde, ozone, sulfur dioxide,
nitrogen dioxide, and water every 80 seconds. Ceilometers use a laser or other light source to determine the height
12of a cloud ceiling or cloud base, and can also be used to measure the aerosol concentration within the atmosphere.
These two instruments provide insightful information about the chemical mixing and layering of the air column
above them which is helpful in furthering our understanding of upper air transport and important elements in the
enhanced monitoring network.
Site Address Site Type Monitoring Objective Sampling Frequency
Cape Elizabeth - Two Lights State Park PAMS Transport Continuous - Seasonal
Hazardous Air Pollutants (HAPs) Network
Although not a required monitoring network, the DEP samples for 108
HAPs compounds at six Special Purpose Monitoring Site (SPMS)
locations around the state and at the PAMS Site in Cape Elizabeth. The
monitoring objective is to document background concentrations around the
state and to establish whether there are any trends in the levels of these
compounds. Maine monitors for most HAPs compounds using EPA’s
method TO-15. As detailed in the lead section below, the DEP uses XRF
spectroanalysis on randomly selected PM2.5 and PM10 filters to determine
concentrations of several metals designated as HAPs.
As outlined in the PM2.5 and PM10 sections above, the HAPs monitoring at
Bangor Kenduskeag Pump Station may no longer be representative of the
highest concentration of hazardous air pollutants in the city. HAPs
monitoring began in August 2017 at the Mary Snow Elementary School in
Bangor. The BAQ intends to conduct simultaneous HAPs monitoring at the Kenduskeag Pump Station and Mary
Snow School for at least one year to establish a relationship between the two sites. At that time, in consultation
with EPA staff, the BAQ will decide which of the two sites will remain in operation. No other changes are planned
for 2019.
Site Address Site Type Monitoring Objective Sampling Frequency
Bangor – Kenduskeag Pump Sta. SPMS Maximum Conc.& Trends Every 6 days
Bangor – Mary Snow School SPMS Maximum Conc.& Trends Every 6 days
Cape Elizabeth – Two Lights Park PAMS Maximum Conc.& Trends Every 6 days
Lewiston – Country Kitchen Lot SPMS Maximum Conc.& Trends Every 6 days
Portland – 356 State Street SPMS Maximum Conc.& Trends Every 6 days
Presque Isle – Riverside Street SPMS Maximum Conc.& Trends Every 6 days
Rumford – Rumford Avenue SPMS Maximum Conc.& Trends Every 6 days
13Meteorological Network
The DEP, and the Passamaquoddy and Micmac tribes fund, operate and
maintain year-round meteorological monitoring sites throughout the state to
collect data for use in the analysis and evaluation of air pollutant data. Some
of these are stand-alone sites, and some are collocated with air pollutant
monitoring equipment. All of the sites measure scalar wind speed and
direction, resultant wind speed and direction, and sigma theta (an indicator of
the amount of variability in the wind direction). A few of the sites collect
additional parameters such as relative humidity, barometric pressure,
temperature, and solar radiation. State forecasters also have access to NOAA
weather data from airport stations and other sites located throughout the state,
although not all of these data consist of hourly averages from continuous
observations, making data from the DEP sites more desirable.
The Maine DEP BAQ installed meteorological instruments on a tower adjacent to a building near the Public Boat
Landing at Jonesport, Maine in 2017. Seasonal wind data there and at the Mt. Cadillac site will augment hourly
ozone concentration measurements.
Site Address Site Type Monitoring Objective Sampling Frequency
Augusta – State Airport SLAMS Data Analyses & Modeling Continuous
Bar Harbor – Cadillac Mountain SLAMS Transport Continuous – Seasonal
Bar Harbor – McFarland Hill NCore Transport Continuous
Cape Elizabeth – Two Lights Park PAMS Transport Continuous
Jonesport – Public Boat Landing SLAMS Data Analyses & Modeling Continuous – Seasonal
Presque Isle – 8 Northern Road Tribal - Continuous
Rumford - Rumford Avenue Parking SLAMS Data Analyses & Modeling Continuous
Sipayik – 184 County Road Tribal - Continuous
Atmospheric Deposition Network
There is an extensive atmospheric deposition network in the State of Maine with
several sites operated by the Maine DEP. All but two of the sites are part of the
National Atmospheric Deposition Program’s Mercury Deposition Network (MDN)
in addition to being a part of the National Trends Network (NTN) that measures
precipitation chemistry. Early in the program, several agencies and organizations
participated and provided funds for the operation of these deposition network sites.
As funds have diminished and budgets have been cut, the continued operation of
some of these sites has been in question. The MDN ad NTN data are valuable to
DEP data users, policy makers, and the public, and to various users representing
many scientific disciplines, wildlife biologists, water quality specialists,
epidemiologists, atmospheric chemists, government regulators, and academic
researchers. No changes are proposed for 2019.
14Site Address and NADP ID Site Type Monitoring Objective Sampling Frequency
Bar Harbor – McFarland Hill NPS-SPMS Transport/Trends Weekly Composite
(MDN) ME98
Bridgton – Upper Ridge Road SPMS Transport/Trends Weekly Composite
(NTN and MDN) ME02
Caribou – Airport (NTN and MDN) SPMS Transport/Trends Weekly Composite
ME00
Carrabassett Valley – Airport (NTN Tribal Transport/Trends Weekly Composite
and MDN) ME04
Freeport – Wolfe’s Neck Farm SPMS Transport/Trends Weekly Composite
(NTN and MDN) ME96
Gilead – White Mtn. Nat’l. Forest USGS Transport/Trends Weekly Composite
(NTN) ME08
Greenville Station (NTN and MDN) SPMS Transport/Trends Weekly Composite
ME09
Indian Township (NTN) ME94 Tribal Transport/Trends Weekly Composite
Lead Network
In 2008 EPA promulgated a lead (Pb) standard and issued some minimum monitoring requirements to the states.
At that time, Maine was going to be required to operate one Pb monitor in the Portland CBSA (Core-based
statistical area). The state purchased an X-ray fluorescence (XRF) analyzer to measure lead concentrations from
PM10 filters. The EPA Pb requirement was subsequently revised to require Pb monitoring at urban NCore sites
only. The Bar Harbor NCore site is designated as a rural site, so there is no requirement for Pb monitoring in
Maine.
Maine DEP maintains the capability and capacity to analyze particulate filters for Pb and other several other
metals that are listed as Hazardous Air Pollutants (HAPs) such as arsenic and chromium. As schedules permit,
random selections from archived Maine PM2.5 and PM10 filters are being analyzed with the XRF to determine
what the state background concentrations might be for lead and the other metals.
CamNet
Maine DEP, along with several other state and local agencies,
and non-profit organizations, helps support the Northeast States
for Coordinated Air Use Management (NESCAUM) operate
CamNet - a network of real time visibility cameras situated
throughout the Northeast. In Maine, there are two CamNet
locations. One is at Schoodic Point with two cameras pointing
west towards Acadia National Park on Mount Desert Island.
The other site is at Moosehorn National Wildlife Refuge with a
single camera pointing northwest between Bailyville, ME and
St. Stephen, New Brunswick. Corresponding air quality sensors
at each site allow users of CamNet to see the effects of air
pollution on visibility. https://www.hazecam.net/
15Proposed Calendar Year 2019 Network Changes
As usual, the monitoring network proposed for 2019 is an ambitious one and will require a significant effort from
Air Bureau staff to accomplish. The program is always subject to adjustment because of staffing changes, budget
cuts, and the disposition of landowners who allow the placement of air-monitoring sites on their property. The
field monitoring staff continues to look for increased efficiencies, especially through automation and improved
remote access to monitors, to optimize DEP resources.
The following changes are being contemplated or are likely to occur:
• The monitoring results at Bangor Kenduskeag Pump Station on Washington Street may no longer be
representative of the worst particulate concentrations in the city. Traffic pattern changes in Bangor have
reduced traffic flow in the area. A special PM and HAPs study was undertaken in August 2017 on the
roof of the Mary Snow Elementary School. After a review of a year’s worth of monitoring data from both
sites a decision will be made about which site will be continued.
• A special wood smoke survey was conducted during the 2016/2017 winter in Farmington, Maine at the
University of Maine at Farmington’s Prescott Field. Sampling commenced November 1, 2016 and
continued through the end of March 2017. Most of the sampling results have been reviewed. PAH samples
have yet to be analyzed and the DEP is awaiting analysis of the PM filters for levoglucosan levels to be
conducted by the New Hampshire Department of Environmental Services. A final report is expected to be
released in 2018. Future woodsmoke surveys are anticipated but none are planned for the 2019 calendar
year.
The monitors operated by the Maine DEP undergo constant review to ensure that the ambient air monitoring
network is appropriate to meet monitoring goals, does not contain irrelevant monitoring, and can be accomplished
within the available budget. The table below presents the location of each active monitor in the State. Discussions
between ME DEP and EPA Region One, working together to maintain the most complete and cost effective
ambient air monitoring network in Maine, have been identified several monitors as potential opportunities for
resource savings if they are removed from service. In the table, each monitor has been identified as meeting one
or more State objective. While there are presently no indications any of the proposed cuts would be necessary for
2019, should budget and staffing issues require cuts in the monitoring program, the table will help to determine
the relative importance of each site and assist with the decision process.
16Maine Ambient Air Monitoring Locations and Objectives as of 2018.
1718
Monitoring Equipment Used by Maine DEP

            PARAMETER                                    INSTRUMENT                          METHOD*
 Atmospheric Deposition                   Aerochem Metrics wet/dry collector
 Barometric Pressure                      Climatronics
                                          Met One
 Carbon Monoxide                          Thermo Model 48C, 48i, 48iTLE             RFCA-0981-054
                                          Teledyne API Model T300                   RFCA-1093-093
 Hazardous Air Pollutants                 24 – hour 6 liter sub-ambient canister    TO-15
                                          samplers, designed and built by ME DEP
 Lead                                     R&P/Thermo Sequential Model 2025, 2025i
                                          R&P/Thermo Single Model 2000, 2000i
                                          Spectro XEPOS XRF Spectrometer
 Mercury Deposition                       Aerochem Metrics
                                          N-CON Wet Deposition collector
 Nitrogen Dioxide                         Thermo Model 42C, 42i                     RFNA-1289-074
 Organic/Elemental Carbon                 Sunset Semicontinuous OC/EC Carbon
                                          Aerosol Analyzer
 Other Metals such as Arsenic,            R&P Sequential Model 2025, 2025i
 Chromium, etc.                           R&P Single Model 2000, 2000i
                                          Spectro XEPOS XRF Spectrometer
 Oxides of Nitrogen                       Thermo Model 42iY
 Ozone                                    Thermo Models 49C, 49i                    EQOA-0880-047
                                          Teledyne API Model T400                   EQOA-0992-087
 PM 10 Continuous                         R&P TEOM Model 1400AB                     EQPM-1090-079
 PM 10 FRM                                R&P/Thermo Sequential Model 2025, 2025i   RFPS-1298-127
                                          R&P/Thermo Single Model 2000, 2000i       RFPS-1298-126
 PM 2.5 Continuous                        MET One BAM Model 1020                    EQPM-0308-170
                                          Thermo Scientific Model 5030i SHARP       EQPM-0609-184
 PM 2.5 FRM                               R&P/Thermo Sequential Model 2025, 2025i   RFPS-0498-118 RFPS-1006-145
                                          R&P/Thermo Single Model 2000, 2000i       RFPS-0498-117 RFPS-1006-143
 PM Coarse                                Difference Method PM10-PM2.5              RFPS-0509-176
 PM Speciation                            IMPROVE Sampler
 Precipitation                            ETI Instrument Systems NOAH IV
 Relative Humidity                        Climatronics
                                          Met One
 Solar Radiation                          Climatronics
                                          Met One
 Sulfate Continuous                       Thermo Model 5020
 Sulfur Dioxide                           Thermo Model 43C, 43C-TLE, 43i, 43i-TLE   EQSA-0486-060
                                          Teledyne API Model T100                   EQSA-0495-100
 Temperature                              Climatronics
                                          Met One
 Total PAH                                Ecochem PAS 2000
 VOC’s (PAMS)                             Perkin Elmer Clarus 580
 Wind Speed/Direction                     Climatronics F460
                                          Met One
* Designated Reference and Equivalent Methods as of December 17, 2016.

                                                           19
Integrated Sampler Schedule
2019
JANUARY FEBRUARY MARCH
S M T W T F S S M T W T F S S M T W T F S
1 2 3 4 5 1 2 1 2
6 7 8 9 10 11 12 3 4 5 6 7 8 9 3 4 5 6 7 8 9
13 14 15 16 17 18 19 10 11 12 13 14 15 16 10 11 12 13 14 15 16
20 21 22 23 24 25 26 17 18 19 20 21 22 23 17 18 19 20 21 22 23
27 28 29 30 31 24 25 26 27 28 24 25 26 27 28 29 30
31
APRIL MAY JUNE
S M T W T F S S M T W T F S S M T W T F S
1 2 3 4 5 6 1 2 3 4 1
7 8 9 10 11 12 13 5 6 7 8 9 10 11 2 3 4 5 6 7 8
14 15 16 17 18 19 20 12 13 14 15 16 17 18 9 10 11 12 13 14 15
21 22 23 24 25 26 27 19 20 21 22 23 24 25 16 17 18 19 20 21 22
28 29 30 26 27 28 29 30 31 23 24 25 26 27 28 29
30
JULY AUGUST SEPTEMBER
S M T W T F S S M T W T F S S M T W T F S
1 2 3 4 5 6 1 2 3 1 2 3 4 5 6 7
7 8 9 10 11 12 13 4 5 6 7 8 9 10 8 9 10 11 12 13 14
14 15 16 17 18 19 20 11 12 13 14 15 16 17 15 16 17 18 19 20 21
21 22 23 24 25 26 27 18 19 20 21 22 23 24 22 23 24 25 26 27 28
28 29 30 31 25 26 27 28 29 30 31 29 30
OCTOBER NOVEMBER DECEMBER
S M T W T F S S M T W T F S S M T W T F S
1 2 3 4 5 1 2 1 2 3 4 5 6 7
6 7 8 9 10 11 12 3 4 5 6 7 8 9 8 9 10 11 12 13 14
13 14 15 16 17 18 19 10 11 12 13 14 15 16 15 16 17 18 19 20 21
20 21 22 23 24 25 26 17 18 19 20 21 22 23 22 23 24 25 26 27 28
27 28 29 30 31 24 25 26 27 28 29 30 29 30
1 in 12, 1 in 6, and 1 in 3 sample dates 1 in 6, and 1 in 3 sample dates 1 in 3 sample dates State Holiday
1 in 6, and 1 in 3 sample dates 1 in 3 sample dates
1 in 3 sample dates
See also: https://www3.epa.gov/ttn/amtic/calendar.html
202019 Monitoring Site Information
The following pages present descriptions of the ambient air monitoring sites maintained and operated by both
the Maine Department of Environmental Protection Bureau of Air Quality and the Tribal Nations. The
following pages present the site descriptions alphabetically by Town – Site Name. This table offers an index to
the sites based on AQS Site ID.
AQS Site ID Town - Site County Page #
23-001-0011 Lewiston – Country Kitchen Parking Lot Androscoggin 59
23-001-0014 Durham – Fire Station Androscoggin 43
23-003-0014 Madawaska – Public Safety Bldg Aroostook 61
23-003-1002 Caribou – Caribou Airport Aroostook 41
23-003-1008 Presque Isle – DEP Regional Office Aroostook 69
23-003-1011 Presque Isle – Riverside St. Aroostook 71
23-003-1100 Micmac Tribe -- Presque Isle Shelter Aroostook 80
23-003-1101 Micmac Tribe -- Littleton Aroostook 78
23-005-0002 Bridgton Cumberland 37
23-005-0015 Portland – Tukey’s Bridge Cumberland 67
23-005-0029 Portland – Deering Oaks Park Cumberland 65
23-005-2003 Cape Elizabeth – Two Lights Park Cumberland 39
23-005-9002 Freeport – Wolfes Neck Farm Cumberland 45
23-009-0102 Bar Harbor – Cadillac Mountain, Acadia National Park Hancock 31
23-009-0103 Bar Harbor – McFarland Hill, Acadia National Park Hancock 33
23-011-0008 Augusta – Civil Air Patrol Hanger Kennebec 23
23-011-0016 Augusta – Lincoln Street School Kennebec 25
23-011-2005 Gardiner – Pray Street, Schoolyard Kennebec 47
23-013-0004 Port Clyde – Marshall Point Lighthouse Knox 63
23-017-2011 Rumford – Rumford Ave. Parking Lot Oxford 73
23-017-3002 Bethel – Smith Farm Road Oxford 35
23-019-0002 Bangor – Kenduskeag Pump Station Penobscot 27
23-019-0017 Bangor - Mary Snow Elementary School Penobscot 29
23-019-1100 Penobscot Nation - Indian Island Penobscot 86
23-019-4008 Holden – Rider’s Bluff Penobscot 51
23-021-0001 Greenville Piscataquis 49
23-029-0019 Jonesport – Public Landing Washington 55
23-029-0032 Passamaquoddy Tribe -- Perry, Pleasant Point/Sipayik Washington 84
23-029-None Passamaquoddy Tribe -- Indian Township Washington 82
23-031-0038 Hollis/West Buxton – Fire Department York 53
23-031-0040 Shapleigh – Shapleigh Ball Park York 75
23-031-2002 Kennebunkport – Parson’s Way York 57
21MAINE DEPARTMENT OF ENVIRONMENTAL PROTECTION
MONITORING SITES
FOR 2019
22Town – Site: Augusta – Airport
County: Kennebec Latitude: 44.3179
Address: Augusta State Airport Longitude: -69.7919
AQS Site ID: 23-011-0008 Elevation: 107 Meters
Spatial Scale: Regional Year Established: 1981
Statistical Area: Augusta-Waterville, ME
23Augusta – Airport
Pollutant and Meteorological Parameters:
Parameter Date Began Date Ended Parameter Date Began Date Ended
PM2.5 - 24 Hr. SO2
PM2.5 - 24 Hr. Colo Ozone
PM2.5 Cont. NOx
PM10 - 24 Hr. NOy
PM10 - 24 Hr. Colo HAPs
PM10 Cont. VOCs (PAMS)
PM Coarse Wet Deposition - Mercury
IMPROVE Wet Dep. - Precip Chem.
Cont. OC/EC Wind Direction/Speed 01/20/1981
Cont. Sulfate (SO4) Outdoor Temperature
Black Carbon Bar. Pressure
Cont. PAH Relative Humidity
Lead Dew point
CO Precipitation Amount
CO2 Solar Radiation
Gamma Radiation UV-b Radiation
Site Description:
A retractable tower with wind speed and direction sensors is situated on the roof of the Airport Terminal Building at the
Augusta State Airport, 0.8 miles NW of the state capitol. The data acquisition equipment and modem are located in the
adjacent equipment shed to the west. The 10-meter tower is raised only to the height of the surrounding antennae due to the
proximity of the flight line. The tower and equipment were moved to the terminal in October 2015 because the Civil Air
Patrol Hanger, where the tower was originally situated, was slated for replacement.
Monitoring Objectives:
Modeling.
Planned changes for 2019:
None.
24You can also read