ANNUAL CLIMATE ASSESSMENT 2017 SINGAPORE - Weather.gov.sg
←
→
Page content transcription
If your browser does not render page correctly, please read the page content below
ANNUAL CLIMATE ASSESSMENT 2017
                                        SINGAPORE

Heavy   Moderate       Light

              Page 1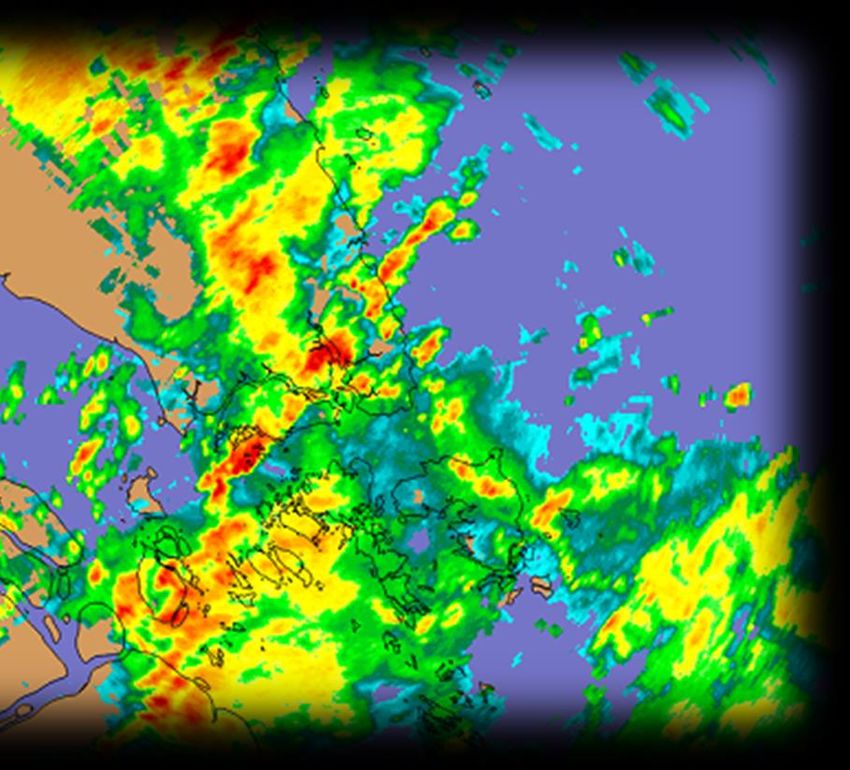
Introduction

The climate influences many aspects of our lives. How today’s climate compares with historical
records and how it is changing is a topic of interest for many stakeholders.

The Annual Climate Assessment Report provides updates on the climate trends over Singapore
and, describes the key climatic features as well as the notable weather events that have affected
Singapore during the year. It provides the information needed to understand the state of the
current climate of Singapore and place it within a historical perspective.

Page 2
Singapore Climate in 2017

After two successive record warm years in 2015 and 2016, 2017’s mean annual temperature of
27.7°C was closer to the 1981-2010 long-term climatological average. This was 0.2°C higher
than the long-term average and the joint 12th warmest year on record since 1929. The year 2017
was also Singapore’s warmest on record that was not influenced by an El Niño event, which is
indicative of the long-term warming that Singapore has been experiencing.

El Niño Southern Oscillation (ENSO 1 ), a naturally occurring phenomenon and a major
contributor to year-to-year rainfall and temperature variations over Singapore and Southeast
Asia, was neutral throughout 2017 except in November and December where it reached
borderline La Niña1 values. Given the influence ENSO has on temperatures, it is not surprising
that following the 2015-16 large El Niño1 event which contributed to 2015 and 2016 being
successive record warm years, no temperature record was broken in 2017.

Monthly temperatures in 2017 were mostly slightly above the monthly long-term average.
December registered the highest temperature anomaly of +0.6°C (Figure 1).

                                                30-year average(1981-2010)                2017
    Mean Temperature (deg

                            29

                            28

                            27
            C)

                            26

                            25
                                 Jan   Feb     Mar     Apr    May    Jun     Jul   Aug    Sep    Oct   Nov   Dec

Figure 1: Monthly mean temperatures in 2017 compared with the corresponding long-term average.

For rainfall, there was a mix of above- (wetter) and below-normal (drier) conditions for the
individual months in 2017 (Figure 2). Overall, the annual total rainfall was close to normal, which
was more likely to occur during a largely neutral ENSO year. The total rainfall of 2,045.6 mm
recorded at Changi climate station was around six percent below the 1981-2010 long-term
average of 2,165.9 mm.

                                             30-year average(1981-2010)            2017
                           350
                           300
           Rainfall (mm)

                           250
                           200
                           150
                           100
                            50
                             0
                                 Jan   Feb    Mar     Apr    May     Jun     Jul   Aug    Sep    Oct   Nov   Dec

Figure 2: Monthly rainfall in 2017 compared with the corresponding long-term average.

1 El Niño Southern Oscillation (ENSO) is a recurring climate pattern caused by interactions between the atmosphere
and the ocean in the tropical Pacific. During El Niño, the central-eastern tropical Pacific Ocean is warmer than usual,
leading to drier and warmer conditions over Southeast Asia especially during the June to October period. During La
Niña, the central-eastern tropical Pacific is cooler than average and the atmosphere over the Southeast Asia region
is typically wetter than average. El Niño or La Niña events occur on average once every three to five years.

Page 3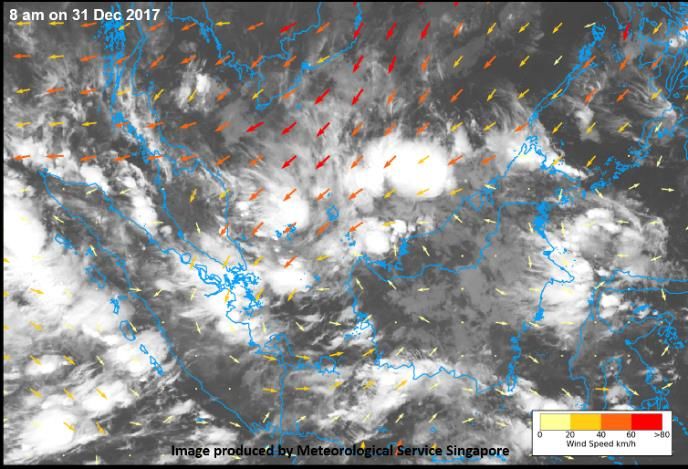
Large-scale Climate Variability in 2017: ENSO Behaviour

Following the short-lived La Niña conditions in late 2016, ENSO returned to the neutral phase
in early 2017. A notable but brief ‘coastal’ El Niño in the far eastern tropical Pacific followed soon
after around March 2017. It led to above-average rainfall conditions but its impact was limited to
the coastal regions of north-western South America (Peru, Colombia, and Ecuador) and did not
affect the western side of the Pacific Ocean, including Singapore. Up to August 2017, the sea
surface temperatures (SSTs) and the atmospheric conditions over the tropical Pacific Ocean
were neutral; Singapore’s and the nearby region’s rainfall and temperature did not show any
ENSO-related influence.

As late as August 2017, experts’ assessment of the model outlook from the European
Copernicus Climate Change Service (C3S) along with the joint Climate Prediction Centre (CPC)
and International Research Institute (IRI) indicated neutral conditions to prevail in the tropical
Pacific for the rest of 2017. In September 2017, however, the ENSO outlook (Figure 3) changed
to favour La Niña over neutral conditions from the September-November season onwards. This
was in response to the rapid cooling of sub-surface temperatures over the tropical Pacific from
August 2017. The 3-month average Nino3.4 index crossed La Niña thresholds by October 2017
(Figure 4), which is relatively late compared with the typical mid-year onset of ENSO events.
The La Niña remained within weak thresholds for the rest of 2017.

Figure 3: ENSO probabilistic forecast based on the Nino3.4 index which indicated a higher likelihood of
La Niña conditions occurring in the later part of 2017. Credit: CPC/IRI.

Page 4
Nino3.4 SST 3-month Average
  2.5

   2

  1.5

   1

  0.5

   0

 -0.5

   -1

 -1.5
                                                                                    NDJ

                                                                                                                MAM
                         FMA

                               MAM

                                     AMJ

                                                                                          DJF2017

                                                                                                          FMA

                                                                                                                      AMJ
                                           MJJ

                                                                  ASO

                                                                                                                            MJJ

                                                                                                                                                   ASO
                                                 JJA 2016

                                                                              OND
                                                                        SON

                                                                                                                                  JJA 2017

                                                                                                                                                               OND
                                                                                                                                                         SON
                                                            JAS

                                                                                                                                             JAS
                   JFM

                                                                                                    JFM
        DJF 2016

Figure 4: Three-month average Nino3.4 index, centred on month, crossed La Niña threshold by October
2017 (solid line). The dotted line represents detrended Nino3.4 values, to take into account tropical SST
warming trend. Data: ERSST version 4. Refer to the “Annual Climate Assessment 2016” for the discussion
on the detrending of Nino3.4.

As La Niña conditions developed, Southeast Asia experienced above-normal rainfall in many
parts of the region during the October-December 2017 season (Figure 5). Despite the wetter
conditions, average surface temperatures were either near- or above-normal over many areas
(Figure 6).

Figure 5: October-December 2017 seasonal average rainfall anomaly (mm/season) over the Pacific and
the eastern Indian Ocean showing large scale wet anomalies (green shades) over Southeast Asia. (Credit:
IRI Maproom.)

Page 5
Figure 6: October-December 2017 seasonal average surface temperature anomaly (˚C) showing warmer
conditions over mainland Southeast Asia and central parts of the Maritime Continent (Kalimantan,
Peninsular Malaysia, and central-north Sumatra). (Credit: IRI Maproom.)

Page 6
Intra-seasonal Climate Variability in 2017

ENSO is not the sole mode of large-scale climate variability impacting Southeast Asia that is
monitored in order to understand on-going climate anomalies. While an ENSO event’s duration
is typically of the order of a year, other phenomena can play an important role on shorter
timescales. One such phenomenon is the Madden-Julian Oscillation (MJO), an intra-seasonal
phenomenon (i.e. the duration of a typical MJO event is less than a calendar season; see inset
for details). The MJO is important to monitor as it is known to influence week-to-week variations
of rainfall and temperature over Southeast Asia.

In 2017, the MJO was active earlier in the year, in January and February, and later in October
and December. In particular, during February, October, and December 2017, a strong MJO was
active over the Maritime Continent (phase 5) and the Western Pacific and Western Hemisphere
regions (phases 6-8).

Significance of the Madden-Julian Oscillation
The MJO is a major fluctuation in tropical weather on weekly to monthly timescales. It is
characterised by an eastward moving pulse of cloud and rainfall along the equatorial region from
the Indian Ocean to the western Pacific. Each cycle typically lasts about 30 to 60 days. Research
into the MJO is important because of its potential impacts on the intra-seasonal rainfall and
                                                  temperature variations over Singapore and
                                                  the Maritime Continent.

                                                  The MJO is known to be more active from
                                                  November to March. In studies done, the MJO
                                                  has been found to enhance rainfall during cold
                                                  surges of the Northeast Monsoon season,
                                                  bringing much wetter conditions to Singapore
                                                  and the surrounding region.

                                                    The MJO’s path along the equatorial region is
Figure 7: The MJO vertical structure which has an divided into sub-geographical locations, called
upward motion section (enhanced rainfall) and a phases, marked by the position of its upward
downward motion section (suppressed rainfall). In motion (Figure 7). These are phases 2-3
this instance it is in a particular phase over the
                                                   (Indian Ocean), phases 4-5 (Maritime
Indian Ocean. Credit: NOAA Climate.
                                                   Continent), phases 6-7 (Western Pacific) and
phases 8 and 1 (Western Hemisphere and Africa). When the MJO is active over the Indian
Ocean and Maritime Continent in phases 2-4, it tends to bring enhanced rainfall over our region.
Conversely, it can bring drier conditions while in phases 6-8.

Indeed, during the third week of October (see “Notable Weather Events in 2017” section for
details), warmer conditions were experienced in Singapore at the time when a strong MJO was
transitioning from the Maritime Continent to the Western Pacific. The cloudiness over our region
was low as depicted in the longwave radiation anomalies plot in Figure 8, a typical signature
during the propagation of an active MJO. The clearer skies resulted in stronger solar heating
and hence warmer conditions on average over the region.

Page 7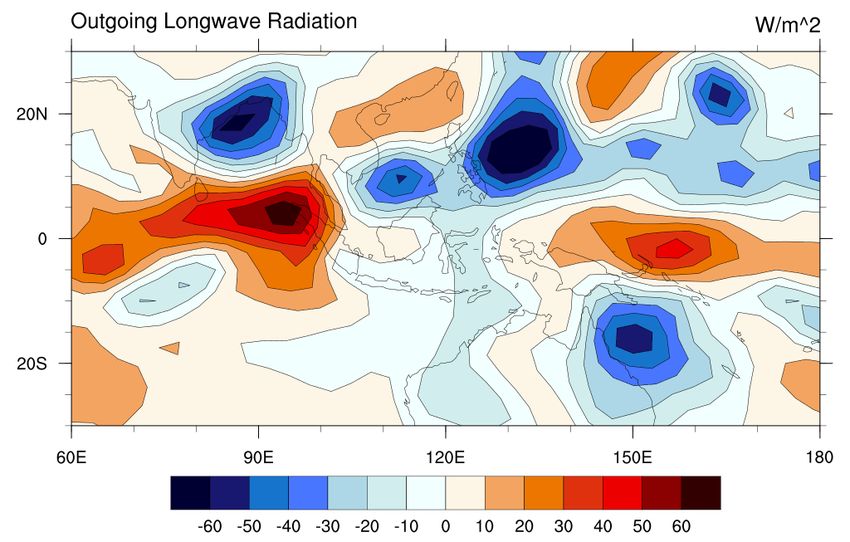
Figure 8: Outgoing longwave radiation (OLR; and indicator of cloudiness) anomalies (against 1981-2010
climatology) in Watts per square meter (W/m^2) between 17 and 22 October 2017. The positive anomalies
(red shades) show the skies over the Peninsular and Northern Sumatra during that week being much
clearer than normal, which coincided with the MJO leaving the Maritime Continent. It led to drier and
warmer conditions over the region. (Data: NOAA Interpolated OLR.)

Page 8
Temperature in 2017

          Top 12 Warmest Years                                            Top 12 Warmest Years
               since 1929                                                     since 1929 not
         (Based on the climate station)                                   influenced by El Niño
                                                                         (Based on the climate station)
  2016              28.4°C                       2017 is the warmest
                                                  year on record not   2017         27.7°C
  2015             28.3°C                        influenced by an El
                                                      Niño event       2011        27.6°C
  1998             28.3°C

                                                                       2001        27.6°C
  1997             28.3°C

                                                                       1990        27.6°C
  2010            28.1°C

                                                                       2013        27.6°C
  2002            28.1°C

                                                                       2000        27.5°C
  2005            28.0°C

                                                                       1996        27.5°C
  2009           27.9°C

                                                                       2008        27.5°C
  2014           27.9°C

                                                                       1999        27.5°C
  2004           27.9°C

  2003           27.8°C
                                                                       2012        27.5°C

                                      2017 is the joint
  2006          27.7°C                     th                          1993       27.4°C
                                     12 warmest year
                                      on record with                   1985      27.1°C
  2017          27.7°C
                                           2006
       26.0       27.0       28.0         29.0                            26.0        27.0   28.0     29.0

                                                                                      Temperature (°C)

                                                                                               29.0
                                                                                               28.8
                                                                                               28.6
                                                                                               28.4
                                                                                               28.2
                                                                                               28.0
                                                                                               27.8
                                                                                               27.6
                                                                                               27.4
                                                                                               27.2
                                                                                               27.0

Figure 9: Annual mean temperature across Singapore in 2017.

Page 9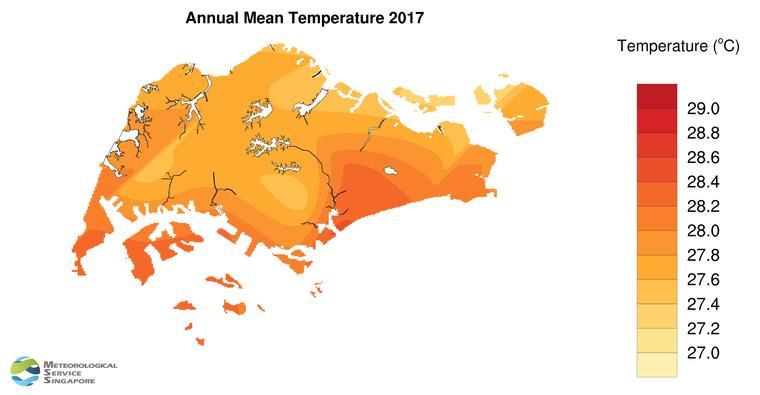
2017 was the joint 12th warmest year in Singapore with an annual mean temperature of 27.7°C.
This value was 0.7°C lower than the warmest year on record set in the previous year in 2016
and 0.2°C above the 1981-2010 long-term average. While the annual mean temperature was
closer to the 1981-2010 long-term average, 2017 is still the warmest year since 1929 that was
not influenced by an El Niño event. Warmer temperatures are generally experienced across our
region during an El Niño and the impact on Singapore’s temperature tends to be felt across two
years.

According to the World Meteorological Organization, the year 2017 was also globally the
warmest without an El Niño, indicative of the long-term global warming that the world is
experiencing. The globally-averaged temperature for 2017 was about 0.46°C above the 1981-
2010 long-term average of 14.3°C and about 1.1°C above the pre-industrial era2. Most parts of
the world experienced above-average temperatures and record warmth was observed over
some parts of the world, mostly over the ocean (see Figure 10).

    Figure 10: Global annual temperature percentiles map showing regions with record warmth in 2017.
    (Source: NOAA, GHCN-M version 3.3.0 & ERSST version 4.0.0)

2The period 1880-1900 is used as a reference period for pre-industrial conditions. In the Paris Agreement
on climate change, countries agreed to work to limit global temperature rise this century to below 2°C
above pre-industrial levels and to pursue efforts to limit the increase even further to 1.5°C.

Page 10
Rainfall in 2017
Globally, there was a mix of wetter and drier conditions in 2017, with extreme precipitation and
drought events occurring across different parts of the world.
Locally over Singapore, the annual total rainfall recorded at the Changi climate station in 2017
was close to the 1981-2010 long-term average while other parts of the island recorded slightly
above-average rainfall (Figure 11 and Figure 12).
Driest Years Since 1869 Rainfall (mm)
(Based on climate
station) 3000
2800
Driest Year
2600
2400
1997 1,118.9 mm
2200
2000
1800
1600
1400
1958 2,002.0 mm 34th
1200
1000
1957 2,016.6 mm 35th
Figure 11: Annual total rainfall distribution across Singapore in 2017.
1882 2,029.4 mm 36th
Rainfall
2017 2,045.6 mm 37th Anomaly (%)
1974 2,066.4 mm 50
38th
40
30
1894 2,069.4 mm 39th 20
10
0
2010 2,075.1 mm 40th -10
-20
-30
-40
-50
Wettest
1913 3,452.4 mm
Year
500 500 1,500 2,500 3,500 Figure 12: Annual rainfall anomalies across Singapore (relative to the
1981-2010 average) in 2017.
Page 11Monthly rainfall anomalies were also near average (Figure 13). The most notable months were
July and August when most parts of the island recorded below-average rainfall. The rainfall at
the Changi climate station was 40-50% below the average for these two months.
Rainfall Anomaly
(%)
-80 -40 0 40 80 120 160 200
January February March April
May June July August
September October November December
Figure 13: Monthly rainfall anomaly maps for 2017.
Page 12Past Temperature and Rainfall Trends
Temperature
Annual mean temperature analysis at the climate station showed an average rise of 0.25ºC per
decade from 1948 to 2017. This is comparable to the trend observed for the more recent period
between 1984 and 2017, the average rise recorded at Changi climate station is 0.26°C per
decade (refer to the last page for more information on Singapore’s climate station).
Singapore’s climate is characterised by two monsoon seasons separated by two inter-monsoon
periods. The Northeast Monsoon occurs from December to early March and the Southwest
Monsoon from June to September. The Northeast Monsoon comprises an initial wet phase,
usually from December to January, and a dry phase from February to early March.
Over the long-term period from 1984 to 2017, rising mean temperature trends were observed
throughout the year (Figure 14) at Changi climate station. Notably, the normally cooler months
of December and January recorded the highest rise compared to the other months.
Rising Rate of Mean Temperature (1984-2017)
Mean Temperature (1984-2017)
0.35 28.5
Rising Rate (°C per decade)
0.30 28.0
Temperature (°C)
0.25
27.5
0.20
27.0
0.15
26.5
0.10
0.05 26.0
0.00 25.5
Dec-Jan Feb-Mar Apr-May Jun-Jul Aug-Sep Oct-Nov
NE Monsoon NE Monsoon Inter-Monsoon SW Monsoon Inter-Monsoon
(Wet Phase) (Dry Phase)
Figure 14: Rising rate of mean temperature at the climate station (yellow bars; left axis) and the long-
term average from 1984 to 2017 (black line; right axis).
a
The extreme temperature also showed similar trends for December and January. Both the mean
daily maximum temperatures 3 and the highest daily maximum temperatures 4 showed the
highest rate of increase in the two-month period (Figure 15) and are statistically significant (i.e.
a strong trend, 0.19°C and 0.31°C per decade respectively). At Changi climate station, the
highest daily maximum temperature recorded in the December-January period was 33.1°C in
the 1980s (1984-1989) and 35.2°C in this decade (2010-2017). The differences in trends for
extreme temperatures across the different periods are more distinct compared to that for mean
temperatures (Figure 14).
3 The daily maximum temperatures averaged for all days within each of the 2-month periods.
4 The highest daily maximum temperature of all days within each of the 2-month periods.
Page 13Consistent with the rising trends in extreme temperatures, the number of warm (cool) days 5
were also observed to increase (decrease) at the strongest rate for December and January
(Figure 16).
Rising Rate of Mean Daily Maximum Temperature (1984-2017)
Rising Rate of Highest Daily Maximum Temperature (1984-2017)
0.4 33.0
Rising Rate (°C per decade)
Mean Daily Maximum Temperature (1984-2017)
32.5
0.3
Temperature (°C)
32.0
0.2
31.5
0.1 31.0
30.5
0.0
30.0
-0.1
29.5
-0.2 29.0
Dec-Jan Feb-Mar Apr-May Jun-Jul Aug-Sep Oct-Nov
NE Monsoon NE Monsoon Inter-Monsoon SW Monsoon Inter-Monsoon
(Wet Phase) (Dry Phase)
Figure 15: Rising rates of mean daily maximum temperature and the highest daily maximum
temperature recorded at the climate station (red and purple bars respectively; left axis) and the mean
daily maximum temperature (black line; right axis) for the different 2-month periods from 1984 to 2017.
Both extreme temperatures showed the highest rate of increase in December and January.
3.0 Rising Rate of Warm Days (1984-2017) Rising Rate of Cool Days (1984-2017)
Mean Temperature (1984-2017) 28.5
2.0
27.5
1.0
26.5
0.0
-1.0 25.5
-2.0 24.5
Dec-Jan Feb-Mar Apr-May Jun-Jul Aug-Sep Oct-Nov
NE Monsoon NE Monsoon Inter-Monsoon SW Monsoon Inter-Monsoon
Wet Phase Dry Phase
Figure 16: Rising rates of number of warm and cool days at the climate station(yellow and blue bars
respectively; left axis) and mean temperature (black line; right axis) for the different 2-month periods
from 1984-2017.
In summary, the temperature trends from 1984 to 2017 varied across different periods of the
year. In particular, the wet phase of the Northeast Monsoon in December and January, which is
climatologically the cooler period of the year, showed more prominent increasing trends in
extreme warm temperatures and warm days, as well as decreasing trends for cool days. These
trends indicate that the gap in extreme warm temperatures between the cooler and warmer
months of the year is narrowing. The reasons for these trends is an area that requires further
studies and research.
5
Based on temperature records at the Changi climate station with continuous observations since 1984.
Each calendar day of a year has its own thresholds for warm day and cool day which are based respectively on the
90th and 10th percentile value of the daily maximum temperatures within a 5-day window centred on the calendar
day, over the climatological period 1981-2010. For Changi climate station, the range of daily thresholds are 32.8-
33.7°C (warm days) and 29.3-30.9°C (cool days) for June; 31.6-32.6°C (warm days) and 26.7-29.2°C (cool day) for
December.
Page 14Rainfall
Using data from 1984 (the same period as that used for the temperature trends analyses in the
preceding section), the mean annual cycle of precipitation for 1984-2017 is presented here and
shows considerable variability (Figure 17).
In terms of trends, Singapore experienced a minimal rise in total yearly rainfall over the period
1984-2017 (~4.6 mm/year or 46 mm/decade)6 that is not statistically significant (i.e. the trend is
not strong and is dominated by year-to-year variations). Decomposing the annual trend into 2-
month periods, the slight upward trend is primarily driven by increased rainfall during the wetter
months of the year (i.e. October-November and April-May, the inter-monsoon months; and
December-January, the wet phase of the Northeast Monsoon season). A relatively smaller
increase is observed for June-July during the Southwest Monsoon. In contrast, the traditional
dry phase of the Northeast Monsoon (February-March) shows a considerable decrease in
decadal rainfall. While the trends are not statistically significant, they indicate that the wetter
periods are getting wetter and the drier periods getting drier.
The increase and decrease in rainfall during the wetter and drier periods respectively is a subject
of ongoing research. This is pertinent given that the December-January period also shows the
largest rise in extreme temperature indicators. The notion of higher maximum daytime
temperatures and increased rainfall is consistent with a warmer atmosphere being able to hold
more moisture, which can then lead to higher rainfall amounts from more severe rain events
when they occur. Indeed, an analysis of December hourly rainfall shows that the amount of
rainfall occurring just past the warmest time of the day (around 1-3 pm) has increased over the
decades.
30 600
Mean Rainfall over 2 months (mm)
20 500
Rising Rate (mm/decade)
10
400
0
300
-10
200
-20
Rising Rate of Rainfall (1984-2017)
-30 100
Average Rainfall (1984-2017)
-40 0
Dec-Jan Feb-Mar Apr-May Jun-Jul Aug-Sep Oct-Nov
NE Monsoon NE Monsoon Inter-Monsoon SW Monsoon Inter-Monsoon
(Wet Phase) (Dry Phase)
Figure 17: Rising rates in decadal rainfall (blue and orange bars; left axis) and mean rainfall (black
line; right axis) for the different 2-month periods from 1984-2017.
6The average increase from 1980 to 2017, using available observations from the island-wide network of
up to 28 rain gauges since 1980, was ~10 mm/year (or 100 mm/decade) but is not statistically significant.
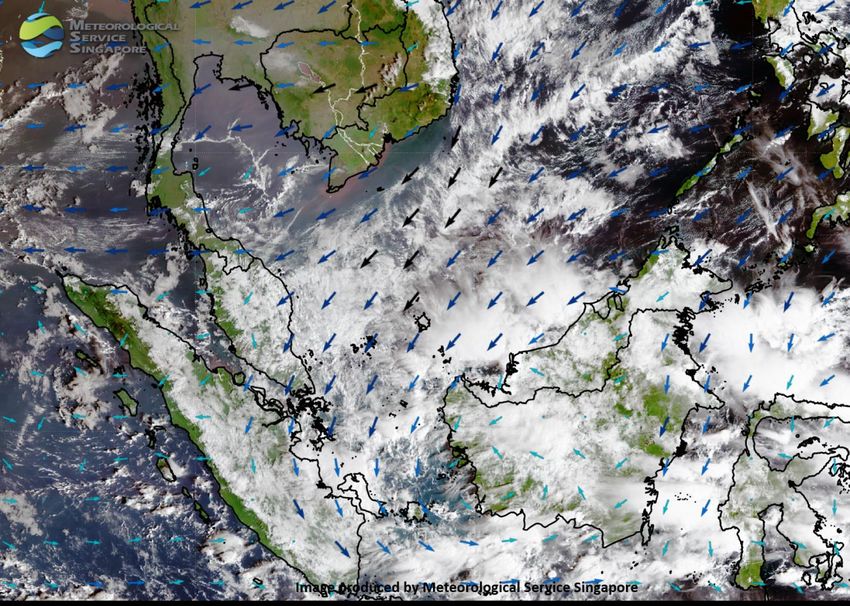
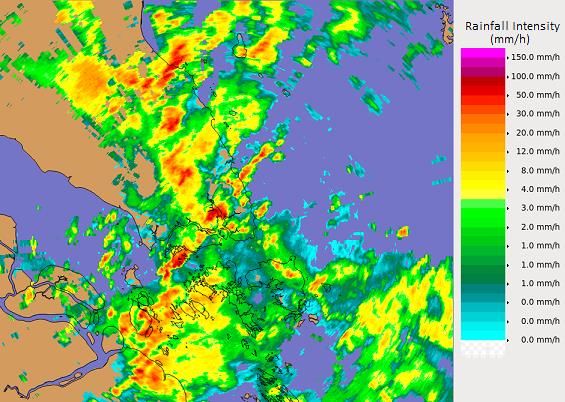
Page 15Notable Weather Events in 2017 Northeast Monsoon Surges The early part of the year saw two occurrences of monsoon surges in the South China Sea that brought windy conditions and widespread rain to Singapore. The first occurrence brought heavy downpour on 23 January that led to flash floods over several areas including Tanjong Pagar. The daily total rainfall of 106.0 mm recorded at Kallang on that day was the highest for January 2017. The second occurrence in February, a normally dry month, brought periods of rain showers from 12 to 15 February. These episodes contributed to a total of 15 rain days in February 2017, almost twice the average number for the month. The year ended on a wet note as the island experienced widespread intermittent rain (Figure 18) on the last two days of December (the last wet New Year’s Eve in Singapore was in 2012). The rainy weather was due to a monsoon surge coupled with the presence of a vortex (a large- scale atmospheric circulation) that developed over the sea to the east of Singapore (Figure 19). On 31 December, the 63.4 mm of rainfall recorded at the Changi climate station raised the month’s total to 371.2 mm, 17 percent above the long-term average for December. Based on all rainfall stations, the year’s highest daily total rainfall of 149.6 mm (at Buona Vista) was also recorded on that day. Figure 18: Weather radar image at 12.45 pm on Figure 19: Satellite image at 8 am on 31 December 31 December 2017 showing widespread rain 2017 showing extensive cloudiness in the region over Singapore and the surrounding region. due to the development of a monsoon surge. Intense Localised Thunderstorms Localised thunderstorms are common in Singapore, arising from strong solar heating of land areas. When combined with the convergence of winds over Singapore, intense thunderstorms can develop, such as on 13 December 2017 (Figure 20) when the Changi climate station recorded daily total rainfall of 69.8 mm, the highest for the year. In another episode, strong wind convergence over Singapore under the remote influence of a tropical cyclone in the region on 18 April 2017 triggered intense thunderstorms that led to flash floods in the central and southern parts of the island (Figure 21). Page 16
Figure 20: Strong solar heating and wind Figure 21: A heavy downpour left cars stranded
convergence over Singapore triggered intense in flood waters in the Orchard Road area on 18
afternoon thunderstorms on 13 December 2017. April 2017. (Photo credit: Stomp)
The highest recorded 60-minute rainfall (92 mm at Tuas) during the year resulted from intense
localised thunderstorms on 10 June 2017.
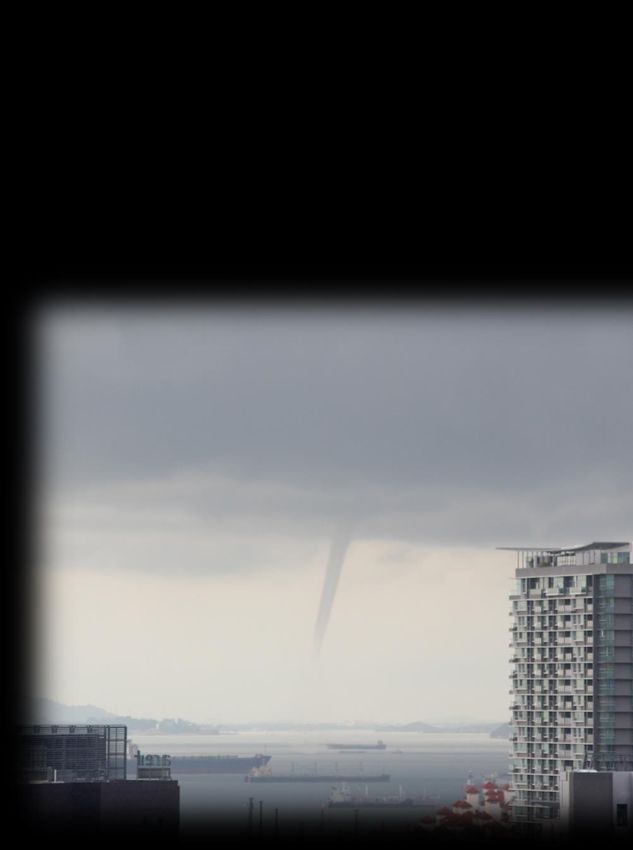
On 18 June 2017, a large waterspout, associated with intense thunderstorm clouds that
developed over the sea areas south of Singapore, was observed at around 9.10am (Figure 22).
9.10 am 18 June 2017
Figure 22: Weather radar image on the morning of 18 June 2017 (left) showing intense
thunderstorms (circled) off the southern coast of Singapore that triggered the development of a
large waterspout (right). (Photo credit: Harkiran Kaur Grewal)
In 2017, the Changi climate station recorded 181 lightning days, close to the long-term annual
average of 185 days. Lightning from a thunderstorm struck SMRT’s trackside equipment near
the Bedok MRT Station on 20 November.
Sumatra Squalls
A total of around 40 Sumatra squall events affected the island during the year. Although Sumatra
squalls usually develop in the Southwest Monsoon and inter-monsoon periods, five squalls hit
the island in the Northeast Monsoon months of January and February 2017.
Page 171.00 am 3.30 am 5.20 am
Figure 23: Sequence of weather radar images showing the passage of a Sumatra squall
moving across Singapore in the early hours and predawn on 4 January 2017.
Sumatra squalls on 23 June and 20 September were accompanied by wind gusts of up to around
90 km/h (25 m/s) at Pasir Panjang, the strongest gusts recorded for the year based on all wind
stations.
On 14 November, strong winds from a Sumatra squall uprooted a few trees in the Geylang area.
The heavy rains from the Sumatra squall also produced the highest daily total rainfall for
November 2017 based on all rainfall stations (130.6 mm at East Coast Parkway).
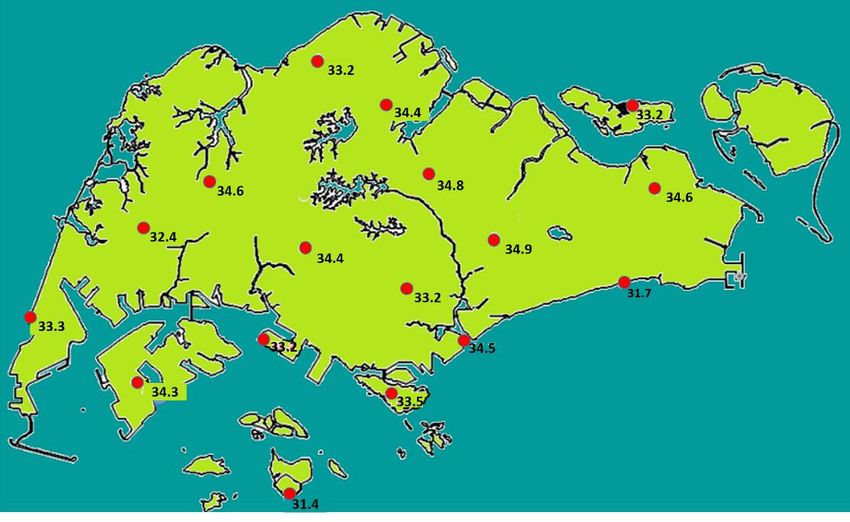
Very Warm Days
18 October 2017 at 4.18 pm
Figure 24: Very warm temperatures (deg C) across the island on 18 October 2017, the hottest
day in 2017.
Despite 2017 not being an El Niño year, there were still some very warm days in certain months.
October 2017, in particular, was warm as temperatures soared to above 35°C at some stations
across the island between 17 and 22 October. This was due to the passage of a dry air mass
moving from the Indian Ocean to the surrounding region. The hottest day in 2017 was on 18
October 2017, when a daily maximum temperature of 34.6°C was recorded at the Changi
climate station. This also tied the record for the highest daily maximum temperature for October,
last set on 11 October 2016. January and December, normally the cooler months of the year,
saw temperatures exceeding 34°C at some stations in the early part of both months this year.
Page 18General Climate of Singapore
Singapore has a tropical climate which is warm and humid, with abundant annual rainfall of
about 2,200 mm. Generally, the eastern parts of Singapore receive less rainfall compared
to other parts of the island. The winds are generally light but with a diurnal variation due to
land and sea breezes.
The temperature variation throughout the year is relatively small compared to the mid-
latitude regions. The daily temperature range has a minimum usually not falling below 23-
25ºC during the night, and a maximum usually not rising above 31-33ºC during the day.
Singapore’s climate is traditionally classified into four periods according to the average
prevailing wind direction:
Rainfall (mm)
3000
a) Northeast Monsoon (December to early March). 2800
2600
2400
2200
b) Inter-monsoon (Late March to May). 2000
1800
1600
c) Southwest Monsoon (June to September). 1400
1200
1000
d) Inter-monsoon (October to November). Average Annual Rainfall (1981-2010)
(based on 28 rainfall stations)
The transitions between the monsoon seasons occur
gradually, generally over a period of two months (the inter-monsoon periods). The winds
during the inter-monsoon periods are usually light and tend to vary in direction. The three
main rain-bearing weather systems that affect Singapore are the Northeast Monsoon
surges, “Sumatra” squalls and convective showers/thunderstorms. Convective
showers/thunderstorms occur throughout the year. “Sumatra” squalls commonly occur
during the Southwest Monsoon and inter-monsoon periods, while the monsoon surges occur
during the Northeast Monsoon season.
Sea Breeze Induced Thunderstorms: Sea breezes are winds formed as a result of
temperature differences between the land and the adjoining sea. The sea breeze, carrying
a large amount of moisture from the sea, blows inland during the day where the moist air
mixes with the rising warm land air and, under unstable conditions, form rain clouds in the
afternoon. During the inter-monsoon periods, when winds are light, sea breezes are more
common.
“Sumatra” Squalls: A “Sumatra” squall is an organised thunderstorm line that develops
over Sumatra or the Straits of Malacca, often overnight, and then moves eastward to affect
Peninsular Malaysia and Singapore. In a typical event, the squall line can bring about one
to two hours of thundery showers. Often this happens in the predawn or morning hours.
Some Sumatra squalls are also accompanied by wind gusts with speeds up to 80 km/h (22
m/s) which are strong enough to uproot trees.
Northeast Monsoon Surges: A Northeast Monsoon surge is a surge of cold air from
Central Asia. During the period December through early March, the heartland of Asia
including Siberia, experiences very low, cold temperatures. From time to time, this cold air
rushes out of Central Asia leading to an abrupt increase in northeasterly winds over the
South China Sea blowing towards the warm tropics. The sea warms and moistens the
overlaying air and the wind eventually converges to bring about widespread rain in the
tropical regions. December and January are usually the wettest months of the year in
Singapore and a few heavy rain spells, caused by surges of Northeast Monsoon winds,
contribute significantly to the rainfall in these months. A typical rain spell generally lasts for
a few days.
Page 19Network of Automatic Weather
Stations as of Dec 2017 Manned Weather Stations
Sembawang
Seletar
Tengah
Paya Lebar Changi
Legend
Stations measuring rainfall only
Stations measuring rainfall and other elements
including temperature, winds & relative humidity
About the Meteorological Service Singapore (MSS)
The MSS is Singapore’s national authority on weather and climate. It is a division under the National
Environment Agency (NEA).
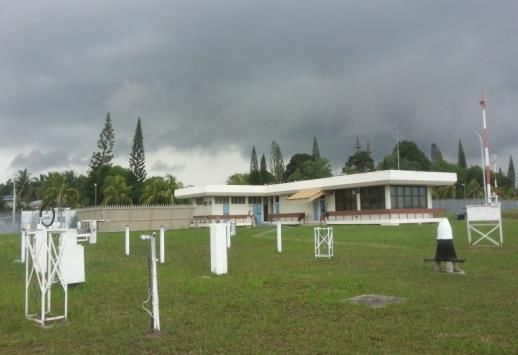
The Changi Climate Station
MSS currently operates a network of five manned
observation stations, one upper air observatory and around
80 automatic weather stations. All the automatic weather
stations measure rainfall and more than one-fifth of them
measure other meteorological elements including
temperature, relative humidity, pressure, and wind. This
observation network serves as the main source of climate
data for this report.
The manned observation station at Changi is our designated
climate station. The climate station, first located at Outram in 1869, has undergone a number of relocations
over the years due to changes in local land use, before shifting to its current site at Changi. The climate
station serves as the reference station where its records are used for tracking the national long-term climate
trends. The oldest climate station records are for monthly rainfall (starting from 1869) and temperature
(starting from 1929, with a break from 1942 to 1947).
The installation of the automatic weather station network from 2009 greatly expanded the coverage of
weather observations across Singapore. Prior to this, there were around 40 manual rainfall stations and
just a few temperature stations in Singapore. For the purpose of analysing long-term climate trends and
establishing climatological averages, only stations with continuous long-term (at least 30 years) records can
be used. This limits the number of stations available for such purpose to 28 stations for rainfall and three
stations for temperature.
Further Information
Meteorological Service Singapore : www.weather.gov.sg
Centre for Climate Research Singapore : ccrs.weather.gov.sg
Email enquiries : NEA_MSS_Engage@nea.gov.sgYou can also read