ANNUAL TABLED BUDGET 2021/22 MTREF - 30 March 2021 - Saldanha Bay ...
←
→
Page content transcription
If your browser does not render page correctly, please read the page content below

ANNUAL TABLED BUDGET

    2021/22 MTREF

       30 March 2021

              1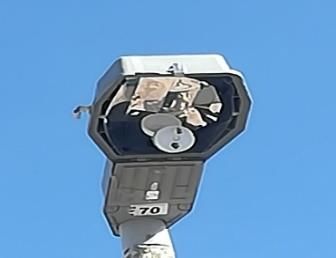
Table of Contents

PART 1: ANNUAL BUDGET .......................................................................................... 4
 1. Section 1: Mayor’s budget speech ................................................................................ 4
 2. Section 2: Resolutions ..................................................................................................... 4
 3. Section 3: Executive summary ....................................................................................... 6
   4. Section 4: Other important information ....................................................................... 22
   5. Section 5: Annual budget tables .................................................................................. 27
   PART 2: SUPPORTING DOCUMENTATION .................................................................. 28
   6. Section 6: Overview of annual budget process ......................................................... 28
   7. Section 7: Overview of the alignment of the annual budget with the IDP ............. 28
   8. Section 8: Measurable performance objectives and indicators .............................. 29
   9. Section 9: Overview of budget related policies ......................................................... 29
   10. Section 10: Overview of budget assumptions ........................................................... 29
   11. Section 11: Overview of budget funding ..................................................................... 31
   12.   Section 12:       Expenditure on allocations and grant programmes ............................. 36
   13.   Section 13:       Transfers and grants made by the municipality ................................... 36
   14.   Section 14:       Councillor allowances and employee benefits ..................................... 37
   15.   Section 15:       Monthly targets for revenue expenditure and cash flows ................... 37
   16.   Section 16:       Annual budgets and SDBIP ..................................................................... 37
   17.   Section 17:       Contracts having future budgetary implications ................................... 38
   18.   Section 18:       Capital expenditure details ...................................................................... 38
   19.   Section 19:       Legislation compliance status ................................................................. 40
   20.   Section 20:       Other supporting documents ................................................................... 40

                                                                  2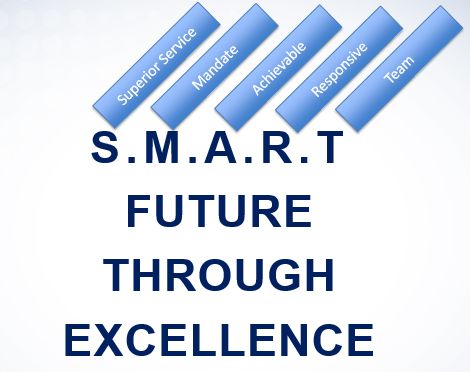
List of tables

Table 1:    High level summary of the 2021/22 MTREF .................................................... 9
Table 2:    Financial illustration of phase-in of capacity charge ....................................... 10
Table 3:    Profile of conventional vs pre-paid electricity meters ..................................... 11
Table 4:    Pre-paid electricity meters connection size of indigent households ............... 11
Table 5:    Vandalism to electrical equipment ................................................................. 13
Table 6:    Recent insurance claims relating to vandalism .............................................. 14
Table 7:    Escalation of insurance premium for the last two years ................................. 14
Table 8: Operating budget ........................................................................................... 15
Table 9: Infrastructure projects as % of total capital budget ........................................ 17
Table 10: Repairs and maintenance expenditure ........................................................ 18
Table 11: Rates and tariffs for 2021/22 ........................................................................ 18
Table 12: Financial support provided to pensioners .................................................... 20
Table 13: Auditor-General audit outcomes .................................................................. 25
Table 14: Overview of annual budget process ............................................................. 28
Table 15: Operating Revenue assumptions ................................................................. 30
Table 16: Operating Expenditure assumptions ............................................................ 30
Table 17: Capital budget assumptions ......................................................................... 31
Table 18: Funding sources of the capital budget ......................................................... 32
Table 19: Capital Replacement Reserve ..................................................................... 33
Table 20: History of the capital budget versus actual expenditure ............................... 34
Table 21: Summary external loans .............................................................................. 35
Table 22: Grants allocations ........................................................................................ 36
Table 23: Employee cost percentages ......................................................................... 37
Table 24: Capital budget per vote ................................................................................ 38
Table 25: Capital budget per town ............................................................................... 38
Table 26: Top 20 capital projects for 2021/22 .............................................................. 39

                                               List of figures

Figure 1: Western Cape sector investment in Saldanha Bay municipality ..................... 9
Figure 2: Operating Revenue budget ........................................................................... 16
Figure 3: Operating Expenditure budget ...................................................................... 16
Figure 4: Vision of the Council ..................................................................................... 22
Figure 5: Funding sources of the capital budget .......................................................... 32
Figure 6: Capital budget per ward for the 3-year MTREF ............................................ 39

                                                             3
PART 1: ANNUAL BUDGET
1. Section 1: Mayor’s budget speech
The Mayor’s budget speech for the 2021/22 Medium Term Budget and
Expenditure Framework (MTREF) will be submitted to Council on 27 May
2021, after the public participation process has been completed, and when
the annual budget is considered by Council for approval.
2. Section 2: Resolutions
It is recommended –
1. That Council approves the annual tabled budget of the municipality for the
financial year 2021/22 and the two outer years 2022/23 and 2023/24 as
per Annexure A (Budget schedules A1 to A10 and SA1 to SA 38),
Annexure B (capital budget per department), Annexure C (capital budget
per ward) and Annexure D (summaries of the capital budget);
2. That Council approves the tabled rates and tariffs as contained in
Annexure E for the 2021/22 budget year;
3. That Council takes note that the electricity tariffs as included in Annexure
E has not yet been approved by NERSA and will only be considered later
by NERSA;
4. That Council takes note of the sensitivity analysis of the proposed rates
and tariff increases for consumers as per Annexure F;
5. That Council takes note of MFMA Budget Circular 108 attached as
Annexure G;
6. That Council takes note of Western Cape Provincial Treasury Circular 5 of
2021 attached as Annexure H;
7. That Council takes note of the quality certificate signed by the Municipal
Manager as per Annexure I;
8. That Council take note of the proposed changes to the budget related
policies attached in Annexure J, which will be discussed during a
workshop with Council on 29 April 2021, and again re-submitted to Council
on 27 May 2020 for final consideration;
49. That the tabled service standards attached as Annexure K be approved;
10. That Council take note of the sector department projects of the Western
Cape Provincial Government in Saldanha Bay municipality for the 3 year
2021/22 MTEF, attached as Annexure L;
11. That the draft Top Layer SDBIP, attached as Annexure M be approved;
12. That Council take note of the list of projects funded from external loans,
attached as Annexure N;
13. That the 2021/22 MTREF Procurement Plan per Annexure O be
approved;
14. That Council takes note that version 6.5 of the mSCOA classification
framework was used to prepare the budget;
15. That the pre-paid monthly capacity fee for 40 Ampere and 60 Ampere
connections not be phased-in for 2021/22;
16. That a self-insurance reserve of R8 million is created over the 3-year
MTREF to fund the replacement of certain assets.
17. That is be noted that Annexure A will be send per separate addendum.
53. Section 3: Executive summary
3.1 Introduction
This budget is tabled exactly one year after South Africa went into a hard
lockdown on 27 March 2020. Since then in October 2020 a new variant of the
virus was discovered in South African and England which has spread globally.
Other new variants have also been reported. In December 2020, South Africa
according to its statistic models entered a second wave of COVID-19 infections.
It is expected by medical experts in South Africa, that a third wave of COVID-19
infections in South Africa’s will occur at the end of April 2021.
The South African economy last year, pre-COVID-19, was supposed to grow
with 0.9%, but due to the impact of the virus regressed to a -7.2% negative
growth. This year the economic growth is expected to be 3.3%.
At the end of December 2020, 32.5% of South Africans were unemployed. This
excludes those that are no longer seeking employment.
The financial woes of ESKOM continue to burden the South African public. On
16 February 2021 ESKOM won a court case against NERSA allowing them to
add an additional R10 billion to be recovered from consumers in the 2021/22
financial year. On 12 March 2021 NERSA issued a consultation paper indicating
that the ESKOM increase to municipality will be 17.8% for the 2021/22 financial
year. NERSA, in terms of a formula provided in their document, provides a
calculation to indicate to municipalities what their own electricity tariffs may be.
For the 2021/22 financial year it is 14.59%.
An increase of 14.59% to our consumers will be hard to swallow. As it is,
electricity carries the biggest weight in the basket of municipal services to
consumers. If the electricity increase was the same as the expected inflation
rate of 3.9%, the average municipal increase at Saldanha Bay municipality for a
small household on all services and property rates would have been 3.5%.
However, due to the 14.59% increase, it will now be 7.9%. These differentials
are also similar for medium and large households.
It is within this context that the municipal budget was prepared for the 2021/22
MTREF period.
The objective for the municipality during the budget planning process was to
keep the other rates and tariffs as low as possible to provide some relief in
this uncertain economic environment.
63.2 2021/22 National budget
Minister Mboweni delivered his budget speech on 24 February 2021.
“We owe a lot of money to a lot of people.”
This was perhaps the most significant message that came from his budget.
The gross government debt is expected to increase from R3.95 trillion (80% of
GDP) in 2020/21 to R5.2 trillion (87% of GDP) in 2023/24. Approximately 21%
of Tax Revenue will go towards the payment of the debt. The annual borrowing
requirement will remain well above R500 million in each year of the medium-
term budget to fund the budget deficit.
The budget deficit for 2021/22 will be R603 billion, or 14% of GDP.
Some of the other highlights in his budget speech is provided below:
“We have crafted a Fiscal Framework to support the economy and public
health services in the short term, while ensure the sustainability of our
public finances in the medium term”.
“For 2021/22, Revenue is projected to be R1.35 trillion, or 25.3% of
GDP. Expenditure is projected at R1.95 trillion, or 36% of GDP.”
“We are allocating more than R10 billion for the purchase and delivery
of vaccines for the next two years”.
“We shall achieve a surplus on the main budget in 2024/25.”
“We will stabilise government debt at 88.9% of GDP in 2025/26 and it
will decline thereafter.”
“Government has committed to a R791.2 billion” infrastructure
investment drive to repair or replace or expand the country’s
infrastructure.
“We (SARS) expect to collect tax revenue of R1.37 trillion in 2020/21,
which is R213 billion less that our 2020 budget expectations.”
73.3 2021/22 Western Cape Provincial budget
Minister David Maynier delivered the Western Cape Provincial Government
budget on 16 March 2021. It was labelled as “A Budget for Hope”
Some of the highlights of his budget speech is provided below:
“We have mobilised a R2.17 billion war chest to defeat the virus in the
Western Cape. We have allocated R832 million to respond to a possible
third wave”.
“We will spend R2.35 billion over the medium term on improving safety
in the Western Cape.”
“We will spend R29.09 billion over the medium term on infrastructure
in the Western Cape.”
”Six candidate municipalities has been identified to participate in the
Municipal Energy Resilience Project.”
”We will spend R217.61 billion over the medium term in municipalities
across the Western Cape.”
Saldanha Bay municipality has been included in the provincial budget speech
as one of the six candidate municipalities to participate in the Municipal
Energy Resilience Project to support municipalities to generate, procure and
sell their own power. More information about this will be provided later.
The Western Cape Provincial Government will over the next 3 years invest in
capital projects to the value of R475 million in the Saldanha Bay municipal
area (see graph below). A list of the individual projects is included in
Annexure L.
8Figure 1: Western Cape sector investment in Saldanha Bay municipality
3.4 2021/22 Saldanha Bay Municipal budget
The fourth review of the fourth generation Integrated Development Plan (IDP)
will also considered by Council on 30 March 2021 and is included in a
separate agenda item. This is the last review before the new Council will
embark on a process the develop a new IDP to be effective from 1 July 2022.
A high-level summary of the 2021/22 MTREF budget is provided in the table
below:
Table 1: High level summary of the 2021/22 MTREF
2020/21
Adjustment 2021/22 2022/23 2023/24
budget Budget Budget Budget
R R R R
Operating Revenue 1,011,442,376 1,091,519,452 1,175,717,454 1,247,416,101
Grants 219,292,332 162,348,409 183,697,880 219,131,523
Total Revenue 1,230,734,708 1,253,867,861 1,359,415,334 1,466,547,624
Capital expenditure 318,360,892 269,141,804 177,956,115 187,577,796
Operating expenditure 1,224,283,664 1,277,130,923 1,366,985,167 1,465,324,116
Total expenditure 1,542,644,556 1,546,272,727 1,544,941,282 1,652,901,912
93.5 Municipal Regulations on a Standard Chart of Accounts (mSCOA)
The municipality has prepared its budget and A schedules on version 6.5 of
the mSCOA classification framework.
3.6 2018/19 Electricity tariffs restructuring
The municipality has restructured its electricity tariffs 3 years ago during the
2018/19 financial year. A fixed monthly capacity charge, inter alia, was
included in the tariff.
To reduce the impact on the pre-paid electricity consumers, Council decided
in 2018 to phase the fixed monthly capacity charge for 40 Ampere and 60
Ampere pre-paid electricity consumers over multiple years.
For the 2021/22 financial year, being the four year since the restructuring, it is
proposed that Council, because of the high electricity increase, not phase-in the
pre-paid electricity tariff for the 40 Ampere and 60 Ampere in the 2021/22
financial year, and that it be considered again in the 2022/23 financial year. The
current phase-in % for 2021/22 will be approximately 50% of that of the
conventional electricity tariff.
See the illustration of the impact in table 2.
Table 2: Financial illustration of phase-in of capacity charge
2018/19 2019/20 2020/21 2021/22
40 A 60 A 40 A 60 A 40 A 60 A 40 A 60 A
Conventional tariff 167 250 188 283 207 311 229 344
Phased-in pre-paid tariff - - 75 100 105 150 116 166
Difference 167 250 113 183 102 161 113 178
3.7 Phase-out of conventional electricity meter installation
Saldanha bay municipality currently has 25 850 electricity meters. 76% of
these are pre-paid meters. The municipality, on 1 July 2019 started to phase-
out the installation of conventional meters. This relates to new installations
only. Current conventional electricity consumers may however convert at
their own discretion.
10The municipality previously aimed to phase out most Domestic Conventional
Meters by 2022/23. This target might need to be revised. Further details of this
will be shared by the Electrical department.
The current profile of conventional versus pre-paid is provided in the table
below.
Table 3: Profile of conventional vs pre-paid electricity meters
Households
Indigent
Commercial (excluding Other Total %
households
indigent)
Conventional 1,307 4,541 15 414 6,277 24%
Prepaid 484 11,388 7,701 - 19,573 76%
1,791 15,929 7,716 414 25,850
During the last 12 months, the conventional electricity meters has reduced from
6 793 to 6 277.
The breakdown of the pre-paid electricity meters of indigent households
according to their connection size is provided below.
Table 4: Pre-paid electricity meters connection size of indigent households
20 Ampere 2,710
30 Ampere 2,348
40 Ampere 2,199
60 Ampere 444
7,701
3.8 Electricity tariffs – NERSA approval
NERSA has published its Municipal Tariff Guideline increase document, which
is used to determine the municipal tariff increases to consumers on 12 March
2021.
The municipality has provided for an increase of 17.8% in the bulk electricity
increase from ESKOM.
11NERSA typically allows a higher percentage increase so that ESKOM can
recover the additional allowable revenue from municipalities over a 9 months
period, between 1 July – 31 March.
The municipality has provided a rate increase of 14.59% to its own electricity
consumers.
For the two outer years, the municipality has budgeted for an increase of 8.9%.
NERSA must still consider and approve the tariffs of the municipality before the
commencement of the new financial year.
3.9 Vandalism
Vandalism has a negative impact on the municipality. It not only affects service
delivery as services become temporarily unavailable immediately after it has
been vandalised, but it is also expensive to repair and replace.
Generally, the reasons for vandalism are mostly threefold:
- Theft;
- Lack of service delivery riots; and
- Meaningless acts of vandalism by youths.
To illustrate the impact of vandalism done to electrical equipment the following
table is provided.
12Table 5: Vandalism to electrical equipment
Impact on Estimated cost to
Type of How is it
Images service repair and time to Why?
vandalism vandalised
delivery repair
Streetlights - Meaningless act of
the lamp itself vandalism and
Stone throwing R3 000 per light
sometimes
1. and other forceful fitting and will take
purposely done to
methods 2 hours to repair
commit other
crimes
Streetlights -
The specific
internal wireing
area where the
inside the pole
vandalism took R2 000 per pole
Internal wireing is To sell as scrap-
2. place is now and will take 4
ripped-out copper
dark hours to repair
Meaningless act of
Streetlights -
Breaking or vandalism and
tampering with R5 000 to replace
3. tampering with possibly purposely
day/ night switch
switch done to commit
switch
other crimes
Overhead
power lines are
It can cause an The clost of a full
cut, and even
entire town to Wood poles are structure is To steal copper
4. the pole itself is
be without cut with a saw approximately conductor
cut and
electricity R200,000
dropped to
ground
The value of the
scrap copper is
Mini-substations
Mini- small in
It can cause an are held are To steal copper
substations comparison to the
entire block of secured in a metal conductor and
and damage. The cost
5. properties to box. The metal copper bus-bars
Switchgreat of repair of less
be without box is open by inside the mini-
and LV than 2kg of copper
electricity force using substation
Networks theft is
appropriate tools
approximately R50
000
133.10 Self-insurance reserve
Most recently the Waste-Water Treatment Works at Saldanha was vandalised.
The standby generator was forcefully opened, and the supply was switched off
to the plant. This was done to gain access the thick incoming copper conductors.
A summary of insurance claims to vandalism-related incidents over the last 3
years are provided below:
Table 6: Recent insurance claims relating to vandalism
Recovered from
Financial Year Claim detail Amount Claimed
Insurers
2018/19 Diazville Riots 11,754,351 7,546,319
2018/19 Other smaller claims 729,965 639,072
2019/20 Other smaller claims 847,159 64,348
2020/21 Laingville Riots 6,198,014 To be determined
2020/21 Harbour View Saldanha 5,000,000 To be determined
The claims and other insurance industry related factors have led to an increase
in the insurance premiums for the municipality. The premium increase for the
last 2 years is provided below:
Table 7: Escalation of insurance premium for the last two years
Financial Year Premium % Increase
2018/19 2,899,672
2019/20 3,871,057 33%
2020/21 5,988,254 55%
The number of insurance underwriters to insure municipal assets is limited.
There are currently only two known underwriters for municipalities in South
Africa. Insurance companies also do not want to insure all municipal assets, for
example, the risk to insure electrical cables in an open field is too high.
It has become increasing necessary for the municipality self-insurance these
types of assets. To this effect, it is recommended to create a self-insurance
reserve of R8 million over the next 3 years to fund the replacement of certain
assets. These assets will mostly be assets that are vandalised and high-risk
assets that insurance companies are not willing to insure.
143.11 Operating budget
A summary of the operating budget is provided in the table below.
Table 8: Operating budget
2020/21
2021/22 2022/23 2023/24
Adjustment
Budget Budget Budget
budget
R R R R
Revenue
Property rates 243,376,812 253,354,721 264,502,320 276,405,363
Service Charges: Electricity 364,786,397 419,580,000 462,120,000 502,760,000
Service Charges: Water 151,204,149 150,050,027 160,652,328 167,701,716
Service Charges: Waste Water Management 80,336,555 83,630,233 89,309,844 93,238,786
Service Charges: Waste Management 75,880,425 80,498,356 85,744,770 89,762,834
Rental of facilities and equipment 9,592,602 9,985,803 15,425,100 15,894,346
Interest earned - external investments 31,622,513 35,599,261 37,402,080 39,234,072
Interest earned - outstanding debtors 10,726,574 11,166,014 11,657,244 12,181,824
Fines Penalties and Forfeits 18,930,253 19,639,775 19,655,868 19,673,088
Licences or Permits 1,599,991 1,665,530 1,738,800 1,817,100
Agency services 10,395,999 10,822,225 11,298,408 11,806,824
Transfers and Subsidies: Operational 155,306,539 118,605,366 129,107,570 152,646,130
Other revenue 10,112,447 10,526,727 10,989,840 11,484,420
Development Charges 2,877,659 5,000,780 5,220,852 5,455,728
Construction Contracts - - - -
Sub-total 1,166,748,915 1,210,124,818 1,304,825,024 1,400,062,231
Plus: Capital grants and donations 63,985,793 43,743,043 54,590,310 66,485,393
Total Revenue 1,230,734,708 1,253,867,861 1,359,415,334 1,466,547,624
Own revenue (excluding grants) 1,011,442,376 1,091,519,452 1,175,717,454 1,247,416,101
Less: Expenditure
Employee Related Cost 422,799,167 436,519,823 451,827,630 471,511,677
Remuneration of councillors 13,544,835 13,971,502 14,586,336 15,242,748
Bad debt written off 24,045,536 24,045,492 25,103,508 26,233,164
Debt impairment 38,503,140 35,724,540 36,583,380 37,500,516
Depreciation and Amortisation 140,308,440 152,324,511 163,961,153 170,988,594
Finance charges 19,951,074 18,726,096 26,438,436 30,065,004
Bulk purchases 326,221,740 330,000,000 360,000,000 392,000,000
Contracted services 126,244,553 102,710,105 118,883,981 144,604,449
Transfers and Subsidies 6,452,120 5,044,354 4,950,312 5,116,812
Other materials 36,177,912 82,140,520 85,561,561 89,559,116
Other expenditure 70,035,140 67,499,807 70,294,033 73,311,455
Gain on disposal of assets - 8,424,173 8,794,837 9,190,581
Total Expenditure 1,224,283,657 1,277,130,923 1,366,985,167 1,465,324,116
Surplus/ (deficit) 6,451,051 (23,263,062) (7,569,833) 1,223,508
15The main contributors to the operating revenue and operating expenditure of
the 2021/22 financial year are as indicated in the two graphs below.
Figure 2: Operating Revenue budget
2021/22 Revenue (in millions)
Other R28
Property rates
Grants R162
R253
Fines R20
Interest R47
Rentals R10
Refuse R80
Sewage R84
Electricity R420
Water R150
Figure 3: Operating Expenditure budget
2021/22 Expenditure (in millions)
Other materials Other expenditure
R67
Transfers and
Subsidies R5
Employee cost
R437
Contracted
services R103
Councillor's
Bulk purchases remuneration R14
Bad debt written
off R24
Finance Depreciation and Debt impairment
charges R19 amortisation R152
163.12 Budgeted operating deficit
The budgeted operating deficit or surplus for the 3-year 2021/22 MTREF
period is R23 million (deficit), R8 million (deficit) and R1 million (surplus)
respectively. The reason that the municipality is budgeting for a deficit, inter
alia, in 2021/22 and 2022/23 is that the depreciation charge is not fully
cashed-back.
3.13 Capital budget - Infrastructure projects
National Treasury has urged municipality to prioritize spending on
infrastructure. The summary per category of infrastructure projects over the
MTREF is listed in the table below.
Infrastructure projects comprise 77% of the total capital budget in 2021/22,
81% in 2022/23 and 87% in 2023/24.
Table 9: Infrastructure projects as % of total capital budget
2020/21
2021/22 2022/23 2023/24
Adjustment
Budget Budget Budget
budget
Infrastructure assets
Roads Infrastructure 70,662,819 71,351,826 36,757,806 44,704,994
Storm water Infrastructure 3,704,584 5,200,867 3,146,881 7,691,180
Electrical Infrastructure 18,323,784 32,777,867 30,716,881 36,796,333
Water Supply Infrastructure 50,257,545 55,258,413 43,692,921 18,260,999
Sanitation Infrastructure 34,941,945 36,016,143 27,396,881 53,403,092
Solid Waste Infrastructure 34,524,269 1,600,000 2,500,000 2,500,000
Information and Communication Infrastructure - 4,000,000 - -
Total infrastructure projects 212,414,946 206,205,116 144,211,370 163,356,598
Other assets
Community Assets 52,340,897 27,513,538 8,178,940 4,862,841
Other Assets 11,030,853 5,950,000 2,250,000 1,310,000
Intangible Assets 6,714,398 9,150,000 5,942,696 6,679,257
Computer Equipment 12,046,177 1,843,000 3,393,059 2,109,104
Furniture and Office Equipment 1,548,792 687,150 364,050 65,000
Machinery and Equipment 9,225,309 5,193,000 5,996,000 2,944,997
Transport Assets 12,091,740 10,450,000 7,620,000 6,250,000
Land 947,780 2,150,000 - -
Total other assets 105,945,946 62,936,688 33,744,745 24,221,198
Total capital budget 318,360,892 269,141,804 177,956,115 187,577,796
Infrastructure projects as percentage of
total capital budget 67% 77% 81% 87%
173.14 Repairs and maintenance expenditure
The budget for repairs and maintenance for 2021/22, 2022/23 and 2023/24
is R59 million, R64 million and R67 million respectively (see table below).
The amounts reflected as repairs and maintenance only represents materials
and contracted services. No labour and vehicle cost incurred by the
municipality is currently allocated to repairs and maintenance due to the
absence of a full costing system. The real repairs and maintenance are
therefore higher than the amount reflected in the budget documents.
Table 10: Repairs and maintenance expenditure
2020/21
2021/22 2022/23 2023/24
Adjustment
Budget Budget Budget
budget
Repairs and maintenance 57,168,065 58,545,279 63,740,516 67,010,187
Movement from the previous year -18% 2% 9% 5%
As a % of operating expenditure 5% 5% 5% 5%
3.15 Rates and tariffs
The proposed 2021/22 rates and tariff increase percentages has been
provided in the table below. For comparability the previous 4 years’ increases
are also provided.
Table 11: Rates and tariffs for 2021/22
2017/18 2018/19 2019/20 2020/21 2021/22
Property rates (excluding vacant residential erven) 6.5% 6.5% 6.2% 4.5% 3.9%
Property rates - vacant residential erven 6.5% 6.5% 20% 10% 10%
Electricity 2.0% 6.8% 13.81% 6.22% 14.59%
Water consumption (excluding businesses) 7% 21% 5.8% 0% 0%
Water consumption: businesses 7% 21% 5.8% 0% -2%
Refuse 8% 10% 5.2% 4.5% 3.9%
Sewerage 8% 10% 15% 15% 3.9%
Sundry tariffs 10% 10% 5.2% Various Various
18The tariffs for 2022/23 and 2023/24 will increase with the inflation targets,
except for electricity and for vacant residential properties. See explanation
below.
3.16 Explanation for tariff increases above 3.9%
MFMA Circular 108, attached as Annexure G, requires that all increases
more than the inflation target of 3.9% for 2021/22 must be explained and
justified.
(a) Property rates increase with 3.9%.
Property rates are used by the municipality to provide basic services and to
perform its functions as set out in schedules 4B and 5B of the Constitution of
the Republic of South Africa, 1996. This includes installing and maintaining
of streets, roads, sidewalks, storm drainage, building regulations, provision
of local sport facilities, parks, recreational facilities and cemeteries to name a
few.
The above increase of 3.9% excludes vacant erven, which will increase with
10%, which was done to encourage development of these undeveloped
properties.
(b) The explanation for the Electricity increase is provided in section 3.8.
(c) Water will not increase. For business and industrial consumers, the water
tariff will decrease with -2%.
(d) Refuse increase with 3.9%
(e) Sewage increase with 3.9%.
(f) Sundry tariffs increase with 3.9% in general. Some of the other tariffs in
this category such as resorts will not be increased.
193.17 Financial support provided to indigent households
Saldanha Bay Municipality provides free basic services to poor households
as a means of poverty alleviation. This support is to households who are
unable to pay, or struggle to pay for their basic services.
Households with an income base below a determined threshold of R5 000,
will receive a 100% subsidy. Further relief is provided to households with an
income between R5 001 and R6 200, who will receive a subsidy of 70%.
These consumers should apply to be registered as an indigent household as
defined in the Indigent policy of Council and will be included in the indigent
register to obtain this benefit.
Indigent households will in 2021/22 receive free electricity (50 electricity units
per month, plus the service charge, plus the capacity charge based on a
maximum connection of 40 Ampere), water (6 kilolitres per month), free
refuse removal and free sanitation based on a developed erf size of 250m².
In respect of property rates, the first R185 000 value of the residential
properties of indigents are exempted.
Support is also provided to public benefit organisations by subsidising 75%
of the monthly service account.
Child headed households are furthermore subsidised in the same manner as
a 100% qualifying indigent household.
3.18 Financial support provided to pensioners
A special rebate on property rates is provided to pensioners based on their
monthly income levels, which is indicated in the table below:
Table 12: Financial support provided to pensioners
203.19 Conclusion
Currently there are much economic uncertainties. Many households and
businesses are in distress. We don’t know the answers, but we put our trust
in God and in His word.
The Lord is my rock, and my fortress, and my deliverer; my God, my strength,
in whom I will trust; my buckler, and the horn of my salvation, and my high
tower (Psalm 18:2).
214. Section 4: Other important information
4.1 Vision, mission, strategic objectives and game changer obsessions
4.1.1 Vision
The strategic intent of Council is to enhance municipal service delivery and
growth. The vision of Council is depicted in the figure below.
Figure 4: Vision of the Council
SMART is an acronym for the following aspects to give guidance to the
formulation of Council’s objectives:
- Superior service – The rendering of service which exceed normal
expectation.
- Mandate – The effective and efficient execution of Council’s mandate.
- Achievable – The setting of objectives which are realistically achievable.
- Responsive – The setting of objectives that respond to the needs of the
public.
- Team – The promotion of a consolidated approach to address the
challenges.
224.1.2 Mission
The mission statement below has been adopted by the Council to guide the
actions of the Municipality, spell out its overall goal, provide a path, and guide
decision-making. It serves to provide the framework or context within which
the Council’s strategies are formulated.
Saldanha Bay municipality is a caring institution that excels through:
- Accelerated economic growth for community prosperity
- Establishment of high quality and sustainable services
- Commitment to responsive and transparent governance
- The creation of a safe and healthy environment
- Long term financial sustainability
4.1.3 Strategic objectives
The Council has 10 strategic objectives to give effect to the vision and mission
for the municipality and are based on the 5 game changers of Council. Whilst
the mission statement provides direction for the municipality, the strategic
objectives provide a way to measure progress toward realizing the ideals set
by Council in the mission statement.
The 10 strategic objectives are:
1. To diversify the economic base of the municipality through
industrialization, de-regulation, investment facilitation, tourism
development whilst at the same time nurturing traditional economic
sectors;
2. To facilitate an integrated transport system;
3. To provide and maintain superior decentralized consumer services
(Water, sanitation, roads, storm water, waste management and
electricity);
4. To develop socially integrated, safe and healthy communities;
5. To maintain and expand basic infrastructure for economic
development and growth;
6. To be an innovative municipality through technology, best practices
and caring culture;
7. To be a transparent, responsive and sustainable decentralised
administration;
8. To ensure an effective communication system. (Media, newsletter,
marketing, IT, talking to clients, participation, internet);
239. To embrace a nurturing culture amongst our team members to gain
trust from the community; and
10. To ensure compliance as prescribed by relevant legislation.
4.1.4 Municipal Strategic focus areas
The Council also has 5 specific focus areas for achieving the vision and
mission set out for the municipality:
1. Economic Development and Growth;
2. Customer Care;
3. Technology and Innovation;
4. Cleanliness; and
5. Youth.
These focus areas serve as the foundation and framework on which the
municipality will be able to realise its vision, help to drive National and
Provincial Government’s agenda, expand and enhance its infrastructure, and
ensure that all residents have access to the essential services they require.
4.2 Cost containment measures
The municipality has implemented a cost containment policy in July 2019. Since
COVID-19, the municipality had to reduce its operating budget even more
through a cost reduction of certain line items of operating expenditure.
244.3 Auditor General – audit outcomes
Whilst the audit outcome of a municipality is not necessary a reflection on the
service delivery performance of the municipality, or its financial performance,
it does have a positive effect on the sentiment of the public, creditors and
bank in terms of the commitment of the municipality to clean administration.
The audit outcomes history since 2014/15 are provided below:
Table 13: Auditor-General audit outcomes
Year Outcome
2019/20 Unqualified with no findings (clean)
2018/19 Unqualified with no findings (clean)
2017/18 Unqualified with findings
2016/17 Unqualified with no findings (clean)
2015/16 Unqualified with no findings (clean)
2014/15 Unqualified with no findings (clean)
4.4 Saldanha Bay Industrial Development Zone (SBIDZ)
The Saldanha Bay Industrial Development Zone Licencing Company SOC Ltd
(SBIDZ) is a Schedule 3D Provincial Government Business Enterprise that was
created to promote new areas of economic growth and development to fulfil the
vision of the National Development Plan.
The SBIDZ targets upstream oil, gas and marine repair, fabrication, logistics and
related services. It operates as a Free Port (Customs Controlled Area), offering
streamlined customs processes and bespoke facilities and services to its tenants
and operators.
The SBIDZ operates as a Free Port (Customs Controlled Area) offering
streamlined customs processes and bespoke facilities and services to its tenants
and operators.
The SBIDZ was designated as a Customs Controlled Area (CCA) and Free Port,
in July 2019. The designation allows for duty and VAT-free entry of any foreign
goods intended for re-export, also reducing time and economic restrictions.
Saldanha Bay is the largest and deepest (23-meter draught) natural port in the
southern hemisphere and is the perfect place to accommodate and service a
wide range of vessels.
25COVID-19 impacted on the SBIDZ resulting that they had to reassess its goals
and objectives for the medium term. Up to date they have attracted more than
R21 billion worth of private investments into the zone. A total of 2 900 jobs were
created over the past 5 years.
During the 2020/21 financial year, the SBIDZ completed construction on the first
investment project - a specialised corrosion protection facility.
Currently the SBIDZ is in the process of constructing an additional two
investment projects involving specialised manufacturing and fabrication, as well
as partial assembly and manufacturing of components which are currently being
imported into South Africa.
In addition, the SBIDZ completed construction on the SBIDZ Access Complex
Building - a 5ha state-of-the-art commercial office facility that started taking in
tenants in September 2020.
The SBIDZ also has a robust investor pipeline that continues to grow in
manufacturing and export facilities, and new-build port infrastructure. Several
private investors have undertaken, at their own cost, bankable feasibility studies
that demonstrate demand for vessel fabrication, maintenance, recycling and
equipment servicing.
The Saldehco Offshore Supply Base in the Port of Saldanha Bay is one such
investment that has made good progress. Construction of the facility in the
SBIDZ is currently underway. The facility will offer internationally competitive
services to vessels passing along our coastline, and projects looking to
undertake surveys, exploration and production activity on the West African
Coastal Area.
The common-user Project Leasing Facility (PLF) is another development by the
SBIDZ that already delivers value in assisting with strategic government energy
projects and meeting a business need. The 12ha facility accommodates projects
with a duration shorter than 24 months and assists logistics companies and
project managers with an easy-to-access facility near the port infrastructure
when handling equipment and goods in or out of the port and zone.
Both these facilities will support investment in the SBIDZ and have received
significant backing from the Department of Trade, Industry and Competition
(DTIC). The PLF is currently providing temporary storage to SBIDZ tenants for
wind blades, nacelles and tower sections to support the national Renewable
Energy IPP Programme (REIPPP).
The SBIDZ expects more projects related to REIPPP to be rolled out in 2021.
265. Section 5: Annual budget tables
The following budget tables have been completed and are attached as
Annexure A:
- Table A1 – Budget Summary;
- Table A2 – Budgeted Financial Performance (Revenue and Expenditure
by standard classification);
- Table A3 – Budgeted Financial Performance (Revenue and Expenditure
by Municipal Vote);
- Table A4 – Budgeted Financial Performance (Revenue by Source and
Expenditure by type);
- Table A5 – Budgeted Capital Expenditure by Vote, standard
classification and funding;
- Table A6 – Budgeted Financial Position;
- Table A7 – Budgeted Cash Flows;
- Table A8 – Cash Backed reserves / accumulated surplus reconciliation;
- Table A9 – Asset Management; and
- Table A10 - Basic service delivery measurement.
The supporting schedules SA1 to SA 38 are also included as part of
Annexure A.
27PART 2: SUPPORTING DOCUMENTATION
6. Section 6: Overview of annual budget process
The overview of the 2021/22 Budget and IDP process is provided in the table
below.
Table 14: Overview of annual budget process
Budget and IDP timetable approved by Council 25 August 2020
07 September 2020 -
IDP public participation process
30 September 2020
15 Oct 2020
Budget steering committee meetings 30 Nov 2020
8 Feb 2021
01 September 2020 -
Departments requested to budget in accordance with IDP needs
January 2021
Table Budget and IDP to Council 30 Mar 2021
Advertise budget in the local newspaper 2 April 2021
Public participation meetings 6 -17 April 2021
Closing of comments and representations on the IDP and tabled budget 23 Apr 2021
Workshop with Council on budget related policies and public inputs 29 Apr 2021
LGMTEC engagement with Provincial Treasury 4 May 2021
Consideration of final budget approval by Council 27 May 2021
7. Section 7: Overview of the alignment of the annual budget
with the IDP
The IDP serves as a guideline to the municipality for the correct budget and
resource allocations in ensuring that it meets the needs of its residents. It is
also an integrated inter-governmental system of planning which requires the
involvement of all three spheres of government. Contributions are made by
provincial and national government to assist municipal planning and therefore
government has created a range of policies and strategies to support and
guide development and to ensure alignment between all spheres of
government as stated by the section 24 of the Municipal Systems Act, No 32
of 2000.
The IDP drives the strategic development of SBM. The Municipality’s budget
is influenced by the municipal strategic focus areas and strategic objectives
identified in the IDP. The Service Delivery Budget Implementation Plan
(SDBIP) ensures that the Municipality implements programmes and projects
based on the IDP targets and associated budgets.
28The budget has been compiled in accordance with the municipality’s IDP
document. Also refer to tables SA3, SA4 and SA5 which is aligned with the
strategic objectives and goals of the municipality.
8. Section 8: Measurable performance objectives and
indicators
This budget is indicative of our commitment to achieving the objectives of
local government set out in the Constitution of the Republic of South Africa
and to do so in an efficient, effective and sustainable manner. These
commitments are entrenched in our mission, vision and value statements and
as such are reflected so in our budget and services delivery processes.
The MTREF has been compiled in such a manner to ensure sustainable
service delivery and to invest in infrastructure that will ensure growth over the
medium term to long term.
The measurable performance objectives are indicators included in the budget
tables SA4 and SA7.
9. Section 9: Overview of budget related policies
The proposed amendments to the budget related policies are attached as
Annexure J.
10. Section 10: Overview of budget assumptions
The following assumptions were used in the preparation of the budget:
29Table 15: Operating Revenue assumptions
The average estimated CPIX that were used the determine the tariff increases was 3.9%
1. for 2021/22, 4.2% for 2022/23 and 4.4% for 2023/24 as guided by MFMA Circular 108.
Refer to section 3.15 and 3.16 for more information about the tariff increases.
2. Rates and tariffs are cost reflective in compiling a funded budget.
Indigent free basic services are financed from the Equitable share. Refer to section 3.17
3.
for more information about the indigent subsidies.
4. A debtors payment rate of 96%.
National grants was budgeted in accordance with Division of Revenue Bill and gazetted
5.
allocations.
6. Provincial grants was budgeted in accordance with the Provincial Gazette.
7. The EPWP grant was based on the DORA allocation of R 2 646 000 for 2021/22.
Electricity tariffs budgeted to increase 14.59%, 8.9% and 8.9% respectively over the
8.
MTREF. Refer to section 3.8 for more information.
Table 16: Operating Expenditure assumptions
The general CPIX rates that was used for the operating expenses for 2021/22 is 3.9%, for
1. 2022/23 is 4.2%, and for 2023/24 is 4.4%. All expenditure types however do not increase
with the same percentage points.
A Salary and Wage Collective Agreement to be implemented from effective 1 July 2021 still
has to be concluded. As there is still uncertainty of how much the increase will be, the
2.
municipality has budgeted for an increase of 2%, plus a TASK grading scale notch
increase of 1%, therefore 3% in total.
3. No new employment positions were budgeted for.
4. Departments were required to budget in terms of general cost containment measures.
No increase was provided for the bulk water purchases tariff from the West Coast District
5. municipality. Water bulk purchases is budgeted under inventory consumed and losses from
2021/22.
An increase of 17.8% was provided for the bulk electricity purchases in respect of 2021/22
6.
and 8.9% for the two outer years. NERSA still to determine the increase for 2021/22.
30Table 17: Capital budget assumptions
Cash-backed depreciation (growth contributor for CRR) of 2021/22 R66 million, 2022/23
1.
R77 million and 2023/24 R77 million is budgeted.
Additional transfer from accumulated surplus to the CRR of 2021/22 R28 million, 2022/23
2.
R23 million and 2023/24 R15 million is budgeted.
Annual development charges (growth contributor for CRR) of R5 million 2021/22, R5 million
3.
2022/23 and R5 million for 2023/24 is budgeted.
4. Capital budget funding source from CRR is limited to R 291 million over 3 year MTREF.
5. External loans of R179 million to partially fund the 2021/22 3-year MTREF capital budgets.
6. R7.5 million provided for ward based specific capital projects for 2021/22.
11. Section 11: Overview of budget funding
The budget must be funded from actual revenue to be collected during the
financial year and must be cost reflective. The Operating budget is funded
from Revenue as indicated in the relevant A schedules attached.
The 3-year MTREF capital budget is R635 million. The capital budget is
funded from various sources of which the Capital Replacement Reserve is
the biggest contributor.
A summary of the capital budget funding sources is provided in the table and
graph below:
31Table 18: Funding sources of the capital budget
2020/21
2021/22 2022/23 2023/24
Adjustment
Budget Budget Budget
Funding source budget
Capital Replacement Reserve 252,043,555 145,469,362 75,480,805 69,933,357
External borrowings 2,331,543 79,929,389 47,885,000 51,159,046
Regional Housing Board 27,044,014 19,072,003 31,038,010 42,174,992
Integrated National Electricity Programme 3,000,000 5,087,000 3,000,000 3,000,000
Municipal Infrastructure Grant 18,345,450 19,284,050 20,552,300 21,310,401
Regional Socio-Economic Project Grant 6,712,168 - - -
Sport and Recreation 853,710 - - -
Fire Service capacity grant 732,000 - - -
Vredenburg Urban Revitalisation Grant 5,725,000 - - -
Donations (Transnet and Afrisam) 1,573,452 - - -
Municipal Interventions Grant - 300,000 - -
Total 318,360,892 269,141,804 177,956,115 187,577,796
Figure 5: Funding sources of the capital budget
2021/22 MTREF funding sources (in millions)
Municipal
MIG R61 Interventions Grant
R0.3
INEP R11
Housing grant R92
CRR R291
Loans R179
3211.1 Capital Replacement Reserve (CRR)
The municipality has set aside cash to replace assets or to acquire new
assets. Since the implementation of General Recognised Accounting
Practices (GRAP), and the subsequent implementation of depreciation
charges in local government the capital replacement reserve’s contributions
is part of the depreciation charges. With the unbundling of infrastructure
assets when GRAP was initially implemented the value of Property Plant and
Equipment increased substantially. The status of the CRR is provided in the
table below.
Table 19: Capital Replacement Reserve
Adjusted
2021/22 2022/23 2023/24
Budget
Budget Budget Budget
January 2021
Opening balance on 1 July 219,805,134 44,125,565 50,725 736,217
Plus: Contributions
Cash backed depreciation 67,742,691 66,054,422 77,363,680 77,427,569
Additional transfer from accumulated surplus 17,641,828 28,935,120 22,775,145 14,869,145
Capital contributions: Received 2,877,659 5,000,780 5,220,852 5,455,728
Transfer to employee benefits obligation - 11,898,200 - 13,595,800 - 15,193,380 - 17,129,666
Transfer from New municipal building reserve - 21,000,000 - 13,000,000 - 10,000,000
Transfer to Insurance reserve - - 6,000,000 - 1,000,000 - 1,000,000
Less: Capital Spending - 238,653,811 - 89,473,827 - 75,480,805 - 69,933,357
Rolled over to 2021/2022 55,995,535 - 55,995,535 - -
Funding change from loans to CRR - 69,385,271 - - -
Closing balance on 30 June 44,125,565 50,725 736,217 425,636
The capital replacement reserve was always maintained in a responsible
manner allowing the municipality to acquire assets through this internal
funding source and without too much reliance on external borrowings and
grants. When the capital budget was not spent in its entirety for a year, the
funds were carried forward to complete the projects.
As a result of the high demand for services, the capital replacement reserve
is almost depleted over the 3-year MTREF period. It is estimated that the
CRR’s balance will be only R425 636 at the end of 2023/24.
A history of the capital budget expenditure has been provided below as well
as the budgeted estimates up to 2023/24. It is estimated that at the end of
this 14-year period the municipality would have invested over R2.6 billion into
capital projects.
33Table 20: History of the capital budget versus actual expenditure
Actual/ Capital Capital
Year Estimate Budget Expenditure %
2010/11 Actual 183,265,000 109,959,000 60%
2011/12 Actual 133,213,000 101,241,880 76%
2012/13 Actual 196,544,000 139,546,240 71%
2013/14 Actual 208,661,530 145,156,473 70%
2014/15 Actual 236,336,670 225,459,000 95%
2015/16 Actual 215,809,476 145,951,261 68%
2016/17 Actual 232,280,911 200,678,559 86%
2017/18 Actual 319,470,526 238,420,533 75%
2018/19 Actual 302,125,856 237,399,184 79%
2019/20 Actual 299,871,949 185,631,883 62%
2020/21 Estimate 318,360,892 286,524,803 90%
2021/22 Estimate 269,141,804 242,227,624 90%
2022/23 Estimate 177,956,115 160,160,504 90%
2023/24 Estimate 187,577,796 168,820,016 90%
3,280,615,525 2,587,176,960 79%
11.2 Housing Development Fund
The housing development fund is administered in terms of the Housing Act,
Act 107 of 1997. This funding source is insignificant in its contribution to the
capital budget.
3411.3 External loans
Provision is made over the 3-year 2021/22 MTREF period for new loans of
R179 million. The table below provides for a reconciliation of new and historic
loans. The list of the projects funded from external loans is attached as
Annexure N.
Table 21: Summary external loans
New and Loan as %
Actual/ Opening proposed new Closing of Own
Year Budget Own revenue balance Redemption loans balance Revenue
2013/14 Actual 620,326,400 65,785,639 - 12,189,934 - 53,595,705 9%
2014/15 Actual 668,648,315 53,595,705 - 11,046,527 - 42,549,178 6%
2015/16 Actual 800,983,969 42,549,178 - 7,431,794 91,338,856 126,456,240 16%
2016/17 Actual 889,072,903 126,456,240 - 22,627,124 58,180,000 162,009,116 18%
2017/18 Actual 964,938,493 162,009,116 - 19,046,042 17,822,852 160,785,926 17%
2018/19 Actual 959,772,014 160,785,926 - 17,163,902 - 143,622,024 15%
2019/20 Budget 1,023,776,394 143,622,024 - 18,761,706 - 124,860,318 12%
2020/21 Budget 1,011,442,376 124,860,318 - 12,153,348 - 112,706,970 11%
2021/22 Budget 1,091,519,452 112,706,970 - 14,263,204 79,929,389 178,373,155 16%
2022/23 Budget 1,175,717,454 178,373,155 - 19,216,478 47,885,000 207,041,677 18%
2023/24 Budget 1,400,062,231 207,041,677 - 22,843,412 51,159,046 235,357,311 17%
178,973,435
Total: 2021/22- 2023/24 = R 178.9 million
If these loans are taken up in future, it will have an adverse impact on rates
and tariffs. However, historically the municipality has annually recorded
material budget savings on its operating expenditure budget. These budget
saving are then utilized to reduce future loans. The abovementioned 3-year
borrowings are only indicative and may change in future.
Although the interest cost of these borrowing has been included in the
MTREF budget, it may change in future.
3512. Section 12: Expenditure on allocations and grant
programmes
The total grants to be received for 2021/22 comprises R162 million, and for
the two outer years are R183 million and R219 million respectively. The split
between the various grants are listed below.
Table 22: Grants allocations
2020/21
2021/22 2022/23 2023/24
Classification Adjustment
Budget Budget Budget
budget
National Allocations
Finance Management Grant Operating 1,550,000 1,550,000 1,550,000 1,550,000
Municipal Infrastructure Grant Capital 18,345,450 19,284,050 20,552,300 21,310,401
Municipal Infrastructure Grant Operating 965,550 1,014,950 1,081,700 1,121,599
Integrated Electrification Programme Capital 3,000,000 5,087,000 3,000,000 3,000,000
Expanded Public Works Programme Operating 2,870,000 2,646,000 - -
Equitable Share Operating 109,613,000 101,876,000 110,087,000 112,721,000
Total National DORA grants 136,344,000 131,458,000 136,271,000 139,703,000
Provincial Allocations
Housing and Human Settlement Operating 31,160,913 3,828,000 8,810,990 29,585,010
Housing and Human Settlement Capital 27,044,014 19,072,003 31,038,010 42,174,992
Cultural affairs: Library service Operating 6,056,000 6,676,000 6,789,000 6,904,000
Community Development Worker Grant Operating 224,641 75,000 75,000 75,000
WOSA Grant Operating 826,720 - - -
Regional Socio-Economic Project Capital 6,712,168 - - -
Proclaimed Main Roads Grant Operating 135,000 135,000 135,000 135,000
Sports and Recreation Capital 853,710 - - -
Vredenburg Urban Revitalisation grant Capital 5,725,000 - - -
Humanitarian relief grant Operating 679,589 - - -
Fire Service capacity grant Capital 732,000 - - -
Intervention Grant Capital - 300,000 - -
WC Financial Management Capacity Building grant Operating 692,474 250,000 - -
Total Provincial grants 80,842,229 30,336,003 46,848,000 78,874,002
Other grants
Donation: Transnet Capital 1,573,451 - - -
SETA Grants Operating 532,652 554,416 578,880 554,521
Total other grants and donations 2,106,103 554,416 578,880 554,521
Total grants 219,292,332 162,348,419 183,697,880 219,131,523
Split between:
- Operating grants Operating 155,306,539 118,605,366 129,107,570 152,646,130
- Capital grants Capital 63,985,793 43,443,053 54,590,310 66,485,393
Total grants 219,292,332 162,048,419 183,697,880 219,131,523
13. Section 13: Transfers and grants made by the municipality
The total transfers and grants amount to R5 million in 2021/22, and R5 million
and R5.1 million over the two outer years. See SA21 for a listing of these
transfers and grants.
3614. Section 14: Councillor allowances and employee benefits
This is contained in supporting schedule table SA22 and SA23. A summary
of the employee related cost, excluding councillors’ salaries and allowances
has been provided in the table below.
Table 23: Employee cost percentages
% of total
operating
Total % of total expenditure
operating operating (excluding bulk
Year Salary cost expenditure expenditure purchases)
2015/16 - Actual 261,689,492 833,685,970 31% 46%
2016/17 - Actual 279,267,719 887,066,566 31% 45%
2017/18 - Actual 316,024,070 956,442,797 33% 45%
2018/19 - Actual 340,385,622 1,048,054,018 32% 44%
2019/20 - Actual 380,115,072 1,087,726,497 35% 48%
2020/21 - Adjustment budget 422,799,167 1,224,283,657 35% 47%
2021/22 - Budget 436,519,823 1,277,130,923 34% 46%
2022/23 - Budget 451,827,630 1,366,985,167 33% 45%
2023/24 - Budget 471,511,677 1,465,324,116 32% 44%
15. Section 15: Monthly targets for revenue expenditure and
cash flows
This is contained in supporting schedule table SA25 and SA30
16. Section 16: Annual budgets and SDBIP
The final service delivery and budget implementation plans (SDBIP) will be
dealt with after the budget is finally approved to be submitted to the Mayor
within 14 days after the approval of the budget and approved by the Mayor
within 28 days after the approval of the budget. The draft Top Layer SDBIP
is included as Annexure M.
37You can also read