Anticipating Stock Market of the Renowned Companies: A Knowledge Graph Approach
←
→
Page content transcription
If your browser does not render page correctly, please read the page content below

Hindawi
Complexity
Volume 2019, Article ID 9202457, 15 pages
https://doi.org/10.1155/2019/9202457

Research Article
Anticipating Stock Market of the Renowned Companies:
A Knowledge Graph Approach

 Yang Liu ,1 Qingguo Zeng ,2 Joaqu-n Ordieres Meré ,1 and Huanrui Yang3
 1
 Department of Industrial Engineering, Business Administration and Statistics, Escuela Técnica Superior de Ingenieros Industriales,
 Universidad Politécnica de Madrid, Madrid 28006, Spain
 2
 School of Mathematical Sciences, South China Normal University, Guangzhou 510631, China
 3
 Electrical and Computer Engineering Department, Duke University, Durham 27708, USA

 Correspondence should be addressed to Yang Liu; yang.liu00@alumnos.upm.es

 Guest Editor: Benjamin M. Tabak

 Copyright © 2019 Yang Liu et al. This is an open access article distributed under the Creative Commons Attribution License, which
 permits unrestricted use, distribution, and reproduction in any medium, provided the original work is properly cited.

 An increasing number of the renowned company’s investors are turning attention to stock prediction in the search for new efficient
 ways of hypothesizing about markets through the application of behavioral finance. Accordingly, research on stock prediction is
 becoming a popular direction in academia and industry. In this study, the goal is to establish a model for predicting stock price
 movement through knowledge graph from the financial news of the renowned companies. In contrast to traditional methods of
 stock prediction, our approach considers the effects of event tuple characteristics on stocks on the basis of knowledge graph and
 deep learning. The proposed model and other feature selection models were used to perform feature extraction on the websites
 of Thomson Reuters and Cable News Network. Numerous experiments were conducted to derive evidence of the effectiveness of
 knowledge graph embedding for classification tasks in stock prediction. A comparison of the average accuracy with which the
 same feature combinations were extracted over six stocks indicated that the proposed method achieves better performance than
 that exhibited by an approach that uses only stock data, a bag-of-words method, and convolutional neural network. Our work
 highlights the usefulness of knowledge graph in implementing business activities and helping practitioners and managers make
 business decisions.

1. Introduction analyzing stock market movements is both challenging and
 attractive to researchers and investors. Moreover, as the
Research on stock market of company prediction has become development of knowledge graph in natural language pro-
popular with the introduction of Fama’s efficient market cessing (NLP), researchers in the financial field began paying
hypothesis (EMH) [1], but in recent years, an increasing num- attention to text mining in financial news. As maintained by
ber of people have found that stock market of the renowned EMH and artificial intelligence technique, the best results are
company changes is random, complex, and unstable given achieved when news information is used to forecast stock
that they are affected by many factors. Stock market of market movement, which can also control financial risk in
company changes is affected by cultural aspects that fun- business activities.
damentally influence investor sentiment; traditional culture In May 2012, Google formally announced its knowledge
often determines people’s investment psychology, which in graph project, which is aimed at improving the search engines
turn, affects the inflow and outflow of stock market capital. effectiveness and search quality as well as user experience
Company-related issues, such as the effects of company with the engine [3]. The development of knowledge graph
operations on stock prices and market factors [2]. Using promoted the extensive use of artificial intelligence technol-
these factors as bases for accurately predicting stock price ogy in smart search, smart question-and-answer tasks, and
movement gives investors hope that the maximum profits will intelligent finance. In finance, knowledge graph is designed to
be achieved with the least stock investment. Correspondingly, find relationships amongst entities, such as the management
2 Complexity

of companies, news events, and user preferences. These For stock market prediction, we formulated a knowledge
entities can be used by investors to achieve efficient financial graph embedding-driven approach that involves four main
data-based decision-making and obtain business insights into phases (Figure 1). The first is data retrieval, which begins with
predicting stock market [4]. For these reasons, the current searching keywords such as “Apple” or “Google” over the
research focused on how to use knowledge graph to improve Thomson Reuters or Cable News Network (CNN), as shown
the accuracy of stock price forecasts. Knowledge graph is in Figure 2. The yellow part is the headline of financial news
databases that implement semantic searches by preserving and the orange part is the release time of the financial news.
relationships amongst multiple entities. Based on event tuples A web crawler is then used to obtain financial news from the
in knowledge graph [5], we can infer the definition of an sites and match them with corresponding stock data, com-
event tuple as (A, P, O), where A represents an agent, P bining all this information into one corpus. The second phase
denotes a predicate, and O represents an object [6]. In view involves preprocessing, which encompasses corpus analysis,
of the objects converted by each event tuple are known, when text normalization, word tokenization, label tagging, and
they are converted to vectors, which loses more semantic word-to-vector transformation. The features derived from
information. Event tuples link relevant elements together and word embeddings and stock data layers are then selected for
can be used as an efficient method of improving predictive the computation of eigenvalues, after which a feature vector
accuracy. As a result, we propose a learning model of event is generated using machine learning and knowledge graph
tuples, which retains their semantic features at the maximum. embedding. The third phase is model creation, in which stock
 Knowledge graph embedding is a kind of representation market prediction labels (increase or decrease) are assigned to
learning in knowledge graph. Currently, several algorithms financial news to training a classification model. Finally, the
[3] explore the mapping relationship between entities and finance decision relies on the predictive performance of this
relationships in the translation distance model. The TransE framework. Specifically, a small improvement directly affects
model [7] is a computationally efficient predictive model that decision-making, which increases the renowned company’s
satisfactorily represents a one-to-one type of relationship. It profits. The fourth phase involves model evaluation, wherein
has been used as a basis in the development of different the results and the extraction of conclusions of each machine
translation distance models. The TransH model [8] maps learning model are analyzed.
the head and tail of a vector onto a hyperplane, after which The remaining part of the paper is organized as fol-
these two components complete the translation process on lows. Section 2 is a review of existing studies on the use
the hyperplane. The TransR model [9], which is based on the of machine learning in stock market prediction. Section 3
TransE model, consists of entities and relationships that are introduces the methodology adopted in this study, including
located in different dimensions of space. For each relation- the data description and feature selection approach. Section 4
ship, the model defines a matrix that is used to convert entity presents the classification results, and Section 5 discusses
vectors into space. The model is also dynamically determined the results and implications. Section 6 concludes with the
by an entity relationship. The TransD model [10] is an summary.
improvement of the TransR model, which the former uses as
a basis in considering a transformation matrix. In comparing 2. Literature Review
these models, solving the head and tail of a news tuple for
mapping in a single space necessitates the simple mapping In Table 1, the application of machine learning techniques
of one-to-one entity extraction features. This functionality is to stock market prediction is an emerging research field.
found in the TransE model; this study is used to establish a The advantage of machine learning models is their ability to
feature combination model for news event metagroups. facilitate the processing of large amounts of data. A procedure
 This work selects six globally renowned companies common to these models is the concatenation of features
to forecast their stock price movement, namely, Apple, from different sources into a feature vector. For most machine
Microsoft, Samsung, Boeing, Google, and Walmart as appli- learning models used, research is focused on predicting stock
cation scenarios. According to different data sources between trends (increase or decrease).
Thomson Reuters and Cable News Network, we reveal the Various feature extractions have already been proposed
result of the case studies in some algorithms, which illustrates to predict the stock price of the renowned companies. In the
that the performance of combined feature outperforms that early years, most of the company’s stock prediction depends
using only stock data, using a bag-of-words algorithm, on the empirical analysis of the econometric model, namely,
and using convolutional neural network. Although there the feature extracted is the raw data of the company’s stock.
are already some examples of the powerful application of However, the previous work ignored the potential impact
deep learning in NLP [11], such as speech recognition, text of unstructured data on company stocks. Since the bag-of-
classification, and machine translation, most of the previous words is widely utilized in the task of document classification,
research in predicting stock price movement [12] is based on the frequency of word appearance can be used as a feature of
the semantic information news, which ignores the semantic the classification. Hence, the bags of words model only cal-
features of structured events. The application of deep learning culate the frequency of words and do not consider the word
and knowledge graph on the renowned companies’ stocks is order or word sparsity in the context, which directly impacts
rarely available. Thus, our work provides a viable application the prediction result. Furthermore, EMH had found that
framework for financial markets, which can also be extended the emotional impulses of the renowned company investors
to other aspects of the financial filed. often observe abnormal fluctuations in company stocks.
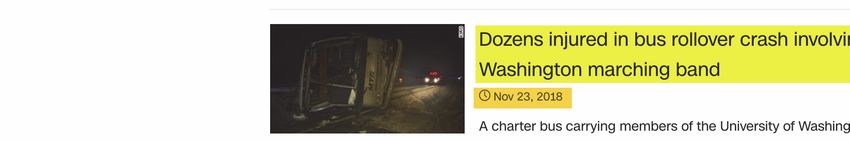
Complexity 3

 DATA PRE- MODEL CREATION MODEL
 RETRIEVAL PROCESSING & PREDICTION APPLICATION

 Feature Machine learning
 selection model creation

 Feature News-stock
 Financial news Corpus representation mapping Model Decision
 evaluation making

 Stock data Data
 transformation

 Figure 1: Research workflow for machine learning and knowledge graph.

 Figure 2: Example of collected financial news in CNN.

4 Complexity

Table 1: A review of financial expert system. ANN, NB, KNN, SVM, DT and SVR stand for artificial neural network, naive Bayes, k nearest
neighbors, support vector machine, decision tree, and support vector regression, respectively. Measure metrics: mean squared error (MSE);
root mean square error (RMSE); area under the curve (AUC).

Paper Text type Model type Performance
 Feature extraction
 measure
[13] Professional newspaper Stock data NB Accuracy
[14] Professional newspaper Stock data SVM Accuracy
[15] Message board Regression Correlation
 Stock data
 coefficient
[16] PRNewswire Stock data KNN, SVM Accuracy, F1-score
[17] Aggregate news Stock data, SVR MSE, accuracy
 bag-of-words
[18] Corporate disclosures Stock data, Multiple Accuracy, recall,
 bag-of-words precision, F1-score
[19] Financial news Stock data, DT Accuracy, recall,
 sentiment precision, F1-score
[20] Web media Stock data, SVR Accuracy, recall,
 bag-of-words. precision, F1-score
 Stock data,
[21] Mixed type SVR RMSE, accuracy,
 bag-of-words
 precision
 sentiment,
[22] Message board Stock data, SVM Accuracy
 sentiment
 Stock data, Accuracy, AUC,
[23] Mixed type technical indicators, ANN, SVM, DT F1-score, precision
 sentiment
[24] None Regression Correlation
 Stock data
 coefficient
[25] Media news Regression Correlation
 Stock data
 coefficient
 Stock data,
Our financial expert system Financial news technical indicators, Multiple Accuracy, F1-score
 bag-of-words,
 syntax

Tetlock [26] adopted the popular news from the Wall Street We utilize the characteristics of syntax analysis as being
Journal to find that news sentiment has predictive power on proposed in [6, 12]; namely, a structured tuple is extracted
company stocks. Chen et al. [27] found information comen- from an unstructured text based on the semantic structure
tions have a significant influence on the stock return through of each piece of news. Knowledge graph can enrich the
sentiment analysis. Furthermore, the investors’ sentiment structured representation of the news event and effectively
trends after the positive news, which results in a buying trend, retain feature vectors for the news event. The main feature
and higher stock market prices while after negative news extraction in the previous studies [28, 29] is sentiment
stocks are sold result in a decrease of the price. However, analysis, which neglected the event characteristics in the
sentiment analysis can only be employed in specific texts. text. Furthermore, the existing literature [23, 29] had proved
If sentiment is implicit rather than direct emotional words, the positive effect of technical indicators on stock market
then the ability of using sentiment analysis for predicting the prediction. In summary, our research highlights syntax anal-
stock price of the renowned company is relatively limited. ysis in financial news, which also incorporates with other
Mittermayer and Knolmayer [16] illustrated that news-CATS features extraction (stock data, technical indicators, and bag-
achieves a performance that is superior to that of other of-words). Because of the variety of considered features, this
ATC prototypes used to forecast stock price trends. Li et al. research will deliver an improved prediction of the stock
[21] proposed a media-aware quantitative trading strategy by market value for renowned companies in at least 3.6%.
using sentiment information on web media. The simulation Previous research [30] was applied with the traditional
trading return was up to 166.11%. Nguyen et al. [22] proposed machine learning algorithms, especially, since the power-
a feature topic sentiment to improve the performance of stock ful application ability of deep learning based on machine
market prediction. Their method achieved an accuracy that learning. Deep learning is utilized in several studies for
is 9.83% better than that of the historical price method and predicting stock price movement. Kraus and Feuerriegel [31]
3.03% better than that of the human sentiment method. forecasted the stock returns based on financial disclosures,

Complexity 5

 Table 2: Quotes and renowned company names.

Financial news Stocks Company names Time interval Number of news
dataset headlines
 AAAL Apple Inc. 3.10.2011- - -31.7.2017 6423
Thomson Reuters MSFT Microsoft Corporation 30.9.2011- - -29.11.2017 6623
 SSNLF Samsung Electronics Co., Ltd. 30.9.2011- - -29.11.2017 6900
 BA The Boeing Company 8.9.1998- - -23.2.2017 2999
CNN GOOG Google Inc. 25.5.2006- - -24.2.2017 5278
 WMT Walmart Inc. 7.5.1997- - -24.2.2017 4913

 Table 3: Samples extracted from the dataset.

Date News headline News headline event tuple
3/18/2012 Chinese writers’ group sues Apple: state media Chinese writers’ group, sues, Apple
4/13/2012 German court, upholds ban on, Apple push
 German court upholds ban on Apple push email
 email
4/4/2012 Apple, two publishers hold out against Apple- two publishers, hold out against,
 settlement-report settlement-report
3/26/2012 Apple CEO Cook meets Chinese officials Apple CEO Cook, meets, Chinese officials
4/25/2012 US STOCKS-Apple results put Nasdaq on track for best
 Apple, results, Nasdaq on track for best gain
 gain of year

and their result demonstrated that a higher directional of and trading data from a time series. As shown in previous
deep learning surpasses traditional machine learning. Ding work [5, 31], using a headline to build corpora can help
et al. [5] illustrated that deep learning also can forecast reduce noise in text mining as headlines concisely represent
stock market of the renowned company. Sim et al. [32] the content of a text. We used only the news headlines from
proposed that technical indicators transform into images of Reuters and CNN for the prediction of stock price movement.
the time series graph, which examines the applicability of Daily stock data from index report in each company are
deep learning in the stock market. Overall, we adopt the collected by Yahoo Finance in the same period during stock
multiple models for prediction stock price of the renowned data and financial news headlines. Daily trading data, which
company, which proves the reliability of our proposed model are common predictors of stock price [23, 33], and technical
as comparing different algorithms. This work applies deep indicator features were used in our model. There are opening
learning incorporated with knowledge graph embedding price, closing price, high price, low price, and volume and
for feature extraction, which examines the applicability of three technical indicators.
combined features methods in the renowned company stock Table 3 shows some examples of filtered financial news
price movement. headlines. To illustrate, 6423 headlines regarding Apple Inc.
 were extracted and then reduced to 2799 headlines after
3. Materials and Methods filtering via Reverb [34]. Let us take the article “What is next
 for Apple’s board?”, published on 6 October 2011, as a specific
We developed a knowledge graph-based approach that con- example. The title of the article cannot be transformed into
sists of three steps, namely, data description, data preprocess- an event tuple using Reverb. Because the sentence is in the
ing, and feature selection. interrogative form, there is no event tuple that constitutes a
 rule. After the matching of time-wise data and stock data,
3.1. Dataset Description. Table 2 shows the custom financial 941 headlines were left. Daily news and stock data were
news corpus built with headlines from two datasets. The first aligned to create input-output pairs, except the days when
dataset contains news articles published by Thomson Reuters, no news was released. In 9 January 2012, for instance, three
including those regarding Apple Inc. (AAPL), Microsoft news articles were reported, but we chose only one headline
Corporation (MSFT), and Samsung Electronics Co., Ltd. for alignment with stock market data. News events possibly
(SSNLF). The second dataset comprises news reports pub- happen several times within one day, but they do not happen
lished in CNN, including reports on the Boeing Company every day, unlike stock trading, which happens daily, except
(BA), Google Inc. (GOOG), and Walmart Inc. (WMT). It on nontrading days falling on weekends or holidays.
also consists of financial news headlines published at specific Table 4 shows that the matches found are pairs between
time intervals, with each news report accompanied by a title event tuples and stock data. From this complete dataset, we
and a release date. Titles are used for event embedding and used 80% of the samples in training data and the remaining
feature extraction, and release dates are used as a reference 20% for testing data. This selection method is the same as the
in ensuring alignment between corresponding financial news previous literature [5, 24].

6 Complexity

 Table 4: Training and testing datasets.

Data source Company Training Testing Total
 Apple 780 161 941
Reuters Microsoft 832 208 1040
 Samsung 855 214 1069
 Boeing 528 132 660
CNN Google 1010 252 1262
 Walmart 798 200 998

 Table 5: Number of event characteristic labels for each company.

 Companies
Label Apple Microsoft Samsung Boeing Google Walmart
0 502 967 1433 133 661 206
1 537 432 379 200 245 287
2 661 557 378 152 389 233
3 692 707 724 233 683 438
4 407 228 193 147 196 180
Total 2799 2891 3107 865 2174 1344

 Table 6: Features of the prediction model.

 Feature Feature expression
1 Stock price yesterday + yesterday’s trend (in Section 3.3.1) −1 , −1
2 Same + bag-of-words (in Section 3.3.2) −1 , −1 , −1
3 Same + some features inferred through a convolutional neural network (in Section 3.3.3) −1 , −1 , −1
4 Same + some features inferred through feature combination (in Section 3.3.4) −1 , −1 , −1

3.2. Data Preprocessing. The following three steps are for price trend rises, the closing price tends to approach the
preprocessing, which prepares for feature extraction and highest price of the day. When the price trend declines, the
model creation. closing price tends to approach the lowest price of the day
 (1) Tagging the label for each news headline. Five possible [36].
labels are characterized by categorical values as follows: 0 (b) Larry Williamss %R indicator. This indicator is an
for an extremely negative label, 1 for a negative label, 2 to oscillation indicator that measures the ratio of the highest
signify a neutral label, 3 for a positive label, and 4 to denote an price to the daily closing price. It indicates the proportion of
extremely positive label. According to the time characteristics stock price fluctuations in a certain period, thereby providing
of each news headline, an event is manually tagged with a signal out of the reversal of a stock market trend [37].
the label for each news headline. Table 5 shows the labeling (c) Relative strength index (RSI). Buying and selling
applied for each company: Label 0 means that a company’s intentions in the market are analyzed by comparing the
competitor has happened in this event; label 1 means that the closing prices in a given period. Stocks that have had more
company lost something; label 2 means that it did not cause or stronger positive changes have a higher RSI than do those
any impact on the company; label 3 means that this event that have had more or stronger negative changes. Strength
enabled the company to obtain something; and label 4 means indicators fall between 0 and 100; investors sell if this value
that the company increased its profits or created more value. is ≥ 80 and buy if it is ≤ 20 [23, 36].
 (2) Word vector transformation. We used the word2vec
[35] algorithm to train word embedding and set the number 3.3. Variable/ Feature Selection. To assess the effectiveness
of dimensions to 300. The word embedding was also trained of applying the prediction model on the basis of financial
using the Google News dataset, which contains 100 billion news, we designed four sets of features for predicting stock
words that are characterized by a continuous bag-of-words price movement (Table 6). Features 3 and 4 are used for event
structure. characteristics. Each feature is explained in the succeeding
 (3) Technical indicators calculation. Three additional subsections. The target output consists of a binary variable,
technical indicators that are calculated on the basis of daily for which a value of 1 indicates that the closing price at day t
trading data were used as follows: + 1 will be higher than that at day t, and a value of 0 indicates
 (a) Stochastic oscillator (%K). This indicator is a momen- that the closing price at day t + 1 will be lower than that at day
tum analysis method created by George C. Lane. When the t.

Complexity 7

 X (I)

 .. ..
 . ···
 .. .
 .. .
 .

 Z (I)

 Financial news News representation Convolutional layer Max pooling Fully connected layer Features

 Figure 3: Convolutional neural network architecture proposed for feature selection.

3.3.1. Stock Data Only. We considered historical price as the resultant input matrix has dimensions of 30 × , and the
input for predicting stock price movement and used it as dimension of news representation also is 30.
a baseline for comparison with other sets of features. The In Figure 3, this convolutional neural network model is
features used to train the machine learning model that uses made up of four consecutive layers: the first layer is the
only stock data are −1 and −1 . The output is input, the second layer is convolutional, the third layer is a
the indicator of price movement (increase or decrease) at each max-pooling, and the last layer is a fully connected layer.
transaction date examined. The convolutional and max-pooling layers were designed
 using the text-attentional convolutional neural network [43],
3.3.2. Bag of Words. The input feature set is based on a bag of which effectively carries out sentiment classification. In the
words for the news and price trend for stock. Previous studies convolutional layer, input matrix X convolves with a kernel
[18, 38, 39] have widely used and confirmed the feasibility ∈ R × , where n is the size of a word vector (30 in
of the bag-of-words algorithm, but this method disregards our work), and its dimension is 50. k denotes the size of a
elements such as grammar and word order in the text. In sliding window (k=3 in this study). The computation can be
the present study, we first prepared each headline for data formulated as follows:
preprocessing and then transformed the preprocessed head-
line into a feature vector using the term frequency-inverse = ( : + −1 + ) , (1)
document frequency (TF-IDF) algorithm [40], which assigns
high weight to eigenvectors. The studies [41, 42] have strongly where : + −1 = [ , +1 , . . . , + −1 ] is the portion of input
proven the effectiveness of the TF-IDF algorithm in feature falling within the sliding window, denotes the optional
extraction from news headlines. It estimates the frequency of offset, and (⋅) is the sigmoid function.
a term in one document over the maximum in a collection of In the next step, we used the pooling layer to reduce the
documents and assesses the importance of a word in one set of convolutional neural networks parameter space and conse-
documents. Such importance increases proportionally with quently minimize information loss in the pooling processing
the number of word appearances in a document. The features and capture the most important features. The eigenvector
used to train the bag-of-words machine learning model are of the filter in the pooling layer is cut into 3 chunks and
 −1 , −1 , and −1 , which are the price a maximum value is taken in each chunk; we obtained 3
movements (increase or decrease) at each transaction date eigenvalues. Convolutional output vector Z was split into p
examined. windows, and only the maximum feature as 3 in each window
 was kept for passage onto the final fully connected layer. The
3.3.3. Convolutional Neural Network. Given the sequence of fully connected layer is linear regression, and the output layer
words in a headline, the word2vec model [35] can be used is the feature classification between 0 and 1.
to embed each of these words in a real valued-vector . In Our convolutional neural network model is intended to
this work, we set the dimension of each word vector at extract a feature vector from the fully connected layer to
30 (i.e., ∈ R30 ). We concatenated the word vectors of all describe the emotional characteristics of input headlines.
the words in a headline sequentially to form a matrix = Following the intuition that a good feature vector should
[ (1) , (2) , (3) , . . . , (4) ] [35] as the input to a convolutional lead to the accurate classification of the event characteristics
neural network model. For a headline with words, the of headlines, we attached a softmax layer after the fully

8 Complexity

 The United Kingdom of Great London is the ca
 capital city of
 Britain and Northern Ireland, England and of the United
 commonly known as the United Kingdom. It is the
 t most
 Kingdom or Britain, … populous region
 region, …

 London, / location/ country / capital, United Kingdom
 Head Relationship Tail

 Figure 4: Text description of the entity.

connected layer when the convolutional neural network represent a word, an entity, and a relation, respectively. And
model was trained. The entire model was trained to classify r are the mapping matrices for entities in the structural
the five emotional labels that describe event characteristics, model and represents the weights of the convolutional neural
and the resultant model will be able to provide a mean- network. For instance, the sentence is “Samsung sues Apple for
ingful emotional feature vector for each inputted headline. infringement”, so “Samsung + Apple ≈ sues”. The loss function
Meanwhile, we define the loss function of the convolutional of this structural model is defined as follows:
neural network model as . The features used to train
this machine learning model are −1 , −1 , = ‖ℎ + − ‖22 , (2)
and −1 , which are the price movements (increase or
decrease) at corresponding transaction date. where h, r, and t represent head entity, relationship, and tail
 entity in event tuple, respectively [47].
 And text representation is consistent with
3.3.4. Combined Features. In the introduction section of this Section 3.3.3, which denotes:
paper, we described various translation models. Because the
TransE model represents a one-to-one relationship between = (ℎ , ) + (ℎ , ) + (ℎ , ) , (3)
two entities [7], the relationship amongst many entities must
be continuously incorporated into texts and knowledge graph where (ℎ , ) = ‖ℎ + − ‖22 represents the head entity and
[44]. This model combines a convolutional neural network the tail entity is in text representation. (ℎ , ) = ‖ℎ + − ‖22
with textual information extraction, which fully exploits the and (ℎ , ) = ‖ℎ + − ‖22 represent one of the head entity
semantic information in a knowledge graph and text [45, 46]. h and the tail entity t in text representation, another one is in
In Figure 4, knowledge graph contains rich semantics in structure representation.
entity description texts, but it is not fully utilized in feature Moreover, we combined two types of representation
extraction. Most of the existing text representation models learning (convolutional neural network and feature combi-
simply train the text into word vectors through word2vec, nation) to map news titles; these vectors will be into feature
which obtains the text representation by means of averaging, vectors. The relationship vector R identical to the result
etc. Hence, these ways often lose more semantic information. of the feature extraction layer of the convolutional neural
We therefore proposed to extract feature vectors from news network in the structural model. Besides, we combined this
texts using a convolutional neural network model combined loss with the classification loss of the convolutional neural
with the TransE model, which also fully integrates the two network using L2 regularization, which obtains the overall
parts of the feature information. loss function for feature selection, that is,
 In Figure 5, this architecture used in the feature combina-
tion model encompasses two parts, namely, a convolutional = + + ‖0‖2 , (4)
neural network (Section 3.3.3) and the TransE model. The
feature combination sets are the average of each word vector where ‖0‖2 is a regular item. and are hyperparameters,
in an entity and it was obtained using the word2vec model. which measure the loss of text information and the weight of
The two entity vectors are mapped into the same relational the regular items, respectively. W denotes the convolutional
space, and these entities using a trained low-rank weight kernels in the layer and is a negative sample set of [7].
matrix [47].
 As assumed in the TransE model, relationship vector R = {(ℎ , , ) | ℎ ∈ } ∪ {(ℎ, , ) | ∈ }
should satisfy “E + R ≈ T”. The model can be represented (5)
as a parameter set 0 = ( , , ), where X, E, and R ∪ {(ℎ, , ) | ∈ } ,
Complexity 9

 Output layer
 Class1 Class2

 Machine
 learning

 Feature vector Stock data

 Stock layer

 Fully connection TransE model

 Max pooling

 Word2vec

 convolutional

 Event tuple

 Word2vec

 Input news Input news

 Embedding layer

 Figure 5: Proposed architecture for the feature combination model.

where the head entity and tail entity are randomly replaced by 4. Experiments and Results
an entity or relationship in another tuple. In particular, if the
replaced tuple is already in T, it would not be added to the 4.1. Experimental Setting. This section compares the perfor-
negative sample. Since both h and t represent two types of mance of different models in feature extraction from financial
entities, there are structure-based representations and text- news expended with full sets of features. The evaluation
based representations in interval-based loss functions. The was intended to obtain evidence that the proposed feature
stochastic gradient descent (SGD) is employed to minimize combination model is superior to other feature selection
the above loss function. models in predicting the stock price movement. As shown
 In this structure, we choose the optimal parameters as in Table 7, we chose linear models, for instance, logistical
followe: the learning rate of SGD = 0.001, the dimension of regression and naive Bayes. Others are nonlinear models, for
the representation vector of entities and relationships k = 100, instance, the ensemble learning (random forest, adaboost,
the word vector dimension of the entity description text n = and gradient boosting) for the comparison. We constantly
100, and batch size during training is 1440. Convolution layer adjusted the parameters in the grid search and selected the
window size is ∈ {1, 2, 3}. This experiment is performed optimal parameter value; their parameter value has proven to
in 1000 iterations of training and the optimal parameters are work well on machine learning method [29, 48].
based on the testing set. We used a computer consisting of an Intel Core i5
 Hence, the features used for training the machine learn- processor with four cores running at 2.9 GHz and 8 GB
ing model are −1 , −1 , and −1 , RAM under the MacOS platform. We used the Scikit-learn
which are the price movement (increase or decrease) at library in Python in the experiments involving traditional
corresponding transaction date. machine learning algorithms and TensorFlow 1.4 in the
10 Complexity

 Table 7: List of machine learning methods.

Method Classification Parameter and their value
 Criterion= gini, splitter= best, max depth=None, min
 Decision tree (DT) samples split=2, min samples leaf =1, min weight
Traditional fraction leaf=0.0,
machine Logistical regression (LR) Random state=1
learning Naive Bayes (NB) No kernel estimator
 Stochastic gradient descent (SGD) Loss=hinge, penalty=l2
 Support vector machine (SVM) Polynomial kernel function with exponent = {1, 2}, RBF
 kernel function with gamma = 0.01
 Random forest (RF) Randomly sampled as candidates at each split = log2 +
Ensemble 1, max-depth=2, random state=0
learning Polynomial kernel function with exponent = {1, 2}, RBF
 AdaBoost (AB)
 kernel function with gamma = 0.01, n- estimators=100
 Gradient boosting (GB) N-estimators =100, learning rate =1.0, max-depth=1,
 random state=0

 Table 8: Abbreviations of the results for each algorithm considered.

 Feature
Algorithms Convolutional
 Stock data (SD) Bag of words (BOW) combination
 neural network
 model (FC)
DT DT 1 DT 2 DT 3 DT 4
LR LR 1 LR 2 LR 3 LR 4
NB NB 1 NB 2 NB 3 NB 4
SGD SGD 1 SGD 2 SGD 3 SGD 4
SVM SVM 1 SVM 2 SVM 3 SVM 4
RF RF 1 RF 2 RF 3 RF 4
AB AB 1 AB 2 AB 3 AB 4
GB GB 1 GB 2 GB 3 GB 4

experiments involving deep learning and the TransE model. Measurements of average accuracy are shown in Table 9,
The abbreviations used for comparing classification perfor- and the results for each renowned company with respect
mance are presented in Table 8. During testing, 2-fold cross- to prediction based on different features are illustrated in
validation is applied to evaluate the stability of the models. Figure 6. We calculated the average of the four feature con-
And we compared performance in predicting stock price struction approaches for each model for comparison amongst
movement for the next day with a test dataset and evaluated the three companies. The proposed feature combination
the performance of the models in terms of accuracy and F1- model generated the best results, achieving average accuracy
score [49]. levels of 61.63%, 59.18%, and 58.48% for Apple, Microsoft, and
 Samsung, respectively. These figures are consistent with the
4.2. Results rates reported in previous research. However, many studies
 analyzed only one company or used only one algorithm.
4.2.1. Thomson Reuters Case Study. Thomson Reuters is The current research probed into three companies on the
a multinational mass media and information firm. Three basis of information from a common data source to build
renowned companies on the website were selected for the a prediction model with different feature selection func-
analysis. The first is Apple Inc., which is an American multi- tionalities and different algorithms. We used stock data,
national technology company that designs, develops, and a bag-of-words algorithm, a convolutional neural network,
sells consumer electronics, computer software, and online and feature combination, together with eight algorithms. As
services. The second company selected is Microsoft, which is indicated in Table 9, the proposed prediction model achieved
an American multinational technology company that devel- 73.68% data extraction with the use of LR 4 for Apple and
ops, manufactures, supports, and sells computer software, 67.78% data extraction with the use of SVM 4 for Microsoft.
personal computers, and other services. The last company In particular, the LR algorithm used for Apple achieved
chosen is Samsung, which is a South Korean multinational accuracy and F1-score of 0.7326 and 0.7360, respectively,
electronics company. We considered data from these three which highlights its powerful capability in a two-class classifi-
typical technology companies for our problem. cation.
Complexity 11 Table 9: Results for data extracted from Thomson Reuters. Algorithm Company Stock data Bag of words Convolutional Feature combine (SD) (BOW) neural network model (FC) Accuracy/F1- Accuracy/F1- Accuracy/F1- Accuracy/F1- score score score score Apple 0.4993/0.5079 0.4889/0.2460 0.6150/0.5814 0.6524/0.6486 DT Microsoft 0.4868/0.1819 0.5065/0.5682 0.5817/0.5915 0.6587/0.6502 Samsung 0.4707/0.4033 0.5654/0.5830 0.5529/0.6820 0.5680/0.6260 Apple 0.5240/0.6727 0.5055/0.5083 0.6845/0.6911 0.7326/0.7368 LR Microsoft 0.4757/0.1253 0.4430/0.4884 0.5274/0.5333 0.5467/0.5611 Samsung 0.4947/0.3755 0.6054/0.6726 0.6541/0.6343 0.8053/0.7978 Apple 0.5109/0.5123 0.4778/0.3896 0.5027/0.4497 0.5122/0.4030 NB Microsoft 0.4840/0.0363 0.4557/0.4055 0.4599/0.2889 0.5000/0.5439 Samsung 0.5293/0.5810 0.5144/0.6130 0.5048/0.6578 0.5117/0.6601 Apple 0.4672/0.1119 0.4778/0.4404 0.4974/0.6008 0.5366/0.2692 SGD Microsoft 0.5173/0.6819 0.4852/0.3222 0.6103/0.4231 0.6108/0.4193 Samsung 0.5223/0.6541 0.4766/0.2000 0.5187/0.6751 0.5571/0.6548 Apple 0.5022/0.6121 0.5747/0.5542 0.6150/0.6129 0.6220/0.6173 SVM Microsoft 0.4784/0.1722 0.4439/0.4566 0.5232/0.5462 0.6875/0.6798 Samsung 0.5008/0.3875 0.5047/0.5508 0.5135/0.6281 0.5352/0.6574 Apple 0.5240/0.6554 0.5278/0.6083 0.5337/0.6232 0.6203/0.6243 RF Microsoft 0.4840/0.2653 0.4177/0.1687 0.5325/0.2432 0.5721/0.5189 Samsung 0.4872/0.3480 0.4485/0.1194 0.4766/0.3708 0.5052/0.5481 Apple 0.5343/0.5384 0.4722/0.2963 0.4819/0.3333 0.6203/0.5420 AB Microsoft 0.4687/0.2041 0.4768/0.0461 0.6147/0.6044 0.6202/0.6146 Samsung 0.4857/0.3619 0.4579/0.2368 0.6010/0.6820 0.6338/0.6549 Apple 0.5314/0.5129 0.4667/0,2941 0.6096/0.4748 0.6341/0.6591 GB Microsoft 0.4743/0.2125 0.4728/0.1007 0.4557/0.4557 0.5385/0.2258 Samsung 0.4872/0.4171 0.5192/0.6599 0.5337/0.6572 0.5622/0.6335 Reuters the stock data approach and the bag-of-words algorithm. The 0.7 results showed that the average accuracy of the event tuple- 0.6 based model is better than that of the stock data approach and the bag-of-words algorithm by 10.01% and 10.87%, respec- 0.5 tively. We also compared feature extraction using the stock Average accuracy 0.4 data approach, the bag-of-words algorithm, and machine learning. The use of deep learning improved prediction 0.3 accuracy by 5.25% and 6.11% over the levels achieved with 0.2 stock data and bag of words, respectively. Therefore, we can conclude that using the proposed feature combination model 0.1 and deep learning in feature extraction helps improve the accuracy with which stock price movement is predicted. 0 Apple Microsoft Samsung These results also fully prove the effectiveness of embedding Different company layer in feature extraction accuracy improvement. SD CNN BOW FC 4.2.2. CNN Case Study. CNN is an American basic cable and satellite television news channel owned by the Turner Figure 6: Average accuracy of prediction based on different feature Broadcasting System. Three renowned companies on which sets for each company in Reuters. these website reports were selected for the analysis. The first is Boeing, which is an American multinational corporation that designs, manufactures, and sells airplanes, rotorcraft, To assess the effectiveness of our research, we compared rockets, and satellites worldwide. The second company is the feature combination model that uses event tuples with Google, which is an American multinational technology
12 Complexity

 Table 10: Results for data extracted from CNN.
 Feature
 Stock data Bag of words Convolutional
Algorithm Company combination
 (SD) (BOW) neural network
 model (FC)
 Accuracy/F1- Accuracy/F1- Accuracy/F1- Accuracy/F1-
 score score score score
 Boeing 0.4950/0.3489 0.5413/0.6258 0.5414/0.6347 0.5591/0.5821
DT Google 0.4858/0.5600 0.5182/0.3575 0.5692/0.4631 0.5491/0.5471
 Walmart 0.4996/0.4422 0.5300/0.4891 0.5088/0.4815 0.5722/0.5829
 Boeing 0.4923/0.2378 0.5113/0.4348 0.6923/0.6923 0.7596/0.5733
LR Google 0.5041/0.6105 0.6235/0.6491 0.6250/0.6111 0.6563/0.6516
 Walmart 0.5290/0.5468 0.5412/0.5083 0.7320/0.7347 0.7719/0.7720
 Boeing 0.5162/0.6503 0.5489/0.5161 0.5197/0.6738 0.5564/0.7619
NB Google 0.5112/0.6527 0.4899/0.5191 0.5587/0.5281 0.5344/0.4843
 Walmart 0.5044/0.3284 0.4794/0.5302 0.5206/0.5674 0.5300/0.6083
 Boeing 0.4897/0.2407 0.5564/0.4870 0.5433/0.4727 0.5714/0.7220
SGD Google 0.5165/0.6769 0.5425/0.4375 0.5789/0.6364 0.5910/0.6327
 Walmart 0.5004/0.3804 0.5206/0.5280 0.5250/0.5581 0.5670/0.5922
 Boeing 0.4897/0.3068 0.5714/0.6275 0.5385/0.6418 0.5940/0.7033
SVM Google 0.5077/0.6297 0.6032/0.6230 0.5749/0.5532 0.5789/0.5840
 Walmart 0.5118/0.4333 0.5000/0.5314 0.5200/0.5000 0.5614/0.5455
 Boeing 0.4906/0.1345 0.5113/0.3925 0.5096/0.5405 0.5276/0.5714
RF Google 0.4923/0.1777 0.6032/0.6260 0.5223/0.5564 0.5951/0.5763
 Walmart 0.5118/0.5373 0.5300/0.3188 0.5300/0.4405 0.5000/0.5446
 Boeing 0.4945/0.3404 0.5197/0.5120 0.4961/0.5294 0.5673/0.5872
AB Google 0.4876/0.3141 0.5101/0.6667 0.5893/0.5619 0.5951/0.6850
 Walmart 0.5073/0.5029 0.5150/0.5359 0.5497/0.5650 0.5619/0.5503
 Boeing 0.4899/0.3169 0.5118/0.4364 0.4409/0.4580 0.5000/0.5094
 GB Google 0.4912/0.3387 0.5870/0.5854 0.5625/0.5243 0.6032/0.6202
 Walmart 0.5003/0.4955 0.5050/0.5123 0.5361/0.5109 0.5497/0.5650

company that specializes in Internet-related services and CNN
products. The third is Walmart, an American multinational 0.7
retail corporation that operates a chain of hypermarkets, 0.6
discount department stores, and grocery stores.
 The results on average accuracy are shown in Table 10 0.5
 Average accuracy

and Figure 7. These findings are very similar to those derived 0.4
in the previous case study, and their comparison confirmed
that the proposed feature combination model can outperform 0.3
other feature selection models in stock price movement
 0.2
prediction. With regard to feature selection underlain by
the bag-of-words algorithm, the CNN case study generated 0.1
more robust results than did the Reuters case study. The
 0
average accuracy of the bag-of-words algorithm was lower Boeing Google Walmart
than that of the stock data approach in the Reuters case study.
 Different company
In the CNN case study, the average accuracy levels of the
proposed feature combination model were 57.94%, 58.79%, SD CNN
and 57.67% for Boeing, Google, and Walmart, respectively. In BOW FC
the case study on Reuters, an average accuracy that exceeds Figure 7: Average accuracy achieved on the basis of news from CNN
60% was not achieved for any of the companies, illustrating and different feature set.
that differences in data source directly affect stock price
movement.
 We chose a combination of deep learning and knowledge combination exhibited superior prediction performance in
graph to build our feature selection model because this the comparison experiments involving other feature selection
Complexity 13

strategies. The forecast results based on different features data. At present, knowledge graph embedding inevitably
are shown in Table 10. We found that deep learning features produces a loss in news semantics, either because of a learning
are better than the use of bag-of-words and stock data. The principle or the tokenization of knowledge representation for
correlation of event tuples with the stock market is relatively vectorization. Thus, continuous representation in a knowl-
high in [5, 31], but the bag-of-words algorithm was relatively edge graph is still a huge challenge. We attempted to apply
fragmented, and the correlation between event tuples and the regression using the above-mentioned algorithms, but the
stock market data was relatively weak. Combining event tuple results indicated poor performance. More specifically, the
features with deep learning significantly improves forecast results for Apple validated our expectations.
results, indicating a close relationship between stock market The application of large-scale knowledge graph is still
movements and knowledge graph. relatively limited, and knowledge graph for smart search,
 smart question-and-answer tasks, social media, and other
5. Discussion areas are in their initial stages, with considerable room for
 improvement. The following advantages of knowledge graph
5.1. Research Findings. We attempted to compare our predic- should be considered: (a) the effective organization and
tion results with those made in previous studies wherein pre- expression of semistructured data, (b) knowledge reasoning,
diction was also based on the financial news of the renowned and (c) the expansion of cognitive ability for incorporating
companies. However, the findings are incomparable because deep learning. Traditional knowledge elements (entities, rela-
different studies use different datasets or algorithms, and tionship, attributes), extraction technologies, and methods
these methods are difficult to investigate using financial news have achieved good results in limited areas, but because of
headlines. In the current research, we refrained from eval- numerous constraints and poor scalability, knowledge graph
uating performance on one company dataset, this decision is not fully functional for financial forecasting because of
that enabled our knowledge graph method to exceed baseline numerous constraints and poor scalability.
predictions based only on the price by up to 3.6%. This
also proves that feature extraction in deep learning is more 6. Conclusions
effective than traditional machines. The combination of deep
learning and knowledge graph fully integrates the semantic Stock movement prediction of the renowned company is a
information in financial news, which effectively predicts the daunting task because stock prices are affected by many fac-
stock price movement of the renowned company. tors. This research presented a novel method for integrating
 This work demonstrated the application of deep learning knowledge graph embedding with stock market prediction.
and knowledge graph in finance. To the best of our knowl- The contributions of this study can be summarized as follows.
edge, knowledge graph has been rarely applied in stock pre- First, we developed a novel feature combination model that
diction. Because minimal financial training sets in knowledge constructs a feature mapping vector for each tuple–news
graph are available, financial knowledge extraction is the pair by simultaneously considering the diversity of entities
main task for the organizational construction of a knowledge and relationships. Second, the feature combination model
graph. Such extraction is critical for the understanding and was successfully applied to different types of companies and
processing of deep semantics in the event tuple, which also datasets and exhibited good performance in classification
directly influences the feature extraction of financial news. tasks.
 Stock market prediction of the renowned company
5.2. Implications for Business Activities. The utility of a feature grounded in knowledge graph is an interesting topic for
combination model based on knowledge graph is not limited business activities. Given that the study of knowledge graph
to financial analysis. Currently, knowledge graph data are for feature set is still in its infancy, we expect it to be applied
available for medical diagnosis, speech recognition, precise in a wide range of academic research. More companies will
marketing, and financial risk control [4]. Our model could also earn profits and create more opportunities through the
also be applied in these areas. use of knowledge graph in the feature set.
 Antifraud activities are an important part of finance.
Applying our model on the basis of knowledge graph on Data Availability
customers helps organize all relevant knowledge fragments
through deep semantic analysis and reasoning, which can The data used in this study can be accessed via https://
be verified with a customer’s bank information. Moreover, github.com/linechany/knowledge-graph.
customers typically use keywords to search for products,
and knowledge graph can provide relevant information to Conflicts of Interest
a customer. If a complete knowledge system of users is
described and collected, a system would better understand The author declares that there is no conflict of interest
and analyze user behaviors. regarding the publication of this paper.

5.3. Limitations and Future Work. A deep learning model Acknowledgments
uses supervised learning and needs a dataset with sufficient
labels, but our datasets do not work well with deep learning This work is supported by the China Scholarship Council
as a small number of financial news articles match stock (CSC) throughout the grant number: 201508390019. The
14 Complexity

authors also want to thank the research program RFCS from [15] W. Antweiler and M. Z. Frank, “Is all that talk just noise? the
the EU, which partially supported this research through the information content of internet stock message boards,” SSRN
research project AutoSurveillance, with project ID 847202. Electronic Journal, 2001.
 [16] M.-A. Mittermayer and G. F. Knolmayer, “NewsCATS: A news
 categorization and trading system,” in Proceedings of the 6th
References International Conference on Data Mining, ICDM 2006, pp. 1002–
 1007, China, December 2006.
 [1] B. G. Malkiel and E. F. Fama, “Efficient capital markets: a review
 of theory and empirical work,” The Journal of Finance, vol. 25, [17] R. P. Schumaker and H. Chen, “Textual analysis of stock
 no. 2, pp. 383–417, 1970. market prediction using breaking financial news: the AZFin text
 system,” ACM Transactions on Information and Systems, pp. 1–
 [2] D. Galai and R. W. Masulis, “The option pricing model and the
 29, 2009.
 risk factor of stock,” Journal of Financial Economics, vol. 3, no.
 1-2, pp. 53–81, 1976. [18] S. S. Groth and J. Muntermann, “An intraday market risk
 management approach based on textual analysis,” Decision
 [3] Q. Wang, Z. Mao, B. Wang, and L. Guo, “Knowledge graph
 Support Systems, vol. 50, no. 4, pp. 680–691, 2011.
 embedding: A survey of approaches and applications,” IEEE
 Transactions on Knowledge and Data Engineering, vol. 29, no. [19] T. Vu, S. Chang, Q. Ha, and N. Collier, “An experiment in inte-
 12, pp. 2724–2743, 2017. grating sentiment features for tech stock prediction in twitter,”
 in Proceedings of the Workshop on Information Extraction And
 [4] H. Paulheim and P. Cimiano, “Knowledge graph refinement: A
 Entity Analytics on Social Media Data, vol. 3, pp. 23–38, 2012.
 survey of approaches and evaluation methods,” Journal of Web
 Semantics: Science, Services and Agents on the World Wide Web, [20] B. Wang, H. Huang, and X. Wang, “A novel text mining
 vol. 8, no. 3, pp. 489–508, 2016. approach to financial time series forecasting,” Neurocomputing,
 vol. 83, pp. 136–145, 2012.
 [5] X. Ding, Y. Zhang, T. Liu, and J. Duan, “Deep learning for event-
 driven stock prediction,” in Proceedings of the 24th International [21] Q. Li, T. Wang, P. Li, L. Liu, Q. Gong, and Y. Chen, “The effect
 Joint Conference on Artificial Intelligence, IJCAI 2015, pp. 2327– of news and public mood on stock movements,” Information
 2333, Argentina, July 2015. Sciences, vol. 278, pp. 826–840, 2014.
 [6] X. Ding, Y. Zhang, T. Liu, and J. Duan, “Knowledge-driven [22] T. H. Nguyen, K. Shirai, and J. Velcin, “Sentiment analysis on
 event embedding for stock prediction,” in Proceedings of the social media for stock movement prediction,” Expert Systems
 26th International Conference on Computational Linguistics, with Applications, vol. 42, no. 24, pp. 9603–9611, 2015.
 COLING 2016, pp. 2133–2142, Japan, December 2016. [23] B. Weng, M. A. Ahmed, and F. M. Megahed, “Stock market one-
 [7] A. Bordes, N. Usunier, J. Weston, and O. Yakhnenko, “Translat- day ahead movement prediction using disparate data sources,”
 ing embeddings for modeling multi-relational data,” Advances Expert Systems with Applications, vol. 79, pp. 153–163, 2017.
 in NIPS, vol. 26, pp. 2787–2795, 2013. [24] J. Eberhard, J. F. Lavin, and A. Montecinos-Pearce, “A network-
 [8] H. Lin, Y. Liu, W. Wang, Y. Yue, and Z. Lin, “Learning entity based dynamic analysis in an equity stock market,” Complexity,
 and relation embeddings for knowledge resolution,” Procedia vol. 2017, Article ID 3979836, 16 pages, 2017.
 Computer Science, vol. 108, pp. 345–354, 2017. [25] Z. Zhang, Y. Zhang, D. Shen, and W. Zhang, “The dynamic
 [9] G. Ji, K. Liu, S. He, and J. Zhao, “Knowledge graph completion cross-correlations between mass media news, new media news,
 with adaptive sparse transfer matrix,” in Proceedings of the 30th and stock returns,” Complexity, vol. 2018, 11 pages, 2018.
 AAAI Conference on Artificial Intelligence, AAAI 2016, pp. 985– [26] P. C. Tetlock, “Giving content to investor sentiment: The role of
 991, USA, February 2016. media in the stock market,” Journal of Finance, vol. 62, no. 3, pp.
[10] G. Ji, S. He, L. Xu, K. Liu, and J. Zhao, “Knowledge graph 1139–1168, 2007.
 embedding via dynamic mapping matrix,” in Proceedings of [27] K. Chen, P. Luo, L. Liu, and W. Zhang, “News, search and stock
 the 53rd Annual Meeting of the Association for Computational co-movement: Investigating information diffusion in the finan-
 Linguistics and the 7th International Joint Conference on Natural cial market,” Electronic Commerce Research and Applications,
 Language Processing (Volume 1: Long Papers), pp. 687–696, vol. 28, pp. 159–171, 2018.
 Beijing, China, July 2015. [28] F. Z. Xing, E. Cambria, and Y. Zhang, “Sentiment-aware
[11] Y. LeCun, Y. Bengio, and G. Hinton, “Deep learning,” Nature, volatility forecasting,” Knowledge-Based Systems, vol. 176, pp.
 vol. 521, no. 7553, pp. 436–444, 2015. 68–76, 2019.
[12] Q. Li, Y. Chen, J. Wang, and H. Chen, “Web media and [29] A. Picasso, S. Merello, Y. Ma, L. Oneto, and E. Cambria,
 stock markets: a survey and future directions from a big “Technical analysis and sentiment embeddings for market trend
 data perspective,” IEEE Transactions on Knowledge and Data prediction,” Expert Systems with Applications, vol. 135, pp. 60–
 Engineering, vol. 4347, p. 1, 2017. 70, 2019.
[13] B. Wuthrich, V. Cho, S. Leung, D. Permunetilleke, K. Sankaran, [30] A. Khadjeh Nassirtoussi, S. Aghabozorgi, T. Ying Wah, and D.
 and J. Zhang, “Daily stock market forecast from textual Web C. L. Ngo, “Text mining for market prediction: a systematic
 data,” in Proceedings of the 1998 IEEE International Confer- review,” Expert Systems with Applications, vol. 41, no. 16, pp.
 ence on Systems, Man, and Cybernetics (Cat. No.98CH36218), 7653–7670, 2014.
 SMC’98, vol. 3, pp. 2720–2725, October 1998. [31] M. Kraus and S. Feuerriegel, “Decision support from financial
[14] G. Pui Cheong Fung, J. Xu Yu, and W. Lam, “Stock prediction: disclosures with deep neural networks and transfer learning,”
 integrating text mining approach using real-time news,” in Decision Support Systems, vol. 104, pp. 38–48, 2017.
 Proceedings of the 2003 IEEE International Conference on Com- [32] H. S. Sim, H. I. Kim, and J. J. Ahn, “Is deep learning for image
 putational Intelligence for Financial Engineering, CIFEr 2003, recognition applicable to stock market prediction?” Complexity,
 vol. 2003, pp. 395–402, China, March 2003. vol. 2019, 10 pages, 2019.
You can also read