Antimicrobial Resistance Trends in the Province of British Columbia 2014
←
→
Page content transcription
If your browser does not render page correctly, please read the page content below
655 West 12th Avenue
                                Vancouver, BC V5Z 4R4

                                Tel 604.707.2443
                                Fax 604.707.2441

                                www.bccdc.ca

Antimicrobial Resistance Trends in
the Province of British Columbia

2014

                         Prepared by the
                         Do Bugs Need Drugs? Program

                         October 2015

                     1
Contents
LIST OF TABLES ........................................................................................................................................IV
EXECUTIVE SUMMARY ..............................................................................................................................V
ABBREVIATIONS AND ACRONYMS .......................................................................................................VII
INTRODUCTION........................................................................................................................................... 1
METHODS .................................................................................................................................................... 1
GRAM-POSITIVE ORGANISMS .................................................................................................................. 3
1.1. Staphylococcus aureus .......................................................................................................................3
1.2. Streptococcus pneumoniae ................................................................................................................7
1.3. Streptococcus pyogenes ...................................................................................................................14
1.4. Enterococcus spp. ..............................................................................................................................16
GRAM-NEGATIVE ORGANISMS .............................................................................................................. 19
1.5. Escherichia coli ...................................................................................................................................19
1.6. Klebsiella pneumonia .........................................................................................................................23
1.7. Proteus mirabilis .................................................................................................................................25
1.8. Serratia, Providencia, Morganella, Citrobacter, and Enterobacter spp. .....................................28
1.9. Extended spectrum β-lactamase producing Enterobacteriaceae ..............................................30
Carbapenemase-Producing Organisms (CPOs) ...........................................................................34
AmpC ...................................................................................................................................................34
1.10. Pseudomonas aeruginosa ................................................................................................................35
1.11. Salmonella ...........................................................................................................................................38
1.12. Haemophilus influenzae ....................................................................................................................40
1.13. Campylobacter ....................................................................................................................................41
1.14. Neisseria gonorrhoeae ......................................................................................................................43
1.15. Neisseria meningitidis ........................................................................................................................44
OTHER ORGANISMS ................................................................................................................................ 45
1.16. Mycobacterium tuberculosis .............................................................................................................45
ACKNOWLEDGEMENT ............................................................................................................................. 47
REFERENCES ............................................................................................................................................ 48
APPENDIX A: SUPPLEMENTAL TABLES ............................................................................................... 52
APPENDIX B: DATA SOURCES ............................................................................................................... 55
APPENDIX C: COMMUNITY LABORATORY DATA REPRESENTATIVENESS .................................... 57
2014 AMR Trends Report iiList of Figures
Figure 1- Proportion of Staphylococcus aureus isolates methicillin-sensitive (MSSA) and methicillin-
resistant (MRSA) (2007-2014) ............................................................................................................. 4
Figure 2- Proportion of MSSA and MRSA isolates non-susceptible to clindamycin, erythromycin, TMP-
SMX, and tetracycline (2007-2014). ..................................................................................................... 6
Figure 3- Proportion of Streptococcus pneumoniae isolates non-susceptible to penicillin, TMP-SMX,
erythromycin, tetracycline, and clindamycin (2007-2014) .................................................................. 10
Figure 4- Proportion of Streptococcus pneumoniae isolates from BC hospitals non-susceptible to
penicillin, TMP-SMX, clindamycin, erythromycin, ceftriaxone, ciprofloxacin, tetracycline,
moxifloxacin, and levofloxacin (1994-2014). ...................................................................................... 13
Figure 5- Proportion of Streptococcus pyogenes isolates non-susceptible to erythromycin and with
inducible clindamycin non-susceptibility (as determined by the D-test in the presence of
erythromycin) (2007-2014) ................................................................................................................. 15
Figure 6- Proportion of Enterococcus spp. isolates non-susceptible to vancomycin, ampicillin,
nitrofurantoin, and ciprofloxacin (2007-2014) ..................................................................................... 17
Figure 7- Proportion of Enterococcus spp. urinary isolates non-susceptible to ciprofloxacin by age of
patient (2007-2014) ............................................................................................................................ 18
Figure 8- Proportion of Escherichia coli isolates non-susceptible to ampicillin, cefotaxime, ciprofloxacin,
nitrofurantoin, TMP-SMX and gentamicin (2007-2014)...................................................................... 21
Figure 9- Proportion of Escherichia coli urinary isolates non-susceptible to ciprofloxacin by age of patient
(2007-2014) ........................................................................................................................................ 22
Figure 10- Proportion of Klebsiella pneumoniae isolates non-susceptible to ciprofloxacin, gentamicin,
nitrofurantoin, and TMP-SMX (2007-2014) ........................................................................................ 24
Figure 11- Proportion of Proteus mirabilis isolates non-susceptible to ciprofloxacin, TMP-SMX,
gentamicin, and ampicillin (2007-2014).............................................................................................. 27
Figure 12- Proportion of SPICE (Serratia spp., Providencia spp., Morganella spp., Citrobacter spp., and
Enterobacter spp.) isolates non-susceptible to ciprofloxacin, nitrofurantoin, gentamicin, and TMP-
SMX (2008-2014) ............................................................................................................................... 29
Figure 13- Distribution of ESBL- like phenotypes in Escherichia coli, Klebsiella pneumoniae, and Proteus
mirabilis (2014) ................................................................................................................................... 31
Figure 14- Proportion of Escherichia coli, Klebsiella pneumoniae and Proteus mirabilis isolates
demonstrating ESBL-compatible phenotype (2007-2014) ................................................................. 32
Figure 15- Proportion of ESBL-like Escherichia coli, Klebsiella pneumonia, and Proteus mirabilis isolates
demonstrating non-susceptibility to quinolones, aminoglycosides or TMP-SMX, two or more, and
three of quinolones, aminoglycosides, and TMP-SMX (2007-2014) .................................................. 33
Figure 16- Proportion of Pseudomonas aeruginosa isolates non-susceptible to tobramycin, gentamicin,
ciprofloxacin, piperacillin, and ceftazidime (2007-2014) .................................................................... 37
Figure 17- Proportion of Salmonella Enteritidis isolates resistant to ampicillin, tetracycline, and
chloramphenicol in British Columbia (2003-2014). ............................................................................ 39
Figure 18- Proportion of Salmonella Heidelberg isolates resistant to amoxicillin-clavulanic acid,
ceftriaxone, ampicillin, and tetracycline in British Columbia (2007-2014) .......................................... 39
Figure 19- Proportion of Haemophilus influenzae isolates resistant to ampicillin (2007-2014) ................. 40
Figure 20- Proportion of Campylobacter spp. non-susceptible to ciprofloxacin, erythromycin, and
tetracycline (2008-2014). .................................................................................................................... 42
Figure 21- Percentage of tested N. gonorrhoeae isolates with elevated MICs to azithromycin, cefixime
and ceftriaxone (2010 - 2014). MIC units are in µg/mL. ..................................................................... 43
Figure 22- Proportion and number of M. tuberculosis complex patients that are mono-resistant, poly-
resistant and multi-drug resistant in British Columbia, Canada (2005-2014)..................................... 46
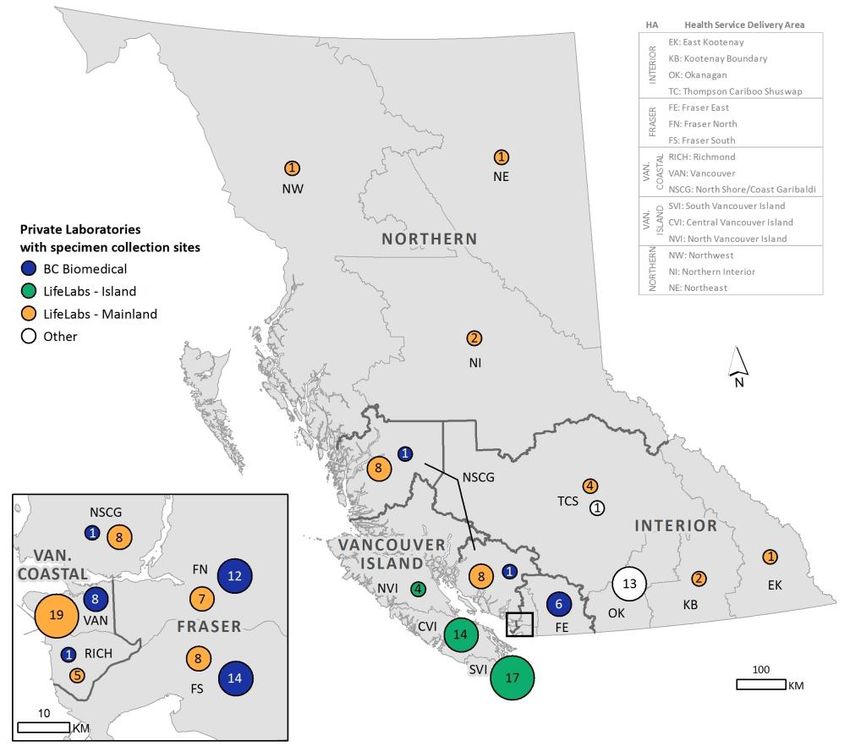
Figure 23- Community Laboratories in British Columbia as of November 2014 by Health Service Delivery
Area (HSDA) ....................................................................................................................................... 57
2014 AMR Trends Report iiiList of Tables
Table 1 - Genes harboured in identified cases of carbapenemase-producing organisms (CPO) from 2008 to March
2014. .................................................................................................................................................................. 34
Table A.1-Total number of isolates tested for antimicrobial susceptibility from the various data sources. ................... 52
Table A.2- Summary of antimicrobial modes of action and bacterial mechanisms of resistance. ................................ 54
2014 AMR Trends Report ivExecutive Summary
This report aims to provide a comprehensive overview of antimicrobial resistance (AMR) trends in the province of
British Columbia (BC). A summary of the results is presented below:
Gram Positive Organisms
The proportion of Staphylococcus aureus isolates that were methicillin resistant (MRSA) ranged from 16.1% to
30.5% from 2007 to 2014 according to BC Biomedical data, 12.4% to 19.3% on the Island (LifeLabs) and 20.1%
to 27.7% in the Mainland (LifeLabs). In 2014, rates of resistance to clindamycin, erythromycin, and
trimethoprim-sulfamethoxazole (TMP-SMX) among MRSA isolates were 36.6%, 82.8% and 1.3%, respectively
(BC Biomedical data). Tetracycline resistance estimates among MRSA isolates were lower on the Island (5.1%)
compared to the Mainland (11.2%) in 2014 according to LifeLabs data.
Streptococcus pneumoniae isolates have demonstrated a stable rate of resistance to all antibiotics tested
since 2007 according to BC Biomedical data, with Mainland data (LifeLabs) showing similar trends and Island
data (LifeLabs) with lower rates. In 2014, 35.2%, 18.7%, 17.1% of all tested isolates demonstrated non-
susceptibility against erythromycin, penicillin, and clindamycin according to BC Biomedical data.
From 2007 to 2010, non-susceptibility rates to erythromycin and clindamycin decreased in Streptococcus
pyogenes isolates; however, as of 2014, non-susceptibility rates had increased to 12.3% and 11.8%,
respectively. LifeLabs data from Mainland show a similar increasing trend to both antibiotics tested
(erythromycin: pBiomedical). Ceftazidime shows a similar trend and reported at 2.2% in 2014. Non-susceptibility to gentamicin
and tobramycin remains low in 2014 at a rate of 3.3 % and 0.8%, respectively, while the proportion of isolates
non-susceptible to ciprofloxacin is higher at a rate of 9.0% in 2013 (BC Biomedical).
In 2014, the proportion of Salmonella Enteritidis isolates non-susceptible to tetracycline, ampicillin, and
chloramphenicol remains low at 1.6%, 5.5% and 0.8%, respectively. The proportion of Salmonella Heidelberg
isolates that are non-susceptible to amoxicillin-clavulanic acid, ceftriaxone, ampicillin, and tetracycline has
decreased since the peaks in 2012 and is reported to be at 36.4%, 36.4%, 45.5%, and 18.2%, respectively.
The percent of Haemophilus influenzae isolates resistant to ampicillin has remained between 14.3 and 23.5%
from 2007 to 2014 and is reported to be at 23.5% in 2014 (BC Biomedcal).
In 2014, the rate of non-susceptibility to erythromycin in Campylobacter remains low at 5.4% on the Island and
3.3% on the Mainland according to LifeLabs data. However, non-susceptibility rates to ciprofloxacin fluctuates
substantially between 25.4% and 43.2% on the Island and between 36.9% and 50.1% during the time period
2008 to 2013 (Island: p=0.432; Mainland: p=0.059). The non-susceptibility rate to tetracycline fluctuates around
35% on both the Mainland and on the Island and is reported to be 37.0% on the Island and 52.7% on the
Mainland in 2014.
An overall decreasing trend is observed for isolates with elevated MICs to cefixime, azithromycin, and
ceftriaxone in Neisseria gonorrhoeae isolates when compared to data from 2011. In 2014, 0.0% and 0.4% of
isolates showed decreased susceptibility to cefixime and ceftriaxone, respectively; while 22.4% showed
resistance to ciprofloxacin.
In 2014, 5.0% of Neisseria meningitidis isolates showed resistance to ciprofloxacin. The proportion of isolates
demonstrating non-susceptibility to penicillin decreased as compared to 2012 and is reported to be at 35.0% in
2014.
Other Organisms
Rates of poly-drug resistance in patients infected with Mycobacterium tuberculosis (MTB) remains low at less
than 1.0% of patients. However, rate of multi-drug resistance has increased and reported at 2.2% which is the
highest rate since 2005. In 2014, 9.9% of patients were infected with MTB exhibited resistance to one drug.
Data Sources
LifeLabs Medical Laboratory Services (including BC Biomedical Laboratories)
BC Public Health Microbiology & Reference Laboratory
Canadian Bacterial Surveillance Network
Canadian Integrated Program for Antimicrobial Resistance Surveillance
2014 AMR Trends Report viAbbreviations and Acronyms
AMR Antimicrobial Resistance
ATC Anatomical Therapeutic Classification
BC British Columbia
BCAMM British Columbia Association of Medical Microbiologists
BCCDC British Columbia Centre for Disease Control
BCPHMRL British Columbia Public Health Microbiology & Reference Laboratory
CA-MRSA Community-Associated Methicillin-Resistant Staphylococcus aureus
CANWARD Canadian Ward Surveillance Study
CBSN Canadian Bacterial Surveillance Network
CIPARS Canadian Integrated Program for Antimicrobial Resistance Surveillance
CLSI Clinical and Laboratory Standards Institute
CNISP Canadian Nosocomial Infection Surveillance Program
CRE Carbapenem-resistant Enterobacteriaceae
DNA Deoxyribonucleic acid
D-test Double Disk Diffusion Test
ESBL Extended-Spectrum β-lactamase
GAS Group A Streptococcus
HA-MRSA Hospital-Associated Methicillin-Resistant Staphylococcus aureus
iPHIS Integrated Public Health Information System
MIC Minimum Inhibitory Concentration
MRSA Methicillin-Resistant Staphylococcus aureus
MSSA Methicillin-Susceptible Staphylococcus aureus
NML National Microbiology Laboratory
MTB Mycobacterium tuberculosis
PHAC Public Health Agency of Canada
SPICE Serratia spp., Providencia spp., Morganella spp., Citrobacter spp., and
Enterobacter spp. are collectively referred to as the SPICE organisms
TMP-SMX Trimethoprim-Sulfamethoxazole
UTI Urinary Tract Infection
VRE Vancomycin-Resistant Enterococcus
WHO World Health Organization
2014 AMR Trends Report viiIntroduction Antimicrobial resistance (AMR) poses a serious threat to public health globally (1) . Bacterial strains that develop or acquire resistance to one or more first-line antimicrobials pose numerous challenges to healthcare including: increased patient morbidity and mortality, increased drug costs, prolonged illness duration, and more expensive disease control measures (2). These antimicrobial resistant strains arise, in part, as a result of antimicrobial use that selects for resistant organisms (2). Inappropriate antimicrobial use, therefore, contributes unnecessarily to the rise in resistance. As AMR genes or plasmids can be readily transmitted between bacterial species via horizontal gene transfer (HGT), surveillance of AMR trends is critical for the rapid detection of new isolates and continuous monitoring of disease prevalence (2). This report aims to provide a comprehensive overview of antibacterial resistance trends for clinically relevant Gram positive and Gram negative bacteria in the community in the province of British Columbia (BC), for all years where data are available, as part of the Do Bugs Need Drugs? (DBND) program evaluation. The DBND program is a community education program for health care professionals and the public geared towards decreasing antibiotic overuse and misuse and limiting the spread of resistant organisms. DBND has been funded since its inception in BC (2005) by the Medical Beneficiary & Pharmaceutical Services Division, BC Ministry of Health. Although this report has been updated annually since 2006, data presented in this report differ from previous years due to additional information regarding changes in testing methods or number of isolates tested. The most current report should be considered the most accurate. Methods Data were provided by various provincial and national collaborators in either anonymized line-listed or aggregate form. The line-listed data from LifeLabs Medical Laboratory Services (LifeLabs) has been included since 2013 in addition to line-listed data provided by BC Biomedical Laboratories (now part of LifeLabs). LifeLabs is a community- based laboratory network, provides services to Vancouver Island and the rest of the Mainland whereas BC Biomedical has a concentration of services in the Fraser Health Authority region. Data from the Mainland and the Island are presented separately to provide a geographical comparison of non-susceptibility rates. Where data from both geographical areas show similar trends, an overall statement regarding the data was provided. It should be noted, that LifeLabs and BC Biomedical use different susceptibility testing methodologies which may affect the estimates presented in the report. Testing methodologies will be standardized across both LifeLabs and BC Biomedical Laboratories in the future. Please see Appendix B for more information. Data analysis Data were analyzed using SPSS 14.0 for Windows. Microsoft Excel 2007 was used in the creation of all figures and tables. Where appropriate, the trend of non-susceptibility over time was tested for significance using the two-sided non-parametric Spearman Rank test. Please note that for BC Biomedical Laboratories (BC Biomedical) data, the trend over time was tested for significance between 2007 and 2014 and between 2008 and 2014 for LifeLabs data. All available years were included in the analysis. The significance level for this report was set at p
As resistance rates differed substantially between organisms, scale bars (vertical axes) on figures are not
consistent between organisms. Caution should be exercised when interpreting and comparing figures across
organisms.
2014 AMR Trends Report 2Gram-positive Organisms
1.1. Staphylococcus aureus
Staphylococcus aureus is a Gram positive organism that most commonly causes skin and soft tissue infections,
but can also cause disease in other organ systems (e.g. pneumonia, sepsis) (4). Methicillin-resistant Staphylococcus
aureus (MRSA) strains are the most prevalent and most clinically important form of antimicrobial resistance among
the staphylococci. The existence of MRSA was first reported in 1964 in the United States and the United Kingdom,
and nosocomial outbreaks were becoming common by the late 1970s (5). The first major report of MRSA in BC was
an outbreak in a Vancouver teaching hospital in 1981 (5). Although MRSA infections were traditionally only acquired
in the hospital setting, community-associated MRSA (CA-MRSA) strains have become prevalent both in hospitals and
in the community (6). Hospital-associated MRSA (HA-MRSA) infections are typically resistant to multiple classes of
antimicrobials in addition to β-lactam antimicrobials. Methicillin-susceptible S. aureus (MSSA) reported here,
represents all strains of S. aureus that are susceptible to the β-lactam class of antibiotics at a community level.
Data from BC Biomedical Laboratories indicate a higher proportion of MRSA among S. aureus isolates as
compared to data from LifeLabs (both Mainland and Island). Vancouver Island is found to have the lowest rate of
MRSA isolates at 12.4% in 2014 while the rate for BC Biomedical Laboratories and the Mainland showed similar
rates (Figure 1).
BC Biomedical Laboratories data show that among MRSA isolates, resistance to erythromycin, trimethoprim-
sulfamethoxazole (TMP-SMX) significantly declined from 2007 to 2014 (erythromycin: pBC Biomedical
100%
80%
Percentage of Isolates
60%
40%
20%
0%
2007 2008 2009 2010 2011 2012 2013 2014
MSSA 69.5% 83.9% 76.1% 72.1% 75.1% 76.1% 76.8% 76.7%
MRSA 30.5% 16.1% 23.9% 27.9% 24.9% 23.9% 23.2% 23.3%
Total 7668 6636 7006 6731 5873 5659 6321 6391
LifeLabs- Island
100%
80%
Percentage of Isolates
60%
40%
20%
0%
2008 2009 2010 2011 2012 2013 2014
MSSA 80.7% 82.8% 85.1% 85.1% 86.0% 87.0% 87.6%
MRSA 19.3% 17.2% 14.9% 14.9% 14.0% 13.0% 12.4%
Total 5575 5215 4762 4827 4676 4317 4619
LifeLabs- Mainland
100%
80%
Percentage of Isolates
60%
40%
20%
0%
2008 2009 2010 2011 2012 2013 2014
MSSA 72.3% 75.5% 75.7% 78.2% 78.8% 78.8% 79.8%
MRSA 27.7% 24.5% 24.3% 21.8% 21.2% 21.2% 20.2%
Total 10846 10351 9856 9783 9912 9206 9586
Figure 1- Proportion of Staphylococcus aureus isolates methicillin-sensitive (MSSA) and methicillin-resistant (MRSA) (2007-2014)
Source: BC Biomedical Laboratories and LifeLabs (Island and Mainland)
2014 AMR Trends Report 4MSSA MRSA
Clindamycin Clindamycin
50% 100%
40% 80%
Percentage of Isolates
Percentage of Isolates
30% 60%
20% 40%
10% 20%
0% 0%
2007 2008 2009 2010 2011 2012 2013 2014 2007 2008 2009 2010 2011 2012 2013 2014
BC Biomed 16.8% 16.7% 16.1% 16.1% 15.8% 15.9% 14.4% 14.3% BC Biomed 37.7% 39.0% 35.7% 36.7% 36.3% 38.0% 38.6% 36.6%
LifeLabs- Island N/A 13.6% 9.3% 11.1% 10.0% 14.6% 21.2% 15.2% LifeLabs- Island N/A 20.7% 18.5% 19.5% 17.6% 16.5% 16.1% 19.1%
LifeLabs- Mainland N/A 22.1% 19.6% 27.1% 34.5% 27.2% 26.0% 21.0% LifeLabs- Mainland N/A 33.8% 28.4% 32.1% 35.5% 34.7% 32.2% 35.1%
Erythromycin Erythromycin
50% 100%
40% 80%
Percentage of Isolates
Percentage of Isolates
30% 60%
20% 40%
10% 20%
0% 0%
2007 2008 2009 2010 2011 2012 2013 2014 2007 2008 2009 2010 2011 2012 2013 2014
BC Biomed 21.8% 22.1% 22.2% 23.4% 22.7% 22.1% 20.2% 20.7% BC Biomed 94.2% 90.5% 89.2% 89.3% 87.0% 84.8% 82.8% 82.8%
LifeLabs- Island N/A 19.0% 18.3% 17.3% 18.3% 17.6% 17.3% 16.4% LifeLabs- Island N/A 88.7% 88.0% 86.3% 84.3% 83.7% 83.3% 78.6%
LifeLabs- Mainland N/A 22.2% 21.4% 22.0% 21.0% 21.1% 21.4% 20.7% LifeLabs- Mainland N/A 91.7% 89.3% 87.2% 84.6% 81.5% 77.7% 78.3%
TMP-SMX TMP-SMX
50% 100%
40% 80%
Percentage of Isolates
Percentage of Isolates
30% 60%
20% 40%
10% 20%
0% 0%
2007 2008 2009 2010 2011 2012 2013 2014 2007 2008 2009 2010 2011 2012 2013 2014
BC Biomed 2.6% 3.5% 3.6% 0.9% 0.8% 0.6% 0.5% 0.4% BC Biomed 5.9% 7.5% 4.7% 3.5% 2.2% 1.8% 1.4% 1.3%
LifeLabs- Island 1.1% 3.0% 2.2% 0.5% 2.2% 3.6% 3.1% LifeLabs- Island N/A 2.2% 3.0% 2.3% 1.5% 2.9% 0.9% 3.85%
N/A
LifeLabs- Mainland N/A 2.4% 4.5% 4.3% 5.1% 4.5% 3.2% 4.4% LifeLabs- Mainland N/A 5.0% 6.0% 6.6% 6.6% 8.2% 7.0% 6.73%
2014 AMR Trends Report 5MSSA MRSA
Tetracycline Tetracycline
50% 100%
40% 80%
Percentage of Isolates
Percentage of Isolates
30% 60%
20% 40%
10% 20%
0% 0%
2007 2008 2009 2010 2011 2012 2013 2014 2007 2008 2009 2010 2011 2012 2013 2014
BC Biomed 5.4% 4.2% 4.4% 4.3% 4.3% 4.1% 0.0% 0.0% BC Biomed 9.9% 8.5% 6.3% 6.8% 5.1% 6.7%
LifeLabs- Island N/A 3.2% 3.4% 4.0% 3.1% 3.0% 2.7% 3.5% LifeLabs- Island N/A 3.8% 3.7% 4.4% 2.8% 3.2% 4.3% 5.10%
LifeLabs- Mainland N/A 5.3% 4.8% 5.1% 5.0% 4.5% 4.6% 5.2% LifeLabs- Mainland N/A 8.6% 7.9% 9.3% 10.6% 10.0% 10.1% 11.2%
Figure 2- Proportion of MSSA and MRSA isolates non-susceptible to clindamycin, erythromycin, TMP-SMX, and tetracycline (2007-
2014).
Source: BC Biomedical Laboratories and LifeLabs (Island and Mainland)
Please note: Resistance data to tetracycline was not available for BC Biomedical Laboratories since 2013.
2014 AMR Trends Report 61.2. Streptococcus pneumoniae
Streptococcus pneumoniae (pneumococcus) is the leading cause of community-acquired pneumonia (CAP), but
is also commonly found to be the predominant cause in acute otitis media, bacteraemia, and meningitis (7). All
diseases associated with pneumococcal infection follow colonization of the mucosal surface of the upper respiratory
tract. Although colonization at this site is asymptomatic, further spread of pneumococci into sections of the airway
that are typically sterile will trigger the inflammatory response which results in disease (7). The major virulence factor
of pneumococcus is its polysaccharide capsule, of which 91 serotypes differing both structurally and antigenically,
has been identified thus far Competition exists, not only amongst the various pneumococcal strains, but also among
the 700 other microbial species estimated to reside within the human pharynx (7). This highly populated microbial
environment presents an excellent opportunity for S. pneumonia to take up exogenous DNA from closely related oral
streptococcal species and co-colonizing pneumococci thus increasing its overall fitness (7). First-line treatment for
pneumococcal infections typically includes β-lactams, macrolides, and tetracycline (see Bugs & Drugs 2012 edition
for the full list of recommended therapies) . However, uptake of genes by S. pneumonia that encode altered penicillin-
binding proteins has contributed to the resistance of β-lactams which severely impacts the effective treatment of
pneumococcal infections (7). The first S. pneumonia isolate described to be non-susceptible to penicillin was
identified in Australia in 1967. Resistance to penicillin emerged and spread rapidly to other part parts of the world in
1990s and was associated with increased antibiotic consumption (8). The first case of a penicillin-resistant isolate in
BC was reported in 1993 (9). Since the advent of antibiotics, outbreaks of invasive S. pneumonia have been relatively
rare. However, during the period 2005-2009, an epidemic of invasive pneumococcal disease caused by S.
pneumonia serotype 5 was observed in Canada, with 33% of cases (343 cases) reported in British Columbia (9). A
heptavalent pneumococcal vaccine (PCV7) was introduced in BC since 2003 and covers 80% of serotypes causing
invasive disease in children younger than five (10). However, in 2010, the PCV-7 was replaced with the PCV-13,
which provides greater protection against additional serotypes (11)
According to BC Biomedical Laboratories data, 18.7% of S. pneumoniae are non-susceptible to penicillin in
2014, the majority of which show intermediate resistance (Figure 3). The proportion of S. pneumoniae non-
susceptible to erythromycin has remained stable around 30% from 2007 to 2014 (p=0.43) and is at 35.2% in 2014
(Figure 3). Similarly, non-susceptibility towards TMP-SMX has appeared to remain stable at approximately 20% of
isolates from 2007 to 2014 (p=0.56). Tetracycline non-susceptibility has exhibited a similar trend, with non-
susceptibility rates fluctuating between 15% and 20% from 2007 to 2013 (p=0.38), which is no longer tested by BC
Biomedical starting 2014 (Figure 3). Levofloxacin non-susceptibility has remained less than 5% of isolates since
2007 and currently sits at 4.2% (data not shown). All isolates are fully resistant to cefixime in 2014 (data not shown).
LifeLabs data suggest that higher non-susceptibility rates across most of the tested antibiotics exist on the
Mainland when compared to Vancouver Island among S. pneumoniae isolates. Analyses for resistance against
penicillin are restricted to oral-penicillin susceptibility results for non-meningitis S. pneumoniae isolates. According to
LifeLabs data, non-susceptibility to penicillin has fluctuated between 6.46% and 17.7% from 2008 to 2014 and was at
a rate of 5.2% on Island and 9.0% on Mainland in 2014, which is lower than the BC Biomedical rate (18.7%) (Figure
3). In 2014, non-susceptibility data to TMP-SMX are 10.9% for Mainland isolates and 7.8% for Island isolates, which
is much lower than BC Biomedical data (20.6%) (Figure 3). The rate of erythromycin non-susceptibility in 2014 is
higher among isolates from the Mainland (26.4%) when compared to isolates from the Island (16.5%) with the rate
from the Mainland closely mirroring the trend observed from BC Biomedical (Figure 3). The rate of tetracycline non-
susceptibility has been substantially lower on the Island compared to the Mainland since 2008. In 2014, the rate of
tetracycline non-susceptibility is 16.8% for the Mainland and 6.6% for Island (Figure 3).
In addition to the data collected from BC Biomedical and LifeLabs, hospital based data from Canadian Bacterial
Surveillance Network (CBSN) were analyzed. CBSN data are collected from one or two hospital in BC, and the
difference in the site of data collection may result in discrepancy between trends. Data from CBSN suggest a general
increase in the percent of isolates non-susceptible to erythromycin, clindamycin, and ciprofloxacin between 1994 and
2014 (erythromycin: p2012 and is currently 11.5% in 2014 (p=0.960) (Figure 4). Ceftriaxone non-susceptibility has remained low since the
peak noted in 2010 (10.6%) and 100% of S. pneumoniae isolates are susceptible to ceftriaxone in 2014 (Figure 4). In
addition, 100% of S. pneumoniae isolates remain sensitive to moxifloxacin and levofloxacin in 2014 (Figure 4).
Penicillin
50%
40%
Percentage of Isolates
30%
20%
10%
0%
2007 2008 2009 2010 2011 2012 2013 2014
BC Biomed Resistant BC Biomed Intermediate
LifeLabs- Island Resistant LifeLabs- Island Intermediate
LifeLabs- Mainland Resistant LifeLabs- Mainland Intermediate
Year
Data Source Susceptibility 2007 2008 2009 2010 2011 2012 2013 2014
a.
I 12.3% 8.8% 16.3% 20.7% 15.0% 14.5% 8.4% 16.3%
BC Biomed b.
R 6.5% 3.4% 0.8% 0.9% 3.0% 2.7% 3.2% 2.4%
I N/A 2.8% 0.8% 6.5% 3.9% 2.9% 3.1% 3.8%
LifeLabs- Island
R N/A 1.4% 4.1% 11.6% 1.9% 0.0% 0.0% 1.3%
I N/A 5.0% 4.2% 7.9% 8.5% 6.6% 7.9% 8.5%
LifeLabs- Mainland
R N/A 8.5% 4.0% 9.6% 1.4% 0.2% 0.0% 0.5%
2014 AMR Trends Report 8Erythromycin
50%
40%
Percentage of Isolates
30%
20%
10%
0%
2007 2008 2009 2010 2011 2012 2013 2014
BC Biomed 29.7% 27.3% 32.8% 29.5% 31.4% 33.7% 26.2% 35.2%
LifeLabs- Island N/A 8.5% 8.0% 14.6% 16.6% 16.0% 12.1% 16.5%
LifeLabs- Mainland N/A 22.9% 26.1% 33.8% 30.2% 22.4% 24.5% 26.4%
TMP-SMX
50%
40%
Percentage of Isolates
30%
20%
10%
0%
2007 2008 2009 2010 2011 2012 2013 2014
BC Biomed 16.1% 24.7% 18.9% 21.4% 23.9% 21.9% 20.2% 20.6%
LifeLabs- Island N/A 10.5% 6.9% 14.0% 17.7% 18.8% 6.0% 7.8%
LifeLabs- Mainland N/A 17.3% 19.2% 24.3% 17.5% 12.2% 11.9% 10.9%
Tetracycline
50%
40%
Percentage of Isolates
30%
20%
10%
0%
2007 2008 2009 2010 2011 2012 2013 2014
BC Biomed 17.1% 15.4% 18.3% 18.4% 17.4% 20.2% 22.2% N/A
LifeLabs- Island N/A 6.0% 3.7% 3.2% 13.1% 14.6% 6.0% 6.6%
LifeLabs- Mainland N/A 22.4% 23.1% 29.6% 28.2% 22.5% 20.9% 16.8%
2014 AMR Trends Report 9Clindamycin
50%
40%
Percentage of Isolates
30%
20%
10%
0%
2007 2008 2009 2010 2011 2012 2013 2014
BC Biomed 16.9% 11.3% 19.7% 18.3% 14.9% 15.8% 14.3% 17.1%
Figure 3- Proportion of Streptococcus pneumoniae isolates non-susceptible to penicillin, TMP-SMX, erythromycin, tetracycline, and
clindamycin (2007-2014)
Source: BC Biomedical Laboratories and LifeLabs Medical Laboratory Services
a
I= Isolates classified as having intermediate resistance based on MIC breakpoints and CLSI guidelines
b
R= Isolates classified as resistant based on MIC breakpoints and CLSI guidelines
Please note: LifeLabs data for resistance to clindamycin was limited (nPenicillin
50%
40%
Percentage of Isoaltes
30%
20%
10%
0%
1994 1995 1996 1997 1998 1999 2000 2001 2002 2003 2004 2005 2006 2007 2008 2009 2010 2011 2012 2013 2014
Intermediate 9.1% 3.8% 12.5% 1.3% 8.4% 7.8% 0.8% 9.1% 8.2% 9.5% 7.2% 10.9% 4.1% 3.8% 6.1% 6.7% 1.5% 5.5% 11.5% 16.9% 7.7%
Resistant 1.7% 1.9% 4.2% 6.5% 11.9% 1.9% 2.5% 4.2% 3.0% 5.5% 2.7% 3.6% 4.7% 5.1% 7.1% 13.3% 10.6% 2.7% 3.8% 3.4% 0.0%
TMP-SMX
50%
40%
Percentage of Isoaltes
30%
20%
10%
0%
1994 1995 1996 1997 1998 1999 2000 2001 2002 2003 2004 2005 2006 2007 2008 2009 2010 2011 2012 2013 2014
Intermediate 10.0% 8.5% 4.2% 7.8% 8.4% 11.7% 5.0% 6.1% 2.2% 9.5% 5.4% 5.5% 3.2% 7.6% 3.0% 13.3% 1.5% 8.2% 3.8% 10.2% 3.8%
Resistant 4.8% 11.3% 16.7% 14.3% 16.1% 7.8% 8.3% 10.3% 15.7% 16.5% 11.7% 13.6% 11.4% 16.5% 19.2% 10.0% 24.2% 17.8% 11.5% 5.1% 7.7%
Clindamycin
50%
40%
Percentage of Isoaltes
30%
20%
10%
0%
1994 1995 1996 1997 1998 1999 2000 2001 2002 2003 2004 2005 2006 2007 2008 2009 2010 2011 2012 2013 2014
Intermediate 0.0% 0.0% 0.0% 0.0% 0.7% 0.0% 0.0% 0.0% 0.0% 0.0% 1.8% 0.0% 0.0% 0.0% 0.0% 0.0% 0.0% 0.0% 0.0% 0.0% 0.0%
Resistant 5.2% 0.9% 2.1% 3.9% 5.6% 3.9% 2.5% 3.0% 4.5% 6.3% 4.5% 3.6% 6.2% 7.6% 11.1% 13.3% 10.6% 4.1% 13.5% 5.1% 3.8%
2014 AMR Trends Report 11Erythromycin
50%
40%
Percentage of Isoaltes
30%
20%
10%
0%
1994 1995 1996 1997 1998 1999 2000 2001 2002 2003 2004 2005 2006 2007 2008 2009 2010 2011 2012 2013 2014
Intermediate 0.0% 0.0% 0.0% 0.0% 1.4% 0.0% 0.0% 0.0% 0.0% 0.8% 0.0% 0.0% 0.0% 0.0% 0.0% 0.0% 0.0% 0.0% 0.0% 0.0% 0.0%
Resistant 5.7% 0.7% 2.1% 6.5% 11.9% 5.8% 8.3% 4.2% 7.5% 14.2% 15.3% 12.7% 13.5% 13.9% 21.2% 23.3% 19.7% 19.2% 23.1% 16.9% 15.4%
Ceftriaxone (non-meningitis breakpoint)
50%
40%
Percentage of Isoaltes
30%
20%
10%
0%
1994 1995 1996 1997 1998 1999 2000 2001 2002 2003 2004 2005 2006 2007 2008 2009 2010 2011 2012 2013 2014
Intermediate 1.3% 1.9% 0.0% 3.9% 5.6% 1.9% 1.7% 4.2% 5.2% 6.3% 4.5% 5.5% 4.2% 1.3% 4.0% 3.3% 10.6% 0.0% 1.9% 3.4% 0.0%
Resistant 0.4% 0.0% 0.0% 1.3% 6.3% 1.0% 0.8% 1.8% 0.8% 1.6% 0.9% 0.0% 2.1% 5.1% 3.0% 6.7% 0.0% 0.0% 0.0% 0.0% 0.0%
Ciprofloxacin
50%
40%
Percentage of Isoaltes
30%
20%
10%
0%
1994 1995 1996 1997 1998 1999 2000 2001 2002 2003 2004 2005 2006 2007 2008 2009 2010 2011 2012 2013 2014
Resistant 0.0% 1.9% 0.0% 0.0% 0.0% 2.9% 1.7% 3.0% 2.2% 1.6% 2.7% 0.9% 2.1% 1.3% 3.0% 0.0% 3.0% 4.1% 5.8% 3.4% 0.0%
2014 AMR Trends Report 12Tetracycline
50%
40%
Percentage of Isoaltes
30%
20%
10%
0%
1994 1995 1996 1997 1998 1999 2000 2001 2002 2003 2004 2005 2006 2007 2008 2009 2010 2011 2012 2013 2014
Resistant 3.0% 3.8% 4.2% 6.5% 15.3% N/A 0.0% 6.1% 4.5% 7.9% 7.2% 6.4% 7.3% 12.7% 13.1% 16.7% 18.2% 12.3% 13.5% 10.2% 3.8%
Moxifloxacin
50%
40%
Percentage of Isoaltes
30%
20%
10%
0%
1994 1995 1996 1997 1998 1999 2000 2001 2002 2003 2004 2005 2006 2007 2008 2009 2010 2011 2012 2013 2014
Intermediate 0.0% 0.0% 0.0% 0.0% 0.0% 1.0% 0.0% 1.2% 0.0% 0.8% 2.7% 0.0% 0.5% 0.0% 1.0% 0.0% 0.0% 0.0% 0.0% 0.0% 0.0%
Resistant 0.0% 0.0% 0.0% 0.0% 0.0% 0.0% 0.8% 0.6% 0.0% 0.0% 0.0% 0.9% 0.0% 0.0% 1.0% 0.0% 0.0% 1.4% 1.9% 0.0% 0.0%
Levofloxacin
50%
40%
Percentage of Isoaltes
30%
20%
10%
0%
1994 1995 1996 1997 1998 1999 2000 2001 2002 2003 2004 2005 2006 2007 2008 2009 2010 2011 2012 2013 2014
Intermediate 0.0% 0.0% 0.0% 0.0% 0.0% 0.0% 0.0% 0.6% 0.0% 0.0% 0.0% 0.0% 0.0% 0.0% 0.0% 0.0% 0.0% 0.0% 0.0% 0.0% 0.0%
Resistant 0.0% 0.0% 0.0% 0.0% 0.0% 0.9% 0.8% 2.4% 0.8% 0.8% 2.7% 0.9% 0.5% 0.0% 2.0% 0.0% 0.0% 1.4% 1.9% 0.0% 0.0%
Figure 4- Proportion of Streptococcus pneumoniae isolates from BC hospitals non-susceptible to penicillin, TMP-SMX, clindamycin,
erythromycin, ceftriaxone, ciprofloxacin, tetracycline, moxifloxacin, and levofloxacin (1994-2014).
Source: CBSN
2014 AMR Trends Report 131.3. Streptococcus pyogenes
Streptococcus pyogenes, also known as β-hemolytic Group A Streptococci (GAS), typically presents as a
relatively mild, non-invasive throat infection (“Strep throat”), but can also cause more serious invasive infections
including necrotizing fasciitis and toxic shock syndrome (12). Recommended therapies for GAS infections include
penicillin, clindamycin, azithromycin, clarithromycin, and cephalexin (13). Erythromycin-resistant isolates of S.
pyogenes were first documented in the United Kingdom during the 1950s, consequently, erythromycin is no longer a
recommended empiric therapy following BC provincial guidelines.
Two main mechanisms of resistance against macrolides (e.g. azithromycin, clarithromycin, erythromycin) are
utilized by S. pyogenes. The first mechanism is the methylation of bacterial ribosome by a protein (encoded by erm),
which reduces the affinity of the antimicrobial drug for the ribosome (14). This is referred to as the MLSB phenotype
(14). Another mechanism contributing to the macrolide resistance involves an efflux pump specific for macrolides
coded by the mefA gene, which pumps macrolides out of the cell thus reducing the antimicrobial effect (14). The
presence of this efflux system in a macrolide resistant strain is referred to as the M phenotype (14).There are
variations in the types of M/emm in GAS (12). Until the mid 2000s, M1 was the most prevalent M type, however, from
2006-2009, Western Canada observed the emergence of M/emm 59 type GAS (12).
BC Biomedical Laboratories data include both invasive and non-invasive GAS isolates for all years available. All
isolates remain susceptible to penicillin, amoxicillin-clavulanate, and cephalothin as of 2014 (data not shown). The
percent of isolates non-susceptible to erythromycin had appeared to be decreasing from 2007 to 2010 but has since
increased peaking at 22.7% non-susceptibility in 2012 (pErythromycin
100%
80%
Percentage of Isolates
60%
40%
20%
0%
2007 2008 2009 2010 2011 2012 2013 2014
BC Biomed 12.8% 12.5% 9.8% 9.7% 14.7% 22.7% 18.4% 12.3%
Clindamycin
100%
80%
Percentage of Isolates
60%
40%
20%
0%
2007 2008 2009 2010 2011 2012 2013 2014
BC Biomed 12.9% 11.8% 9.4% 8.7% 11.9% 22.3% 17.9% 11.8%
Figure 5- Proportion of Streptococcus pyogenes isolates non-susceptible to erythromycin and with inducible clindamycin non-
susceptibility (as determined by the D-test in the presence of erythromycin) (2007-2014)
Source: BC Biomedical Laboratories
Please note: LifeLabs does not routinely test for susceptibility in GAS isolates; data was not included in the analysis for this report.
2014 AMR Trends Report 151.4. Enterococcus spp.
A prominent nosocomial pathogen, enterococci, specifically Enterococcus faecalis and Enterococcus faecium,
are normal enteric flora bacteria that may cause urinary tract infections (UTIs), intra-abdominal infections, and
bacteremia. Most enterococcus strains are intrinsically resistant to macrolides, lincosamides, TMP-SMX, and β-
lactams including cephalosporins and some penicillins (16).
Vancomycin-resistant Enterococci (VRE) typically present as nosocomial infections often affecting patients that
are immunocompromised, previously treated with antibiotics for an extensive period, have undergone surgical
procedures, and those with medical devices such as a urinary catheter (17). Transmission of VRE can occur by direct
person to person contact or contact with contaminated surfaces such as hands of care-givers during hospitalization
and toilet seats (17). The Public Health Agency of Canada collects data on VREs in acute-care hospitals through the
Canadian Nosocomial Infection Surveillance Program (CNISP) (17). The first case of VRE was reported in Canada in
the early 1990s, with the first outbreak of VRE occurring in an Ontario hospital in 1995 (18). Surveillance data
generated from CNISP shows that although the rate remains low, a significant increase in nosocomial VRE infections
since 2008 exists, mainly affecting the older population with previous hospitalization (17).
Resistance in Enterococcus spp. isolates to ampicillin shows an increasing trend during the period 2007 to 2014
and are reported to be at 3.2% (BC Biomedical, pAmpicillin
50%
40%
Percentage of Isolates
30%
20%
10%
0%
2007 2008 2009 2010 2011 2012 2013 2014
BC Biomed 1.1% 1.0% 1.7% 2.0% 2.4% 2.6% 3.0% 3.2%
LifeLabs- Island N/A 1.4% 1.1% 2.3% 1.9% 2.2% 2.3% 2.6%
LifeLabs- Mainland N/A 0.7% 1.1% 1.1% 1.7% 2.2% 2.5% 3.3%
Ciprofloxacin
50%
40%
Percentage of Isolates
30%
20%
10%
0%
2007 2008 2009 2010 2011 2012 2013 2014
BC Biomed 32.9% 28.1% 25.5% 25.1% 24.8% 25.4% 24.0% 22.3%
LifeLabs- Island N/A 28.9% 28.9% 22.4% 20.9% 23.0% 23.7% 24.0%
LifeLabs- Mainland N/A 27.1% 29.0% 26.9% 26.9% 28.5% 28.3% 27.1%
Nitrofurantoin
50%
40%
Percentage of Isolates
30%
20%
10%
0%
2007 2008 2009 2010 2011 2012 2013 2014
BC Biomed 0.7% 0.4% 1.3% 1.8% 1.7% 1.3% 0.7% 0.9%
Figure 6- Proportion of Enterococcus spp. isolates non-susceptible to vancomycin, ampicillin, nitrofurantoin, and ciprofloxacin
(2007-2014)
Source: BC Biomedical Laboratories and LifeLabs Medical Laboratory Services
Please note: LifeLabs data for resistance to cefotaxime was limited (data provided for 2008 and 2009 only); hence, data was not
included in the analysis. Also, due to differences in testing methodologies between BC Biomedical Laboratories and LifeLabs,
nitrofurantonin non-susceptibility results were limited to BC Biomedical Sciences data.
2014 AMR Trends Report 17100%
80%
Percentage of Isolates
60%
40%
20%
0%
90
2007 15.8% 13.3% 20.1% 17.6% 25.3% 30.4% 27.9% 37.0% 44.5% 67.4%
2008 10.3% 12.9% 12.8% 13.0% 16.3% 21.8% 19.2% 34.4% 44.9% 60.5%
2009 5.4% 12.0% 6.3% 8.8% 11.1% 17.1% 20.1% 30.0% 44.8% 53.7%
2010 7.9% 6.8% 5.9% 10.5% 14.5% 16.0% 23.4% 23.7% 39.5% 54.6%
2011 5.8% 8.5% 7.8% 8.3% 10.8% 18.0% 22.8% 29.8% 39.4% 53.2%
2012 2.7% 4.1% 12.2% 10.7% 10.6% 14.0% 16.9% 29.0% 43.4% 54.1%
2013 7.3% 0.0% 3.3% 3.5% 14.4% 11.0% 17.7% 26.3% 40.5% 57.1%
2014 3.3% 3.2% 8.1% 5.9% 6.0% 10.2% 18.2% 26.7% 39.9% 49.7%
Figure 7 - Proportion of Enterococcus spp. urinary isolates non-susceptible to ciprofloxacin by age of patient (2007-2014)
Source: BC Biomedical Laboratories
2014 AMR Trends Report 18Gram-negative Organisms
1.5. Escherichia coli
Escherichia coli typically exist as a commensal bacteria colonizing the gastrointestinal tract of human, rarely
causing disease other than in immunocompromised individuals or when the barriers between gastrointestinal
epithelial cells is disrupted (20). However, there now exists several strains of E.coli that have acquired specific
virulence factors that allow them to colonize new niches causing a variety of disease including enteric/diarrhoeal
disease, urinary tract infections (approximately 85-90%), and sepsis/meningitis (21;20). A wide genetic diversity
exists in pathogenic E.coli due to the possession of a variety of specialized virulence genes encoded on pathogenicity
islands (mobile genetic elements) which is acquired via HGT (22;20). Antibiotic therapy for E. coli varies depending
on the infection; however, therapy generally includes fluoroquinolones, trimethoprim/sulfamethoxazole, and
cephalosporins, for which resistance is rapidly rising (20).
According to Biomedical data, the proportion of E. coli isolates non-susceptible to ampicillin, ciprofloxacin, and
gentamicin significantly increased between the years 2007 and 2014 (ampicillin: pCefotaxime
100%
80%
Percentage of Isolates 60%
40%
20%
0%
2007 2008 2009 2010 2011 2012 2013 2014
BC Biomed 11.5% 10.6% 9.1% 10.4% 10.4% 10.0% 10.4% 11.2%
Ciprofloxacin
100%
80%
Percentage of Isolates
60%
40%
20%
0%
2007 2008 2009 2010 2011 2012 2013 2014
BC Biomed 21.8% 22.5% 22.3% 25.7% 26.8% 25.3% 24.9% 23.8%
LifeLabs- Island N/A 17.8% 16.8% 16.7% 16.9% 15.9% 16.0% 16.2%
LifeLabs- Mainland N/A 19.4% 19.0% 21.0% 21.4% 21.7% 21.5% 21.1%
Nitrofurantoin
100%
80%
Percentage of Isolates
60%
40%
20%
0%
2007 2008 2009 2010 2011 2012 2013 2014
BC Biomed 3.1% 3.1% 3.9% 4.3% 3.8% 2.9% 2.5% 2.1%
2014 AMR Trends Report 20TMP-SMX
100%
80%
Percentage of Isolates
60%
40%
20%
0%
2007 2008 2009 2010 2011 2012 2013 2014
BC Biomed 25.2% 26.3% 25.3% 26.5% 26.0% 25.6% 25.2% 24.0%
LifeLabs- Island N/A 19.2% 18.8% 18.9% 19.6% 20.0% 20.4% 19.2%
LifeLabs- Mainland N/A 23.5% 23.4% 24.1% 23.9% 24.0% 23.4% 22.9%
Gentamicin
100%
80%
Percentage of Isolates
60%
40%
20%
0%
2007 2008 2009 2010 2011 2012 2013 2014
BC Biomed 8.1% 8.2% 7.2% 8.4% 8.6% 8.3% 8.4% 9.1%
LifeLabs- Island N/A 5.5% 4.7% 4.9% 5.4% 5.6% 5.7% 6.6%
LifeLabs- Mainland N/A 7.9% 7.8% 7.5% 8.3% 8.2% 8.5% 8.9%
Figure 8- Proportion of Escherichia coli isolates non-susceptible to ampicillin, cefotaxime, ciprofloxacin, nitrofurantoin, TMP-SMX
and gentamicin (2007-2014).
Source: BC Biomedical Laboratories and LifeLabs Medical Laboratory Services
Please note: LifeLabs data for resistance to cefotaxime was limited (data provided for 2008 and 2009 only); hence, data was not
included in the analysis. Also, due to differences in testing methodologies between BC Biomedical Laboratories and LifeLabs,
nitrofurantonin non-susceptibility results were limited to BC Biomedical Sciences data.
2014 AMR Trends Report 21100%
90%
Percentage of Isolates 80%
70%
60%
50%
40%
30%
20%
10%
0%
00-09 10-19 20-29 30-39 40-49 50-59 60-69 70-79 80-89 90+
2007 7.1% 5.8% 9.6% 12.5% 12.2% 18.8% 24.0% 32.3% 39.7% 50.8%
2008 8.20% 6.2% 10.4% 11.7% 12.5% 19.6% 26.7% 32.0% 41.6% 47.7%
2009 10.2% 5.2% 10.4% 10.5% 13.6% 18.4% 25.3% 30.5% 41.8% 49.4%
2010 12.0% 7.1% 11.4% 12.5% 14.5% 21.1% 28.8% 36.7% 45.4% 53.9%
2011 11.6% 7.5% 11.4% 13.6% 14.7% 21.6% 28.9% 38.5% 47.4% 55.7%
2012 11.1% 5.9% 11.4% 12.3% 14.9% 19.1% 26.5% 34.9% 45.4% 54.5%
2013 10.8% 6.4% 9.3% 13.4% 12.7% 19.1% 26.9% 35.2% 44.0% 54.6%
2014 13.2% 6.6% 10.6% 13.3% 14.4% 19.1% 26.5% 32.5% 39.9% 49.2%
Figure 9- Proportion of Escherichia coli urinary isolates non-susceptible to ciprofloxacin by age of patient (2007-2014)
Source: BC Biomedical Laboratories
2014 AMR Trends Report 221.6. Klebsiella pneumonia
Klebsiella pneumoniae is a gram-negative bacteria commonly found in both the environment (soil, water … etc)
and on the mucosal surface of mammals including humans. Although K. pneumonia is widely known to be the cause
of community-acquired pneumonia, the vast majority occurs as nosocomial infections, presenting primarily as an
opportunistic infection targeting patients that are immunocompromised during hospitalization. Studies have shown
that the degree of K. pneumoniae colonization is found to be directly proportional to the length of hospitalization, and
the nosocomial colonization is significantly associated with the use of antibiotics (particularly multiple antibiotics or
use of broad-spectrum antibiotics) rather than factors associated with delivery of care during hospitalization (24). The
urinary tract is a common site of infection in K. pneumoniae, contributing to 6-17% of all nosocomial UTI cases
Moreover, K. pneumoniae is also a cause of Gram-negative bacteraemia, second only to E. coli, and is the most
frequently identified carbapenemase-producing Enterobacteriaceae (please refer to section 1.8 for more information
on carbapenemase-producing organisms) (24).
BC Biomedical data show an increasing trend in non-susceptibility rates in K. pneumonia isolates to
ciprofloxacin, yet the rate remains low and is reported to be 5.2% in 2014 (pGentamicin
100%
80%
Percentage of Isolates
60%
40%
20%
0%
2007 2008 2009 2010 2011 2012 2013 2014
BC Biomed 1.2% 0.9% 1.6% 1.2% 1.5% 1.4% 1.6% 2.6%
LifeLabs- Island N/A 0.6% 0.7% 0.9% 2.0% 1.9% 2.6% 2.0%
LifeLabs- Mainland N/A 0.9% 0.9% 1.1% 1.5% 1.5% 1.3% 2.7%
Nitrofurantoin
100%
80%
Percentage of Isolates
60%
40%
20%
0%
2007 2008
N/A 2009 2010 2011 2012 2013 2014
BC Biomed 67.7% 63.6%
N/A 58.7% 51.8% 50.2% 39.4% 43.5% 42.7%
TMP-SMX
80%
60%
Percentage of Isolates
40%
20%
0%
2007 2008 2009 2010 2011 2012 2013 2014
BC Biomed 10.8% 12.0% 10.7% 8.1% 8.5% 8.3% 7.8% 10.1%
LifeLabs- Island N/A 4.8% 6.4% 6.7% 7.4% 6.8% 5.1% 6.6%
LifeLabs- Mainland N/A 6.5% 6.5% 5.7% 6.7% 7.0% 8.2% 8.6%
Figure 10- Proportion of Klebsiella pneumoniae isolates non-susceptible to ciprofloxacin, gentamicin, nitrofurantoin, and TMP-SMX
(2007-2014)
Source: BC Biomedical Laboratories and LifeLabs Medical Laboratory Services
Please note: Due to differences in testing methodologies between BC Biomedical Laboratories and LifeLabs, nitrofurantonin non-
susceptibility results were limited to BC Biomedical Sciences data.
2014 AMR Trends Report 241.7. Proteus mirabilis
Proteus mirabilis is an enteric bacterium that causes approximately 2% of UTIs (21). In the past, TMP-SMX was
the first-line treatment for UTIs; however, use of fluoroquinolones (e.g. ciprofloxacin) and aminoglycosides (e.g.
gentamicin) has become more common over the years (13;25). In Canada, the percent of P. mirabilis isolates
producing ESBLs is considerably less than other countries (26).
According to BC Biomedical data, the percent of isolates non-susceptible to ampicillin has remained relatively
stable since 2007 and is reported at 30.7% in 2014 (ampicillin: p=0.17) (Figure 11). The rate of P. mirabilis isolates
resistant to gentamicin has been relatively stable with slight increase from 5.6% in 2007 to 7.4% in 2014 (pCiprofloxacin
100%
80%
Percentage of Isolates
60%
40%
20%
0%
2007 2008 2009 2010 2011 2012 2013 2014
BC Biomed Resistant BC Biomed Intermediate
LifeLabs- Island Resistant LifeLabs- Island Intermediate
LifeLabs- Mainland Resistant LifeLabs- Mainland Intermediate
Year
Data Source Susceptibility 2007 2008 2009 2010 2011 2012 2013 2014
a
I 0.1% 0.1% 0.1% 0.1% 0.0% 0.4% 0.1% 0.0%
BC Biomed b
R 21.2% 23.4% 19.5% 14.6% 19.8% 20.1% 19.8% 17.8%
I N/A 4.4% 3.4% 2.9% 5.1% 4.4% 2.4% 2.9%
LifeLabs- Island
R N/A 3.4% 3.0% 4.7% 3.1% 1.4% 2.4% 4.1%
I N/A 8.8% 7.3% 7.2% 8.5% 10.0% 9.3% 9.3%
LifeLabs- Mainland
R N/A 8.5% 7.6% 10.1% 11.1% 12.6% 12.8% 12.7%
Gentamicin
100%
80%
Percentage of Isolates
60%
40%
20%
0%
2007 2008 2009 2010 2011 2012 2013 2014
BC Biomed 5.6% 4.9% 6.0% 5.2% 5.5% 5.4% 6.2% 7.4%
LifeLabs- Island N/A 4.0% 6.2% 5.2% 5.7% 5.5% 3.7% 5.9%
LifeLabs- Mainland N/A 6.0% 5.9% 6.0% 6.2% 6.0% 6.1% 5.8%
2014 AMR Trends Report 26Ampicillin
100%
80%
Percentage of Isolates
60%
40%
20%
0%
2007 2008 2009 2010 2011 2012 2013 2014
BC Biomed 32.7% 33.5% 32.9% 31.5% 31.4% 32.5% 32.4% 30.7%
LifeLabs- Island N/A 15.8% 15.7% 22.3% 21.3% 16.3% 18.7% 16.8%
LifeLabs- Mainland N/A 27.5% 23.6% 27.5% 28.4% 27.2% 27.8% 26.2%
Figure 11- Proportion of Proteus mirabilis isolates non-susceptible to ciprofloxacin, TMP-SMX, gentamicin, and ampicillin (2007-
2014)
Source: BC Biomedical Laboratories and LifeLabs Medical Laboratory Services
a
I= Isolates classified as having intermediate resistance based on MIC breakpoints and CLSI guidelines
b
R= Isolates classified as resistant based on MIC breakpoints and CLSI guidelines
2014 AMR Trends Report 271.8. Serratia, Providencia, Morganella, Citrobacter, and Enterobacter spp.
Serratia spp., Providencia spp., Morganella spp., Citrobacter spp., and Enterobacter spp. are collectively referred
to as the SPICE organisms or ‘ESCPM’ group (27). Most SPICE organisms are opportunistic nosocomial pathogens
that commonly cause urinary tract or respiratory infections and have the ability to produce inducible β-lactamases
(28;29). The percent of SPICE organism isolates non-susceptible to the tested antimicrobials have remained
relatively low during the testing period from 2007 to 2014 (i.e., less than 11%), with the exception of nitrofurantoin
(Figure 12). Non-susceptibility to nitrofurantoin remains high across all years since 2008 and was reported to be at
66.0% on the Island and 72.3% on the Mainland in 2014 (Figure 12). SPICE organisms remain highly susceptible to
ciprofloxacin and gentamicin with less than 7% of isolates exhibiting non-susceptibility (Figure 12).
Ciprofloxacin
100%
80%
Percentage of Isolates
60%
40%
20%
0%
2008 2009 2010 2011 2012 2013 2014
LifeLabs- Island 3.6% 3.6% 3.7% 3.3% 2.9% 3.9% 4.1%
LifeLabs- Mainland 5.7% 5.4% 5.9% 6.6% 6.3% 6.2% 6.3%
Gentamicin
100%
80%
Percentage of Isolates
60%
40%
20%
0%
2008 2009 2010 2011 2012 2013 2014
LifeLabs- Island 2.0% 3.6% 3.5% 3.4% 3.8% 6.5% 6.5%
LifeLabs- Mainland 4.3% 3.3% 3.8% 3.5% 4.7% 4.3% 3.8%
2014 AMR Trends Report 28Nitrofurantoin
80%
70%
60%
Percentage of Isolates
50%
40%
30%
20%
10%
0%
2008 2009 2010 2011 2012 2013 2014
LifeLabs- Island Resistant LifeLabs- Island Intermediate
LifeLabs- Mainland Resistant LifeLabs- Mainland Intermediate
Year
Data Source Susceptibility 2008 2009 2010 2011 2012 2013 2014
a
I 29.7% 26.6% 23.8% 27.7% 32.0% 30.7% 30.4%
LifeLabs- Island
Rb 35.0% 37.4% 42.1% 31.5% 31.9% 32.8% 35.7%
I 22.3% 27.8% 26.4% 28.1% 33.2% 29.8% 31.6%
LifeLabs- Mainland
R 38.7% 42.4% 39.0% 36.6% 37.6% 37.9% 40.7%
TMP-SMX
100%
80%
Percentage of Isolates
60%
40%
20%
0%
2008 2009 2010 2011 2012 2013 2014
LifeLabs- Island 5.3% 9.7% 8.0% 6.4% 6.9% 7.6% 10.2%
LifeLabs- Mainland 8.7% 7.3% 8.9% 8.9% 9.2% 9.6% 8.7%
Figure 12- Proportion of SPICE (Serratia spp., Providencia spp., Morganella spp., Citrobacter spp., and Enterobacter spp.) isolates
non-susceptible to ciprofloxacin, nitrofurantoin, gentamicin, and TMP-SMX (2008-2014)
Source: LifeLabs Medical Laboratory Services
a
I= Isolates classified as having intermediate resistance based on MIC breakpoints and CLSI guidelines
b
R= Isolates classified as resistant based on MIC breakpoints and CLSI guidelines
2014 AMR Trends Report 291.9. Extended spectrum β-lactamase producing Enterobacteriaceae
Extended spectrum β-lactamases (ESBLs) are enzymes often associated with bacteria within the
Enterobacteriaceae family that hydrolyze antibiotics belonging to the penicillin and cephalosporin classes (30).
Laboratories detect the presence of ESBLs by evaluating the organism’s phenotypic resistance patterns to different
antibiotics (31). An ESBL-producing organism must demonstrate resistance to a third generation cephalosporin (e.g.
cefotaxime, ceftriaxone or ceftazidime) but not cephamycins (e.g. cefoxitin) or carbapenems (e.g. imipenem,
meropenem or ertapenem) (31). In addition, it must also demonstrate a change in susceptibility to third generation
cephalosporin in the presence of a β-lactamase inhibitor (e.g. clavulanic acid, tazobactam or sulbactam) (31).
ESBL-producing organisms were first described in 1983, and have since been a major cause of hospital-
acquired infections. Although a variety of bacteria have been found to produce ESBLs, they are most often identified
in Klebsiella pneumonia and Escherichia coli (32). Genes encoding ESBL are usually located on large plasmids
containing resistance genes to many other antibiotics such as aminoglycosides, trimethoprim, sulphonamides,
tetracycline, and chloramphenicol; thus, accumulation of multiple resistance genes due to the plasmid-mediated
transmission of ESBL genes result in strains that are multi-resistant to a variety of antibiotics limiting the choice of
effective therapy (32). In Canada, the first case of ESBL-producing E.coli strains occurred in Ontario in 2000 (33).
The CLSI does not recommend confirming ESBLs and consequently, BC Biomedical Laboratories does not
directly confirm potential ESBL isolates. BC Biomedical Laboratories refers to isolates exhibiting cephalosporin
resistance as broad-spectrum beta-lactamase producers. Consequently, data from BC Biomedical Laboratories were
used to estimate extended spectrum β-lactamase-like (ESBL-like) producers, determined through resistance to third
generation cephalosporins (e.g. ceftriaxone, cefotaxime, ceftazidime, or cefixime). This method is likely to
overestimate the proportion of isolates that are ESBL-like producers. Although data from BC Biomedical Laboratories
would represent an overestimation of true ESBL numbers, the data are still useful as they will include all possible
ESBL-producing E. coli, K. pneumonia, and P. mirabilis isolates. Thus, it is still meaningful to represent the data in
this report in order to use this denominator to identify multi-drug resistance patterns associated with E. coli, K.
pneumonia, and P. mirabilis isolates with phenotype compatible with ESBLs, and to monitor for any changing trends.
In BC, laboratory testing for ESBL-producing E. coli and K. pneumoniae is done routinely by phenotypic
methods. BCAMM reports estimates of ESBL-producing E. coli and K. pneumoniae observed in all community
laboratories, and 23 health organizations’ hospital laboratories across BC (34). The results are presented for both
community and hospital settings, in order to reflect the potential differences in prevalence within the respective
settings.
Data from BC Biomedical Laboratories suggest that the majority of ESBL-like isolates were E. coli, while K.
pneumoniae and P. mirabilis made up similar but substantially lower proportions of all ESBL-like isolates in 2014
(Figure 14). Approximately 13.1% of E. coli isolates exhibit an ESBL-like phenotype, a rate which has graduallhy
increased over the past six years (p=0.01) (Figure 14). The percent of K. pneumonia and P. mirabilis isolates
demonstrating an ESBL-like phenotype decreased significantly from 8.5% in 2007 to 4.2% and from 12.5% to 4.9% in
2014 respectively (K. pneumonia: p=0.037 and P. mirabilis: pYou can also read


