Aortic Stenosis - Tier 2 Overview - Ministry of Health
←
→
Page content transcription
If your browser does not render page correctly, please read the page content below
Aortic Stenosis –

                            Tier 2 Overview

Aortic Stenosis – Tier 2 Overview             1
National Health Committee (NHC) The National Health Committee (NHC) is an independent statutory body charged with prioritising new and existing health technologies and making recommendations to the Minister of Health. It was re-formed in 2011 to establish evaluation systems that would provide the New Zealand people and the health sector with greater value for money invested in health. The NHC executive is the secretariat that supports the committee. The NHC executive’s primary objective is to provide the committee with sufficient information for it to make decisions regarding prioritisation and reprioritisation of interventions and services. They do this through a range of evidence-based products chosen according to the nature of the decision required and timeframe within which decisions need to be made. The New Zealand Government has asked that all new diagnostic and treatment (non-pharmaceutical) services, and significant expansions of existing services, are to be referred to the NHC. In August 2011 the NHC was appointed with new terms of reference and a mandate to establish the capacity to assess new and existing health technologies. Its objectives (under Section 4.2 of its terms of reference – www.nhc.health.govt.nz) include contributing to improved value for money and fiscal sustainability in the health and disability sector by: • providing timely advice and recommendations about relative cost-effectiveness based on the best available evidence; • providing advice and recommendations which influence the behaviour of decision-makers, including clinicians and other health professionals; • providing advice and recommendations which are reflected in resource allocation at national, regional and local levels; and • contributing to tangible reductions in the use of ineffective interventions and improved targeting to those most likely to benefit. In order to achieve its objectives under Section 4.2 and to achieve ‘value for money’, the NHC has adopted a framework of four assessment domains – clinical safety and effectiveness; economic; societal and ethical; and feasibility of adoption – in order that assessments cover the range of potential considerations and that the recommendations made are reasonable. It is intended that the research questions asked will fall across these domains to ensure that when the committee comes to apply its decision-making criteria, it has a balanced range of information available to it. When the NHC is setting those questions, they will have the decision-making criteria in mind. The 11 decision-making criteria will assist in the determination of the NHC work programme and in the appraisal and prioritisation of assessments. Aortic Stenosis – Tier 2 Overview 2
Executive summary
Aortic stenosis (AS) is responsible for the deaths of about 300 New Zealanders a year. The primary
cause of AS is ageing, where calcium deposits build up in the aortic valve, narrowing it over time.
Calcification of the valve happens more frequently in people who are born with abnormal aortic
valves. Unlike other heart conditions, there are very few preventative strategies for AS. Patients face
a poor prognosis once the disease becomes clinically evident, either with the onset of symptoms or
with deterioration in left ventricular function. The life expectancy of patients with clinically evident AS
without intervention is two to three years, with sudden death occurring in up to a third of these
patients.

For clinically evident AS, the standard of care is surgical aortic valve replacement, which is a highly
effective intervention that can return patient quality of life and life expectancy to normal. Today, about
$30 million is spent annually on aortic valve replacement (AVR) operations for patients with aortic
stenosis. Assuming today’s cost for AVR, public expenditure is expected to increase to about $40
million per annum by 2025/26.

The past decade has seen a significant increase in the number of AVR operations undertaken and a
technology shift away from mechanical valves, towards bioprosthetic valves and less invasive
surgery. At the same time, mortality from AS has declined significantly, from about four deaths per
100,000 New Zealanders in 2000 to about three deaths per 100,000 New Zealanders in 2011. As part
of a global trend, two AVR technologies have emerged in New Zealand since 2008. These are
transcatheter aortic valve implantation (TAVI) and sutureless AVR. Whilst the technologies hold
promise for high-risk surgical patients, it is important that they are properly assessed to ensure their
appropriate use.
AVR is an exceptionally effective intervention for many patients. It is important, however, that new
forms of AVR, namely TAVI and sutureless AVR, are used appropriately to continue to improve
patient outcomes in the context of prudent use of available public funding. The main conclusion of this
Tier 2 assessment, therefore, is that TAVI and sutureless AVR are assessed and that New Zealand
relevant data be collected to guide their appropriate use.

Aortic Stenosis – Tier 2 Overview                                                                             3
Purpose
This report synthesises current evidence about the use of transcatheter aortic valve implantation
(TAVI) for the treatment of severe aortic stenosis (AS) in New Zealand. Its purpose is to enable the
National Health Committee to make recommendations on the role and value of TAVI in the model of
care for severe aortic stenosis that ensure that the New Zealand public get the highest quality care,
and that as a nation, we can afford that care.

Aortic Stenosis – Tier 2 Overview                                                                       4
Aortic Stenosis – Tier 2 Overview 5
Contents

Executive summary..............................................................................................................................3
Purpose ...............................................................................................................................................4
Introduction ..........................................................................................................................................7
Causes of aortic stenosis .....................................................................................................................8
Burden of disease ................................................................................................................................8
Aortic stenosis comorbidities ..............................................................................................................13
Treatment for aortic stenosis ..............................................................................................................15
Indications for aortic valve replacement .............................................................................................16
Trends in aortic valve replacement ....................................................................................................18
Transcatheter aortic valve implantation ..............................................................................................20
Sutureless aortic valve replacement ..................................................................................................21
Minimally invasive aortic valve replacement surgery ..........................................................................21
Risk stratification ................................................................................................................................22
Forecast aortic valve replacement demand and expenditure .............................................................30
Model of care for severe aortic stenosis .............................................................................................31
Conclusion .........................................................................................................................................37
References ........................................................................................................................................39
Appendix 1: Projected expenditure on publicly funded AVR by region ..............................................43
Methods .............................................................................................................................................44

Aortic Stenosis – Tier 2 Overview                                                                                                                     6
Introduction
The aorta is the main artery that carries blood out of the heart to the rest of the body. Stenosis means
narrowing. In aortic stenosis (AS), the aortic valve is narrowed to the point that it does not open fully,
decreasing blood flow from the heart. In the early stages of the disease, people with AS may be
asymptomatic without any increased risk of death (1) or detriment to quality of life.(2) Symptoms of AS
include angina (chest pain), breathlessness when exercising, fatigue, heart palpitations, and syncope
(fainting).(3) Patients face a poor prognosis once the disease becomes clinically evident, either with
the onset of symptoms or with deterioration in left ventricular function. Left untreated, clinically evident
AS can lead to heart failure and sudden death. The life expectancy of patients with clinically evident
AS without intervention is two to three years, with sudden death occurring in up to a third of patients.(4,
5)

This Tier 2 assessment paper sits within the National Health Committee's (NHC’s) cardiovascular
disease (CVD) work programme.(6) In New Zealand valvular disease is the third-largest burden of
disease within CVD after ischaemic heart disease and stroke (Figure 1). The NHC has a concurrent
work stream for ischaemic heart disease (IHD), and has produced a similar Tier 2 assessment paper
for IHD.(7) With respect to stroke, the NHC has undertaken two Tier 3 assessments on interventions
for atrial fibrillation: catheter cardiac ablation, (8) and percutaneous left atrial appendage occlusion.(9)

Figure 1: Disability adjusted life years lost attributed to CVD 2010

                                         Other Causes
                Valvular Heart               16%
                   Disease
                     4%

                                                                       IHD
                                    Stroke                             56%
                                     24%

                     (10)
Source: NZBDS 2013

This paper gives background to the burden of AS in New Zealand, including its prevalence, incidence
and treatment. It outlines trends in AVR including the emergence of TAVI and sutureless AVR, and
estimates current and future expenditure on all AVR.

Aortic Stenosis – Tier 2 Overview                                                                              7
Causes of aortic stenosis Severe AS has been defined as a peak aortic valve velocity of >4 m per second, corresponding to a mean aortic valve gradient >40 mm Hg, and an aortic valve area of < 0.8 cm2.(11, 12) There is also a small group of patients that may benefit from aortic valve replacement who have asymptomatic AS, but have left ventricular dysfunction, with a left ventricular ejection fraction of less than 50%. About 5- 10% of patients with severe AS have LV dysfunction (LVEF
More than 80% of deaths were for people aged 80 years or older. Just two of these deaths were for
people diagnosed with rheumatic AS. Māori have a lower rate of AS mortality than non-Māori, with an
age standardised rate of 1.3 per 100,000 population compared with an age standardised rate (ASR)
of 3.1 for non-Māori (Table 1).

Table 1: Crude and age standardised aortic stenosis mortality 2011

                  Rheumatic aortic            Non-rheumatic        Total aortic stenosis
                  stenosis                    aortic stenosis

                  Deaths                      Deaths               Deaths          Crude rate          ASR per
                                                                                   per 100,000         100,000
                                                                                   population          population

Total             2                           293                  295             6.7                 3.0

Māori             0                           4                    4               0.6                 1.3

Non-Māori         2                           289                  291             7.8                 3.1

Source: National Mortality Collections 2011, using ICD procedure codes I060, I062: Rheumatic AS, I350,I352: Non-
rheumatic AS. ASR = Age standardised rate which is standardised to WHO standard world population.

1.1      Prevalence and incidence of aortic stenosis

In the absence of published data, we have used the New Zealand National Minimum Dataset
(NMDS) 1 to estimate the prevalence of publicly-funded hospital diagnosed AS. Through the NMDS,
we identified people with any diagnosis of AS (either rheumatic or non-rheumatic) between July 2005
and June 2013. 2(18) Methods are described in detail from page 44. In brief, patients with any
diagnosis of AS were identified and counted if they were still alive at 30 June 2012/13 and had not
been recorded as having received an aortic valve replacement. Incidence was recorded as the
number of new diagnoses of AS during the financial year 2012/13.

In 2012/13, the prevalence of any hospital diagnoses of AS was 103 per 100,000 population or
approximately 4,700 patients (Table 2). Of these patients, 48 were recorded as having rheumatic AS.
Patients were recorded as having AS if they were still living in 2012/13 and had received any
diagnosis of AS since 2005/06. Incidence was 36 cases per 100,000 population, counting any patient
who received a publicly funded hospital diagnosis of AS in 2012/13. Both incidence and prevalence
estimates are likely to undercount the true population affected by aortic stenosis. Some patients may
only receive a primary care diagnosis of AS whilst others may be left undiagnosed (particularly
asymptomatic cases).

1
    The NMDS records all publicly funded inpatient and day case events.
2
    All patients were alive and diagnosed in hospital. Due to coding changes, data on aortic stenosis specifically are only
      available since 2000 in the NMDS.

Aortic Stenosis – Tier 2 Overview                                                                                             9
Table 2: Prevalence and incidence of any hospital diagnosis of aortic stenosis 2012/13
0-49 50-69 70+ Total
Population 3,088,446 1,019,153 423,432 4,531,031
Incidence 53 294 1,264 1,611
Incidence rate per 100,000 2 29 299 36
Prevalence 177 708 3,790 4,675
Prevalence rate per 100,000 6 68 865 103
Rheumatic fever AS
prevalence 13 12 23 48
Prevalence rate for AS
rheumatic fever per 100,000 0 1 5 1
Source: NHC analysis of NMDS
1.1.1 Prevalence and incidence of severe aortic stenosis
Just over a third of all patients with a hospital diagnosis of AS in 2012/13 had a primary diagnosis of
aortic stenosis. A primary hospital diagnosis is likely to represent a more severe population. The
prevalence of severe AS is estimated at 38 per 100,000 population or approximately 1,703 patients.
Of these patients, 23 were recorded as having rheumatic aortic stenosis. Prevalence is roughly twice
incidence. Incidence was 19 cases per 100,000 population, ranging from one patient per 100,000
population for those under 50, to 145 per 100,000 population for those aged over 70. There were 860
new cases of severe AS in 2012/13 (Table 3).
Table 3: Prevalence and incidence of a primary hospital diagnosis of aortic stenosis 2012/13
0-49 50-69 70+ Total
Population 3,088,446 1,019,153 423,432 4,531,031
Incidence 34 213 613 860
Incidence rate per 100,000 1 21 145 19
Prevalence 91 345 1,267 1,703
Prevalence rate per 100,000 3 33 289 38
Rheumatic fever AS prevalence 6 7 10 23
Prevalence rate per 100,000 0 1 2 1
Source: NHC analysis of NMDS
1.1.2 Incidence of asymptomatic severe aortic stenosis with left ventricular dysfunction
American Heart Association/American College of Cardiology guidelines indicate that aortic valve
replacement may be indicated in both patients with severe symptomatic AS, and patients with severe
asymptomatic AS with LV dysfunction (LVEF1.1.3 International estimates of severe symptomatic aortic stenosis prevalence
Two large prospective general population based studies have used echocardiography to assess the
population prevalence of aortic stenosis. A US study (n=11,911) pooled the records of three large US
population based epidemiological studies.(20) It reported population prevalence for moderate or
severe AS of 0.4% in adults aged 18 years or older, with a prevalence of 1.8% in those aged 65 or
older. A Norwegian study (n=3,273) reported rates of aortic stenosis increasing from 3.9 % in those
aged 70-79 to 9.8% in those aged 80-89.(18) Approximately two-thirds of the 164 cases of AS were
mild or moderate. Thirty-four of the identified patients underwent AVR, with an additional 26 cases
identified as severe AS and not treated with AVR. Applying New Zealand population weights, and
assuming 75% of severe cases are also symptomatic,(19) the data implies that a little less than 2% of
patients aged between 50-89 had severe symptomatic AS (Table 4).
Table 4 : Estimation of severe aortic stenosis population using Norwegian data
70-79 80-89 Sum
Estimate of AS population 3.90% 9.80%
NZ population 268,518 132,593 401,111
AS patients 10472 12994 23466
Symptomatic severe AS* 32.6% 3416 4239 7655
1.9%
(18)
Source: Statistics NZ population for 2012/13. * We assume all patients who received AVR were symptomatic severe and
75% of severe cases were symptomatic.
We would expect to derive a lower estimate of the prevalence of AS compared with an active strategy
of surveying the general population using echocardiography. Our estimate, using hospital records
alone, is however, useful in understanding demand as it presents at hospital. Table 5 places our New
Zealand estimate of severe symptomatic AS, which counts cases of primary diagnosed AS, alongside
estimates recorded in a systematic review, where all studies used echocardiography to assess
population prevalence. As is evidenced, rates vary significantly across studies. The studies
considered are all cross-sectional in nature and use differing ages for inclusion. Differences in
estimates of prevalence between the studies may be partly explained by methodological differences;
recruitment, response rates, and criteria used to define severe AS.
The methods of recruitment make some studies more prone to selection bias than others. Lindroos
used random selection from a population register; Van Bemmel recruited from all inhabitants in a
district; and Vaes selected patients from general practice registers. These may be expected to
provide a representative sample of the general population. In contrast Nkomo selected patients who
were undergoing echocardiography, presumably after presenting to health services; while Lin
sampled individuals presenting for health checks. Nkomo is likely to over-estimate prevalence as the
individuals are likely to be less healthy, having presented at health service. The Lin method may
inflate or deflate the estimate: whether individuals present to check-ups because they are prompted
by a health concern or because more healthy individuals tend to use preventative services more than
unhealthy ones.
Aortic Stenosis – Tier 2 Overview 11The response rate is unclear for Lin, and Vaes, and at least 71% in the other studies. All the studies
used doppler echocardiography to assess the aortic valves. The criteria used to define an individual
as a case of severe AS vary between studies. Lin used the sole criterion of pressure gradient cross
the valve with a cut-off of >50mmHh. This value is more strict than the standard definition of
>40mmHg, so tending to under-estimate prevalence. Van Bemmel used a single criterion of pressure
gradient with the same cut-off value standard definition. Lindroos and Nkomo use two criteria for
valvular area but are less strict than the standard definitions and so would tend to over-estimate
prevalence of severe AS.
The largest of these studies is a cross-sectional study of Olmsted County Minnesota in the United
States.(20) The study is a sub-study of the aforementioned US study of 11,911 patients. Again, we
have assumed that 75% of severe AS cases are symptomatic.(19)
Table 5: Estimation of severe symptomatic aortic stenosis in those aged 70 or older
(22) (24)
Year/author 1993 2005 (Lin) 2006 2010 (Van 2012 (Vaes) 2012/13
(21) (20) (23)
(Lindroos) (Nkomo) Bemmel)
Country Finland Taiwan USA Netherlands Belgium NZ
Cases/ 18/476 5/82 87/6663 1/81 33/556 1,703/26984
sample 0
% (95% CI) 3.78 6.10 1.31 1.23 5.94
(2.26,5.91) (2.01,13.66) (1.05,1.61) (0.03, 6.99) (4.12, 8.23)
Severe 2.86% 4.61% 0.99% 0.93% 4.49% 0.24%
symptomatic
(19)
Source:
1.1.4 Projected incidence of severe aortic stenosis
As incidence of AS is greatest in older age groups, population ageing can be expected to increase the
incidence of AS. A straight line extrapolation of current AS incidence using Statistics New Zealand
population forecasts indicates that there will be approximately 1,300 admissions with a primary
diagnoses of AS by 2025/26.
The northern region is expected to see the greatest growth in AS at 3.7% per annum, while the
central region is expected to see the lowest growth at 2.7% per annum (Figure 3).
Aortic Stenosis – Tier 2 Overview 12Figure 3: Forecast incidence of severe aortic stenosis
500
450
400
350
300
Central
250
Midland
200
Northern
150
Southern
100
50
0
Note: A table of the above data is available in appendix one
Source: NHC analysis of NMDS, using annual population projections supplied by Statistics NZ
Aortic stenosis comorbidities
The majority (85%) of patients with severe AS in 2012/13 were suffering from at least one of nine
comorbid conditions, and over a quarter (27%) had at least three of these conditions. Figure 4
presents the proportions of AS patients experiencing the conditions analysed. These patients are a lot
more likely to have ischaemic heart disease and heart failure than a similarly aged group of people
(the 65+ years group has a mean age 76).
Aortic Stenosis – Tier 2 Overview 13Figure 4: Percentage of people with selected long-term conditions, patients with severe aortic stenosis and a
comparator group, 2012/13
Percent
80
Severe AS patients
70
People without Severe AS who
are 65+ years
60
50
40
30
20
10
0
Ischaemic Diabetes Chronic Gout Stroke Heart failure Mood or Dementia Any cancer
heart disease obstructive anxiety
pulmonary disorder
disease
Condition
Note: Patients can have more than one of these selected conditions. The blue bars are the percentage of severe AS patients
of all ages who have each of these conditions. The red bars are the percentage of a comparator group of people aged 65+
years who do not have severe AS who have each of these conditions.
Source: 2015 NHC executive analysis of 2012/13 NZ Health Tracker data
To adjust for age more systematically, a logistic regression was carried out (Table 6). This confirmed
the significant effects of IHD and heart failure. Dementia was significantly less likely to be
experienced by patients with severe AS compared with the general population aged 65 or older. While
not large, the odds of severe AS patients experiencing gout, stroke and diabetes are higher than
those without severe AS when adjusting for age.
Aortic Stenosis – Tier 2 Overview 14Table 6: The odds of severe aortic stenosis patients suffering comorbid specific long-term conditions, when
adjusting for age – 2012/13
Long-term condition Odds ratio 95% Confidence Limits
Ischaemic heart disease 10.512 9.816 11.258
Heart failure 2.347 2.14 2.573
Stroke 1.348 1.25 1.454
Gout 1.304 1.213 1.402
Diabetes 1.164 1.089 1.243
Chronic obstructive pulmonary disease 1.07 0.997 1.149
Mood or anxiety disorder 1.023 0.933 1.121
Cancer 0.913 0.776 1.073
Dementia 0.615 0.533 0.711
Source: 2015 NHC executive analysis of 2012/13 New Zealand Health Tracker data
People with IHD have insufficient blood and oxygen flow to the heart muscle. This means not only are
these patients suffering from severe AS, but for two-thirds, their heart function is additionally
compromised due to IHD, warranting aggressive treatment.
Treatment for aortic stenosis
There are few preventative measures for AS and no proven medical therapy to prevent its
progression. 3(16, 25) Medical therapy is instead focused on symptom relief.(26) Patients with
asymptomatic AS mostly do not require treatment. The focus of the NHC’s work has, therefore, been
concentrated on patients with clinically evident aortic stenosis. For patients with severe symptomatic
aortic stenosis, or severe AS with significant left ventricular dysfunction, surgical AVR is the standard
of care.(26) AVR can restore a patient’s quality of life and life expectancy to close to that seen in the
absence of AS.(27)4 Standard surgical AVR involves open heart surgery, requiring cardiopulmonary
bypass to replace the diseased aortic valve with a prosthetic valve. There are two types of prosthetic
valve: mechanical valves that may last up to 25 years but require the recipient to take anticoagulants
to prevent stroke, and bioprosthetic ('tissue') valves that last 10-15 years but do not require
anticoagulation.(16, 28, 29)
Not all patients with aortic valve disease are candidates for surgical AVR. Operations are complex
and durability is limited.(16) Other treatment options for AS include surgical valve repair and balloon
aortic valvuloplasty, which have a very limited role in adults with aortic stenosis. Balloon aortic
valvuloplasty may occasionally be used as a bridge to surgical AVR, to test if AVR is likely to be
beneficial, or for palliative care.
3
Rheumatic fever can be prevented, and there is a significant government programme focused on this, but rheumatic
fever is not a major cause of aortic stenosis: http://www.health.govt.nz/our-work/diseases-and-conditions/rheumatic-fever
4
Aortic valve replacement also has indications outside of aortic stenosis including aortic regurgitation, aortic dissection,
and endocarditis. This overview is concerned only with aortic valve replacement for aortic stenosis.
Aortic Stenosis – Tier 2 Overview 151.1.5 Medical management
We identified patients as 'medically managed' if they had a primary diagnosis of AS from 1 July 2005
to 30 June 2012 and had no aortic valve replacement recorded up to 30 June 2013. Using this
method (described in full p.44), there were 810 prevalent cases of which 296 cases were new
(incident cases).
The estimate is limited in that not all patients may be receiving appropriate medical management and
some may have privately funded an aortic valve replacement for which our records are limited.
Nevertheless, the estimate does correspond with Australian data, where the Medical Services
Advisory Committee (MSAC) has estimated that about 4,200 Australians receive medical
management for severe symptomatic AS.(30) On a population basis (23.13 million vs 4.47 million,
2013 5) that roughly translates to 812 medically managed patients in New Zealand.
1.1.6 Volume of aortic valve replacements
In 2012/13 there were 776 publicly funded aortic valve replacements, of which 572 had any diagnosis
of AS and 511 had a primary diagnosis of AS. Publicly funded procedures include those performed in
public and private hospitals. Reporting on privately funded cases is limited, but a recent Ministry of
Health paper on privately funded hospital discharges reported 38 aortic valve replacements, for any
cause, in 2012/13.(31)
Table 7: Number of publicly funded AVR 2012/13
Number of AVR (surgical, TAVI or sutureless)
Any diagnosis 776
Any diagnosis of AS 572
Primary diagnosis of AS 511
Source: NHC analysis of NMDS
Indications for aortic valve replacement
As noted, the primary cause of AS is ageing, where calcium deposits build up in the aortic valve,
narrowing it over time. Aortic valve replacement is a treatment, mostly for older people, when their AS
becomes symptomatic or with deterioration in left ventricular function. Mostly aortic valve replacement
is for AS. More than three-quarters of aortic valve replacements were undertaken on people with (any
diagnosis of) AS or a combination of AS and aortic insufficiency in 2012/13. Aortic insufficiency
(failure of the valve to close properly), alone accounts for 10 percent of valve replacements; 13% had
a diagnosis of multiple valve disease; and 8% were diagnoses with congenital malformations of the
aortic valve (Figure 5).
5
http://data.worldbank.org/indicator/SP.POP.TOTL
Aortic Stenosis – Tier 2 Overview 16Figure 5: Publicly funded aortic valve replacement by diagnosis 2012/13
2%
10%
13%
Aortic valve insufficiency
Aortic valve stenosis
8%
Aortic valve stenosis with
insufficiency
Congenital malformations of
aortic valve
13%
Multiple valve disease
Other
54%
Source: NHC analysis of NMDS
Amongst patients with AS, the primary reason for receiving an aortic valve replacement changes with
age. A United States study of 932 adults who underwent surgery with non-rheumatic AS found 46% of
patients had normal (tricuspid) valves, while 54% had congenitally abnormal valves – unicuspid (5%)
or bicuspid (49%).(32) The study excluded patients under the age of 26. In the younger age groups
(under 50), surgery was predominantly the result of congenitally abnormal valves, whilst in the older
age groups calcific AS was more important cause of treatment (Table 8). Of the 932 patients in the
study:
• 7% were aged 26-50 years, with just under two-thirds having a bicuspid valve and one-third
having a unicuspid valve.
• 40% of patients who underwent surgery were between the ages of 51 and 70, about two-thirds
had a bicuspid valve and one-third a tricuspid (normal) valve.
• 53% of patients who underwent surgery were over age 70, about 60% had a tricuspid valve
and 40% had a bicuspid valve.
In 2012/13, similar proportions of patients in New Zealand received surgical AVR by age cohort as
demonstrated in the US study. There were 489 publicly funded surgical aortic valve replacements in
2012/13 with any diagnosis of AS (including bioprosthetic and mechanical valves, but excluding TAVI
and sutureless AVR and valve replacement for rheumatic aortic stenosis). We report the split in Table
8 to indicatively suggest the possible disease etiology in New Zealand.
Aortic Stenosis – Tier 2 Overview 17Table 8: Age and indications for patients receiving publicly funded surgical AVR
0-25 26-50 51-70 ≥71 Total
Roberts Total
NA 7% 40% 53% 100%
and Ko patients
Unicuspid NA 35% 5% 1% 5%
Bicuspid NA 60% 62% 38% 49%
Tricuspid NA 3% 32% 60% 45%
Uncertain NA 1.50% 1% 1% 1%
NZ
2012/13 Total
1 20 150 318 489
Surgical patients
AVRFigure 6: Publicly funded AVR for any diagnosis of aortic stenosis in New Zealand from 2002/03 to 2013/14
700
600
500
Sutureless valve
400
TAVI
300
Other Valves
200 Mechanical valve
Bioprosthetic valve
100
0
Source: NHC analysis of NMDS
Standard surgical AVR valve replacement includes patients with any publicly funded hospital diagnosis of AS. ‘Other valves’
includes replacement of aortic valve with homografts or replacement of aortic valve with unstented heterografts for patients
with any diagnosis of AS. TAVI and sutureless cases are not limited by diagnosis as they are all assumed to be for AS.
About 20 records of sutureless AVR are excluded from the time series, as we could not accurately identify the date at which
they were performed.
Aortic Stenosis – Tier 2 Overview 19Transcatheter aortic valve implantation
Transcatheter aortic valve implantation (TAVI) involves implanting a bioprosthetic valve inside the
diseased native valve through a catheter and has a much shorter recovery time than open heart
surgery. It was first performed in New Zealand in 2008 where Waikato DHB drove a pilot programme
in the public sector, and has since expanded to Auckland and Canterbury DHBs. The number of TAVI
operations remains relatively few, with 65 publicly funded in 2013/14.
There are various approaches to TAVI: the transfemoral approach is the most common route whereby
the femoral artery is used to access the heart; the transsubclavian approach is a variant where the
subclavian artery is used as the peripheral conduit; and the transaortic and transapical approaches
are performed with minimally invasive surgical techniques. TAVI does not require cardiopulmonary
bypass; and when performed via a peripheral route may not always require general anaesthesia.(34)
The life of a TAVI valve is likely to be comparable to other bioprosthetic valves.(35)
According to 2014 American Heart Association/American College of Cardiology guidelines TAVI
represents an option for the management of patients who are at high risk of complications from aortic
valve replacement (class 2a recommendation) and those at prohibitively high risk with surgery (class
1 recommendation), but in New Zealand and internationally its role among patients who are
candidates for surgery is still in the process of being defined.(36) TAVI cannot be offered to all patients
with severe AS. Patients must undertake a preoperative assessment to ensure anatomical
appropriateness for the procedure. Contraindications endorsed by the European Society of
Cardiology include among others:(12)
• less than one year of life expectancy;
• little potential to improve quality of life due to comorbidities;
• severe disease of other valves requiring surgery; and
• inadequate annulus size.
Trials have demonstrated improvements in survival and symptoms after TAVI compared with medical
therapy. However, there remains a substantial group of patients who die or lack improvement in
quality of life soon after TAVI.(37) This raises important questions about the need to identify and
acknowledge futility in some patients considered for TAVI and aortic valve intervention in general. A
geriatric approach with consideration of factors such as frailty, cognition and comorbidity, in addition
to traditional risk stratification tools such as the STS Score or Euroscore II, is advocated by experts to
assess the anticipated benefit of TAVI.(38)
Aortic Stenosis – Tier 2 Overview 20Sutureless aortic valve replacement Sutureless aortic valve replacement involves the surgical replacement of a diseased aortic valve with a bioprosthetic valve that requires very few or no stiches to keep in place. It was first performed in New Zealand in 2011 at Canterbury DHB and has since expanded to Auckland and Waikato DHBs. The number of sutureless AVR operations performed remains very low, with just 19 publicly funded in 2013/14. By removing the need for sutures, operative and cardiopulmonary bypass times may be reduced compared with conventional surgery. This may enable high-risk surgical patients with concomitant cardiac surgery such as CABG (coronary artery bypass graft) to undergo long cardiac surgery procedures.(39) It may also reduce the risk to patients who have anatomical features that make surgery particularly risky. Sutureless AVR can be undertaken using conventional open heart surgery or minimally invasive surgery. Minimally invasive aortic valve surgery involves smaller incisions, allowing patients to recover more rapidly, and is associated with reduced hospital and intensive care length of stay without elevated risk of death.(40-44) It is still uncertain, however, if these benefits are applicable to minimally invasive sutureless AVR. Internationally, the procedure is often undertaken minimally invasively but this is not yet the case in New Zealand.(39, 45) Unlike TAVI, sutureless AVR allows the stenosed valve to be replaced with decalcification of the annulus. Stroke and paravalvular leak, where blood flows around the valve due to inappropriate sealing, are complications of TAVI hypothesised to be related to the lack of valve decalcification.(36) Minimally invasive aortic valve replacement surgery While TAVI and sutureless AVR are high profile procedures today, minimally invasive aortic valve replacement has been developing since the mid 1990s and is now established in many centres internationally.(40, 46, 47) In New Zealand, national data collections do not record the occurrence of minimally invasive cardiac surgery. It has been reported to the NHC, however, that minimally invasive AVR is routinely performed at Waikato DHB – comprising about 30% of procedures. Minimally invasive aortic valve surgery involves a variety of techniques, with less injury to the body than conventional surgery by using special surgical tools to operate on the heart with small incisions.. A comprehensive review of minimally invasive cardiac surgery has not been undertaken by the NHC, nevertheless, five systematic reviews on minimally invasive aortic valve replacement have been identified (Table 9). As a whole, the systematic reviews show that hospital and intensive care length of stay may be reduced using minimally invasive aortic valve surgery with no increased risk of death for patients.(40-44) Minimally invasive surgery may also improve patient satisfaction and appearance post-surgery.(42, 43) The reviews did not report pooled mortality beyond 30 days. Their findings are limited by the inclusion of few randomised controlled trials (RCTs); although where RCTs are included, results point in the same direction as observational studies. The meta analyses were not limited purely to AS patients, and pooled results were not stratified by surgical risk or the severity of the patient’s condition. Aortic Stenosis – Tier 2 Overview 21
Table 9: Meta analyses of minimally invasive aortic valve replacement

   Author              Surgical comparator    In-hospital or 30        ICU LOS              Total hospital LOS
                                                day mortality      (weighted mean            (weighted mean
                                                (relative risk)      difference in          difference in days)
                                                                         days)
Phan et al          Mini-sternotomy and             0.83                -0.69*                    -1.16*
      (43)
(2014)              mini-thoracotomy
                    (n=5,162) v.s
                    conventional sternotomy
                    (n=7,624)
Phan et al          Any mini-invasive AVR           0.77             No difference                -0.62
      (44)
(2014)              for patients with
                    previous sternotomy
                    (n=441) v.s
                    conventional sternotomy
                    (n=1,145)
Khoshbin et         Mini-sternotomy (n=110)         NA                 RCT only                  RCT only
          (42)
al (2011)           v.s conventional                                    -0.57*                -2.03 (p=0.06)
                    sternotomy (n=110)
Brown et al         Mini-sternotomy           RCT only 0.98              -0.47                    -0.24
      (41)
(2009)              (n=2,054) v.s.
                    Conventional              All studies 0.71          -0.46*                    -0.91*
                    sternotomy (n=2,532)
Murtuza et          Any mini-invasive AVR     RCT Only 0.73             -0.39*                    -0.67*
          (40)
al (2008)           (n= 2,249) v.s
                    conventional sternotomy   All studies 0.73*         -0.43*                    -1.23*
                    (n=2,642)
          (41) (40, 42-44)
Source:                      ,
* Results are statistically significant to the 5% level; RCT, randomised controlled trial

Risk stratification
Patients with severe AS may be broadly categorised into operable or inoperable patients. Operable
patients may be further stratified by their preoperative risk of mortality from surgical (or transcatheter)
aortic valve replacement. There are standard preoperative algorithms for stratifying patients into low,
moderate or high risk of operative mortality. The best of these algorithms in cardiac surgery, the
Society of Thoracic Surgeons Predicted Risk of Mortality Score (STS-PROM), stratifies patients risk
using about 30 variables (including, among other factors, presence of significant comorbidities, age,
ethnicity, and prior cardiac surgery). Low risk is defined as an operative risk of death of less than 4%
(STS-PROM 8%, respectively. The algorithm has shown a high degree of accuracy in international and New
Zealand specific studies.

A study of 142,000 first-time isolated surgical aortic valve replacements performed in the United
States between 2002 and 2010 found higher preoperative risk (STS-PROM) was significantly
associated with higher postoperative mortality, complications, and length of stay.(48) Actual mortality
versus predicted mean mortality was 1.4% vs 1.7% for low-risk patients (STS 8%),
p
was found to be the best calibrated score in high-risk patients, with expected mortality closely tracking
observed mortality across all risk quintiles. Further detail on risk stratification is contained in our
report, National Health Committee Transcatheter Aortic Valve Implantation; Tier 3 Assessment Report
(2015).
1.1.7 Inoperable patients
International studies estimate that between a third and a half of all patients with severe symptomatic
AS may be ineligible for open heart surgery.(50-52) Between January 2005 and December 2009, about
half the patients presenting at Waikato hospital with severe symptomatic AS were declined for AVR,
mostly due to multiple comorbidities and age. We estimate that about 40% of patients a year, or 349
patients, diagnosed with severe AS do not receive publicly funded AVR (Table 10).
Table 10: Incidence of aortic stenosis and publicly funded AVR including TAVI by region 2012/13
Incidence Incidence AVR AVR per Total AVR Estimated
of severe per including 100,000 per AS
AS 100,000 TAVI and population incident population
population sutureless population without
AVR
Northern 172 18 116 12 67% 56
Midland 202 22 104 11 51% 98
Central 290 17 162 9 56% 128
Southern 196 22 129 14 66% 67
Total 860 19 511 11 59% 349
Source: NHC analysis of NMDS, AVR cases include surgical AVR patients with a primary hospital diagnosis of AS and any
TAVI or sutureless AVR patients (regardless of diagnosis) for 2012/13.
Inoperable patients may also be stratified into technically inoperable patients (surgery contraindicated
due to anatomical reasons such as a porcelain aorta or chest deformity) and clinically inoperable
patients, where patients are deemed unsuitable due to significant comorbidities, eg end-stage cancer
or chronic obstructive pulmonary disease. Roughly three-quarters of inoperable patients may be
classed as (predominantly) clinically inoperable, while a quarter are technically inoperable.(53) Again,
further detail on the stratification of inoperable patients is contained in our report National Health
Committee Transcatheter Aortic Valve Implantation; Tier 3 Assessment Report (2015).
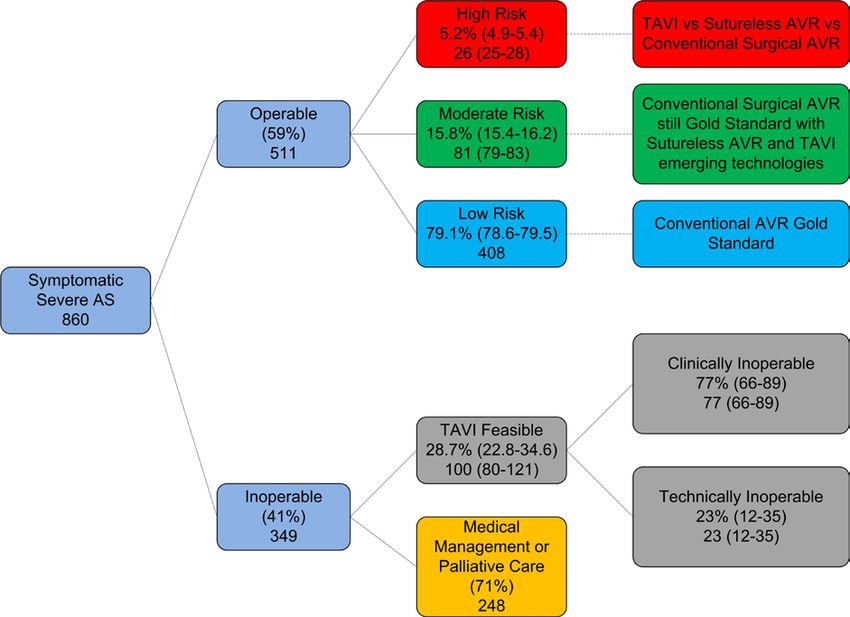
1.1.8 Aortic stenosis interventions by risk
A 2013 meta analysis of European and US aortic valve replacement intervention rates found about
59% of elderly patients with severe symptomatic AS were receiving valve replacement, whereas the
remaining 41% were considered inoperable.(19) This corresponds almost exactly to our prior estimate
of the inoperable population in New Zealand, suggesting that our current intervention rate is in the ball
park compared with other developed countries. Figure 7 shows that of the 59% of patients considered
operable, approximately 5% were high operative risk, 16% moderate operative risk, and 79% low
operative risk. Preoperative risk was stratified according to the STS-PROM score. Here, slightly
higher thresholds were used than specified above (based on an earlier analysis of the Society of
Thoracic Surgeons cardiac surgery database(54)). High risk was defined as an STS-PROM >10%,
Aortic Stenosis – Tier 2 Overview 23moderate risk was an STS-PROM 5
Figure 7: Estimation of operable and inoperable population and their possible treatment – 2012/13

                                                            (19)                  (53)
Source: NHC analysis, adapted from Osnabrugge et al 2013        and Makkar 2014.      95% confidence intervals are in
brackets. Confidence intervals are approximated for the technically inoperable group.

1.1.9   Sensitivity analysis

The analysis in Figure 7 is limited by uncertainty around the estimation of the operable and inoperable
populations for severe symptomatic AS. We do not know precisely how many patients with severe
symptomatic AS or severe AS with LV dysfunction are operable or inoperable. As described above,
we estimate the incidence of severe symptomatic AS through (new) annual hospital presentations
with a primary diagnosis of AS. For consistency, we then limited the count of valve replacements to
patients with a primary diagnosis of AS. Arguably, however, we have been too conservative in our
estimate of both the patient population with severe symptomatic AS (or severe AS with LV
dysfunction) and the number of such patients treated with AVR.

1.1.9.1 An alternative analysis of the operable population

To test our assumptions, we ran an alternative (sensitivity) analysis. To start with, the true number of
patients treated for severe AS might better be reflected by the number of AVR patients with any
diagnosis of AS, not purely a primary diagnosis of AS. In 2012/13 572 patients received publicly
funded AVR with any diagnosis of AS. As about 90% of patients undergoing AVR with any diagnosis
of AS have a primary diagnosis of AS, this change makes little difference to the overall estimate of the
operable patient population. It implies about 30 patients per annum are high risk rather than 26 (Table
11).

Aortic Stenosis – Tier 2 Overview                                                                                       25
Table 11: Sensitivity analysis - publicly funded risk stratified volumes of AVR (surgical AVR, TAVI and sutureless) with any diagnosis of AS 2012/13 Total AVR (any AS) 572 High risk 5.2% 30 Moderate risk 15.8% 90 Low risk 79.1% 452 Source: NHC analysis of NMDS with TAVI and sutureless AVR numbers provided by DHBs 1.1.9.2 An alternative analysis of the inoperable population The inoperable patient population might also be under-estimated consequent to under-estimating the incidence of severe symptomatic AS (or severe AS with LV dysfunction). An alternative approach to estimating incidence is to retrospectively estimate cases based on the number of valve replacements. Assuming the high estimate of 572 publicly funded AVRs, international evidence suggests a plausible inoperable range of between a third and 41%.(19, 51, 55) Or between 59% and 67% of patients with severe symptomatic AS are receiving intervention in other developed countries. Specifically, the European/US meta analysis suggests that about 41% of patients may be considered inoperable for surgical AVR.(19) This is a little higher than the 2001 European Heart Survey on Valvular Heart Disease (n=216) which found that surgery was denied in 33% of elderly patients with severe symptomatic AS.(51) Likewise, a 2005 Michigan study (n=369) found one-third of patients with severe symptomatic AS did not undergo aortic valve replacement.(55) In New Zealand, a Waikato hospital study (2005-2009) found about half of patients with symptomatic severe AS in its region did not receive aortic valve replacement.(56) With the approximate doubling of aortic valve replacements in New Zealand between 2006/07 and 2013/14, our expectation is that the number of patients presenting at hospital with severe symptomatic AS and not undergoing valve replacement would now be much less than half. In this context, our current estimate of 41% (aligning with the meta analysis of European and US data) appears defendable, and arguably on the high side. Assuming a plausible range of inoperability of between 33% and 41% implies a severe symptomatic AS incidence of about 850 to 970 patients (Table 12). Of note, we assume that incidence captures both severe symptomatic cases and severe asymptomatic AS cases with LV dysfunction. We make this assumption on the basis that AVR is indicated for both populations, and we expect that a small number of patients in the numerator (572) are asymptomatic with LV dysfunction. Aortic Stenosis – Tier 2 Overview 26
Table 12: Sensitivity analysis – incidence of severe symptomatic aortic stenosis or severe aortic stenosis with LV
dysfunction – 2012/13

                                                   Low estimate       High estimate

Total AVR with any diagnosis of          572
AS

Inoperable population                              33%                41%

Incidence of severe symptomatic                    854                969
AS or severe (asymptomatic) AS
with LV dysfunction

Source: NHC analysis

Again, this alternative analysis makes only a modest difference to our initial estimate, with the
inoperable patient population in which TAVI may be considered feasible ranging from 81 to 114
patients (with our original estimate of 100 patients fitting roughly in the middle of the range, Figure 7)
and the technically inoperable patient population ranging from 19 to 26 patients per annum (compared
with 23 in Figure 7) (Table 13).

Table 13: Sensitivity analysis – inoperable population with aortic stenosis – 2012/13

                                                  Low estimate          High estimate

Incidence of severe                               854                   969
symptomatic AS or severe
(asymptomatic) AS with LV
dysfunction

Inoperable population                             33%                   41%

                                                  282                   397

TAVI feasible                       28.7%

                                                  81                    114

Clinically inoperable               77%

                                                  62                    88

Technically inoperable              23%

                                                  19                    26

Source: NHC analysis

We assume the low and high incidence estimates capture both cases of symptomatic severe AS and
asymptomatic AS with LV dysfunction. As previously mentioned, the latter group is likely to be very
small. If it is assumed that 5-10% of severe AS cases have LV dysfunction (13) and about a quarter of
these cases are asymptomatic(19), then incidence of severe asymptomatic AS with LV dysfunction can
be approximated. Here, we estimate an incidence of 14 to 31 patients per annum (Figure 8).

Aortic Stenosis – Tier 2 Overview                                                                                27
Figure 8: Estimated incidence of asymptomatic aortic stenosis with LV dysfuction Total incidence (z) = severe symptomatic AS (x) + severe asymptomatic AS with LV dysfunction (y) z (low estimate) = 854 z (high estimate) = 969 x= 0.75 * severe AS (q) = 0.75q y (low estimate) = 0.05*q*0.25 = 0.0125q y (high estimate) =0.1*q*0.25 = 0.025q Therefore, z (low estimate) = 0.0125q + 0.75q =854 0.7625q = 854 So, q=1120, x=840, y= 14 z (high estimate) = 0.025q + 0.75q =969 0.775q =969 So, q =1250, x=938, y=31 Source: NHC analysis 1.1.9.3 Estimating the prevalence of inoperable AS Still it might be argued that we are under-counting the inoperable population using annual incidence, as medically managed patients may live several years with severe aortic stenosis. We estimated above that the prevalent population of medically managed severe AS was about 810 patients in 2012/13, corresponding with Australian data. (30 An alternative analysis is to estimate the inoperable prevalent population based on the estimated mortality of medically managed patients. Recent data from a randomised controlled trial of TAVI gives insight into the life expectancy of medically managed patients with severe symptomatic AS. It shows that roughly half of all patients are dead within a year, with nearly all patients dead within five years. Assuming an equivalent mortality rate for medically managed patients in New Zealand and applying our high and low estimates of inoperable incidence implies a prevalence of between 634 and 895 medically managed patients with severe AS in New Zealand. The range suggested from this alternative analysis is consistent with our original estimate of 810 patients. Aortic Stenosis – Tier 2 Overview 28
Table 14: Sensitivity analysis: population prevalence of inoperable aortic stenosis – 2012/13

Year                      0         1      2         3         4        5         6         Total estimated
                                                                                            prevalence of
                                                                                            medically
                                                                                            managed AS

Low incidence             282
estimate

High incidence            397
estimate

Estimated survival        100%      49%    32%       20%       16%      7%        0%
of medically
managed patients

Low estimate              282       139    91        57        45       21        0         634

High estimate             397       196    129       81        63       29        0         895

Source: NHC analysis

Any new technology for medically managed patients, be it TAVI or any other intervention, would thus
be presented with a short run backlog of demand consequent to accumulated prevalence. For severe
symptomatic AS, this upfront demand diminishes rapidly. Given the short life expectancy of patients,
roughly half may be dead within a year. Short run supply would also be limited by the learning curve
associated with the technology, and the capacity and capability of the sector to deliver the service in
the immediate-term. Thus whilst a prevalence view may imply higher volumes of patients in the short
run, there are both demand and supply side short-term constraints that suggest an incidence view
may be more appropriate (Table 15).

Table 15: Sensitivity analysis – estimated volume of inoperable patients potentially eligible for TAVI including
clinically inoperable and technically inoperable patients 2012/13

                                          Low            High
                                          estimate       estimate

Estimated inoperable                      634            895
prevalence

TAVI feasible                 29%         182            257

Clinically inoperable         77%         140            198

Technically                   23%         42             59
inoperable

Source: NHC analysis

Aortic Stenosis – Tier 2 Overview                                                                                  29
Forecast aortic valve replacement demand and expenditure
In 2012/13, the average cost of aortic valve replacement (AVR) was about $45,000 per patient for AS
patients across all risk classes. 6 In the same year, there were 572 publicly funded aortic valve
replacements for patients with any diagnosis of aortic stenosis. In cost terms, this equates to roughly
$26 million in government expenditure. On the basis of projected population growth alone, it is
expected that AVR volumes will grow to nearly 900 patients by 2025/26. Population growth is
modelled on an expected annual growth rate of 3.45% in the 65+ population over the period.
Alternatively, if there were a continuation in trend of AVR volumes since 2001/02, representing an
annualised growth rate 6.9%, there would be approximately 1,400 AVR operations undertaken by
2024/25 (Figure 9). Growth in AS incidence is projected to grow at the same rate as the 65+
population.
Figure 9: Projected aortic stenosis incidence and demand for publicly funded aortic valve replacement to 2025/26
1600
1400 1369
1200
1000
889
Patients
800
600
400
200
0
2000/01
2001/02
2002/03
2003/04
2004/05
2005/06
2006/07
2007/08
2008/09
2009/10
2010/11
2011/12
2012/13
2013/14
2014/15
2015/16
2016/17
2017/18
2018/19
2019/20
2020/21
2021/22
2022/23
2023/24
2024/25
2025/26
AS Incidence Total AVR
Projected AS Incidence Projected AVR (population growth)
Projection AVR (historic trend)
Note: The AVR estimate is limited to patients with a diagnosis of AS. AS incidence is estimated assuming a primary hospital
diagnosis of AS.
Source: NHC analysis of NMDS and Mortality records, Modelled on Statistic New Zealand population projections.
6
Cost Schedule 7 from 512 records available in the NCCP data including TAVI, sutureless and conventional AVR.
Aortic Stenosis – Tier 2 Overview 30The number of publicly funded aortic valve replacements for AS grew at 6.9% per annum between 2001/02 and 2012/13, while the number of hospital primary diagnoses of AS grew at 4.75% per annum. Consequently, a greater proportion of patients with severe AS are now receiving surgical treatment. The high rate of growth seen in the past decade for aortic valve replacement cannot be sustained indefinably. As illustrated in Figure 9, if AVR continues to grow at 6.9% per annum, volumes will outstrip expected hospital presentations (with a primary diagnosis of AS) by 2025/26. As not all patients with severe AS can be treated with AVR, supply of AVR will always be less than hospital presentations. Of note, this historic growth path for AS is well in excess gross domestic product (GDP) growth expectations. Real GDP growth is forecast to average 2.8% per year over the four years to 2019.(57) 1.2 The historic context to the growth in aortic valve replacement volumes As illustrated in Figure 9, the number of valve replacements undertaken remained relatively flat between 2001/02 to 2006/07. Subsequently, a service development process for cardiac surgery services in New Zealand was requested by the Minister of Health and initiated in May 2008 by the Ministry of Health with the New Zealand Branch of the Cardiac Society of Australia and New Zealand.(58) A Cardiac Surgery Service Development Working Group was established to lead the development process. In 2008, the working group released a report that recommended increasing cardiac surgery intervention rates (including for aortic valve replacement), by a third between 2007/08 and 2012/13.(59) In 2009, the National Cardiac Surgery Network was established to lead the implementation of the working group’s recommendations. National cardiac surgical targets were introduced in 2009, and in conjunction with increased funding for elective surgery from 2006/07, have led to a substantial growth in the number of AVR operations undertaken. 1.3 Forecast aortic valve replacement expenditure Given the preceding demand estimates, we expect government expenditure on AVR to grow to between $40 million and $60 million by 2025/26, representing an annual rate of growth of between 3.5% and 7%. Both rates are greater than expected GDP growth, presenting an issue around affordability (and societal choices) presented by costly interventions for AS. The range estimate assumes an average cost for AVR of $45,000, using 2012/13 cost data. The low estimate corresponds to a scenario where demand grows in accordance with AS incidence – which is modelled to grow in line with the growth rate of the 65+ population. The high estimate is a straight line extrapolation of the trend in AVR growth from 2001/02. The high estimate is a ceiling estimate, which is unlikely to be reached without greater growth in AS cases or a significant increase in the unit cost of intervention. A forecast of expenditure growth by region is contained in Appendix 1 (Figure 11). Model of care for severe aortic stenosis Figure 10 outlines the typical model of care for severe AS. There are multiple points of patient entry into the model of care, including referral from primary care and referral from general medicine or geriatrics electively or after an acute episode. A decision is then made around patient appropriateness for intervention – normally by a cardiologist – although other internal medicine specialists may screen out unsuitable candidates. After referral, most patients are seen at their local DHB cardiology outpatient clinic or reviewed by cardiology services as an inpatient at their local DHB secondary care hospital. Diagnostic assessments, including echocardiogram, are undertaken to confirm diagnosis and an initial patient management decision is made by the cardiologist. If a patient is a potential candidate for surgery or TAVI, a central part of the evaluation is an assessment of surgical risk – generally identified through a tool such as the EuroSCORE or the STS score. This Aortic Stenosis – Tier 2 Overview 31
You can also read