Apex Frozen Foods Limited - Investor Presentation Q1 FY19 Results CIN: L15490AP2012PLC080067 - Apex - Frozen Foods

Page created by Darryl Adkins
 
CONTINUE READING
Apex Frozen Foods Limited - Investor Presentation Q1 FY19 Results CIN: L15490AP2012PLC080067 - Apex - Frozen Foods
Investor Presentation

Apex Frozen Foods Limited
  CIN: L15490AP2012PLC080067

      Q1 FY19 Results
Apex Frozen Foods Limited - Investor Presentation Q1 FY19 Results CIN: L15490AP2012PLC080067 - Apex - Frozen Foods
Safe Harbor

      This presentation and the accompanying slides (the “Presentation”), which have been prepared by Apex Frozen Foods Ltd (the
      “Company”) solely for information purposes and do not constitute any offer, recommendation or invitation to purchase or
      subscribe for any securities, and shall not form the basis or be relied on in connection with any contract or binding commitment
      what so ever. No offering of securities of the Company will be made except by means of a statutory offering document
      containing detailed information about the Company.

      This Presentation has been prepared by the Company based on information and data which the Company considers reliable,
      but the Company makes no representation or warranty, express or implied, whatsoever, and no reliance shall be placed on, the
      truth, accuracy, completeness, fairness and reasonableness of the contents of this Presentation. This Presentation may not be
      all inclusive and may not contain all of the information that you may consider material. Any liability in respect of the contents of,
      or any omission from, this Presentation is expressly excluded. All product names, logos, and brands are property of their
      respective owners. All company, product and service names used in this presentation are for identification purposes only. Use of
      these names, logos, and brands does not imply endorsement.

      Certain matters discussed in this Presentation may contain statements regarding the Company’s market opportunity and
      business prospects that are individually and collectively forward-looking statements. Such forward-looking statements are not
      guarantees of future performance and are subject to known and unknown risks, uncertainties and assumptions that are difficult
      to predict. These risks and uncertainties include, but are not limited to, the performance of the Indian economy and of the
      economies of various international markets, the performance of the industry in India and world-wide, competition, the company’s
      ability to successfully implement its strategy, the Company’s future levels of growth and expansion, technological
      implementation, changes and advancements, changes in revenue, income or cash flows, the Company’s market preferences
      and its exposure to market risks, as well as other risks. The Company’s actual results, levels of activity, performance or
      achievements could differ materially and adversely from results expressed in or implied by this Presentation. The Company
      assumes no obligation to update any forward-looking information contained in this Presentation. Any forward-looking statements
      and projections made by third parties included in this Presentation are not adopted by the Company and the Company is not
      responsible for such third party statements and projections.

Investor Presentation Q1 FY19                         Apex Frozen Foods Limited                                                      2
Apex Frozen Foods Limited - Investor Presentation Q1 FY19 Results CIN: L15490AP2012PLC080067 - Apex - Frozen Foods
Table of Contents

           1            Key Highlights – Q1 FY19

           2            Industry Trends

           3            Our Core Strengths

           4            Past Performance

Investor Presentation Q1 FY19             Apex Frozen Foods Limited   3
Apex Frozen Foods Limited - Investor Presentation Q1 FY19 Results CIN: L15490AP2012PLC080067 - Apex - Frozen Foods
01
                Key Highlights – Q1 FY19

Investor Presentation Q1 FY19   Apex Frozen Foods Limited   4
Apex Frozen Foods Limited - Investor Presentation Q1 FY19 Results CIN: L15490AP2012PLC080067 - Apex - Frozen Foods
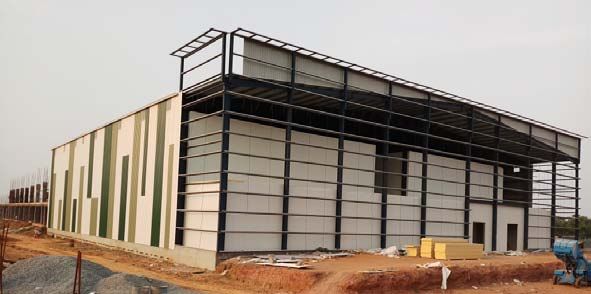
Completion Status of the New Shrimp Processing Plant
                                            Existing shrimp processing capacity of 15,240 MTPA (owned + leased)

                                            New shrimp processing plant with installed capacity of 20,000 MTPA:
                                                15,000 MTPA for Ready-To-Cook (RTC) products
                                                5,000 MTPA for Ready-To-Eat (RTE) products

                                            Total planned outlay of Rs 902 mn, of which, Rs 421 mn has been incurred as
                                             on 30-Jun-18

                                            Picture 1: The roof work for the Processing building has started
                                             Picture 2: Assembling of Compressors has started in the Machinery building
                                             Picture 3: The Cold Storage building has been completed

                                            The civil construction work was affected by inclement weather and is now
                                             expected to be ready by end of Q3 FY19

                                                   Capacity (MTPA); Utilisation % (volumes sold ÷ capacity × 100)

                                                                            Owned     Leased

                                                 90%                                              93%
                                                             84%         78%          81%                     6,000

                                                                                                              29,240
                                                                         3,000       3,000        6,000
                                                             1,500
                                                7,821        9,240       9,240       9,240        9,240

                                               Mar-14       Mar-15     Mar-16       Mar-17      Mar-18      Mar-19E

Investor Presentation Q1 FY19   Apex Frozen Foods Limited                                                           5
Apex Frozen Foods Limited - Investor Presentation Q1 FY19 Results CIN: L15490AP2012PLC080067 - Apex - Frozen Foods
Operational Performance – Q1 FY19 (1)

        Volumes sold (MT) and Capacity utilisation* (%)                                           Geographical break up of Revenue (%)

                                                                                                            USA    UK    Other EU
                                       93%                       97%
             81%                                                                                  10.6%             17.6%
                                                                                                   7.6%                                   23.7%
                                      14,146                                                                         6.2%                  2.2%

           9,897
                                                                                                  81.8%             76.2%                 74.1%

                                                                 3,680

            FY17                       FY18                     Q1 FY19                           F Y17              F Y18           Q 1 F Y19

                    Total installed capacity of 15,240 MTPA;                                        Our revenue contribution from
                     The dip in shrimp consumption in some                                       European Union (EU) has increased to
                      of our key markets is gradually picking                                    ~26% in Q1 FY19 from ~18% in FY17,
                       up since the second half of Q1 FY19                                      making the revenue mix more diversified

     *Calculated as ‘Volumes sold ÷ Total installed capacity’

Investor Presentation Q1 FY19                                       Apex Frozen Foods Limited                                                6
Apex Frozen Foods Limited - Investor Presentation Q1 FY19 Results CIN: L15490AP2012PLC080067 - Apex - Frozen Foods
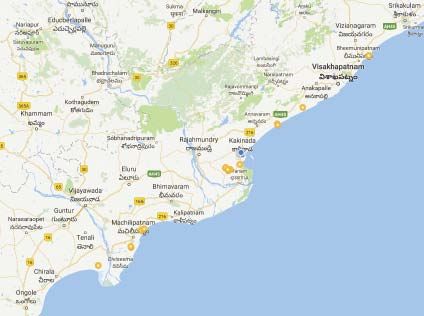
Operational Performance – Q1 FY19 (2)

     Shrimp price correction led to lower Avg. Realisation*                                         Although, EBITDA per kg# continued to improve

                                                                      (Rs/Kg)                                                                                (Rs/Kg)

                                         729                                                                                                                    101
         717             718                             720                                                         89              92             92

                                                                                                     55
                                                                         663

        FY17          H1 FY18         9M FY18           FY18          Q1 FY19                      FY17          H1 FY18         9M FY18           FY18      Q1 FY19

                   Globally, shrimp prices have corrected by
                                                                                                             Despite lower product realization, our
                       15-20% from the highs of last year;
                                                                                                           EBITDA per Kg has been largely maintained
                     However, our valued-added focused
                                                                                                            due to a pass through in farm gate prices
                   product portfolio along with depreciating
                                                                                                                   and favourable product mix
                      INR arrested the fall to some extent

     *Calculated as ‘Total Income, including other income (Rs) ÷ Volumes sold (MT) × 1000’;       # Calculated as ‘EBITDA (Rs) ÷ Volumes sold (MT) × 1000’

Investor Presentation Q1 FY19                                         Apex Frozen Foods Limited                                                                 7
Apex Frozen Foods Limited - Investor Presentation Q1 FY19 Results CIN: L15490AP2012PLC080067 - Apex - Frozen Foods
Profit & Loss Highlights – Q1 FY19

                      Standalone (Rs mn)               Q1 FY19 Q4 FY18 Q-o-Q %         FY18     FY17    Y-o-Y %
                      Net revenue                        2,393       2,031      17.8   9,986    6,987    42.9
                      Other income                        47          29        61.1    199     106      88.1

                      Total Income                       2,440       2,060      18.4   10,185   7,093    43.6
                      Raw material                       1,501       1,394      7.7    7,031    5,317    32.2
                      Employee expenses                   117         106       10.6    389     249      56.2
                      Other expenses                      451         281       60.4   1,466    977      50.0
                      EBITDA                              370         279       32.8   1,299    549      136.5
                      EBITDA margin                      15.2%      13.5%        -     12.8%    7.7%       -
                      Depreciation & amortisation         26          25        3.5     87       63      38.0
                      Finance cost                        17          13        25.5    87      112      -22.5
                      Profit before tax                   328         240       36.3   1,126    374      200.7
                      Tax                                 116         65        76.5    335     123      171.8
                      Profit after tax                    212         175       21.2    791     251      214.8
                      PAT margin                         8.7%        8.5%        -     7.8%     3.5%       -
                      Other comprehensive income          -65         -28        -      -39      40        -
                      Total comprehensive income          147         147       -0.2    752     292      157.8
                      Diluted EPS (Rs)                    4.70       5.21       -9.8   26.63    12.15    119.2

Investor Presentation Q1 FY19                       Apex Frozen Foods Limited                                     8
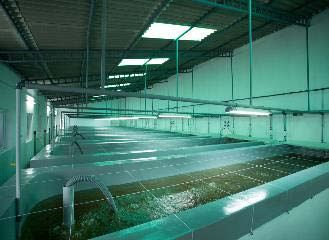
Apex Frozen Foods Limited - Investor Presentation Q1 FY19 Results CIN: L15490AP2012PLC080067 - Apex - Frozen Foods
02
                Industry Trends

Investor Presentation Q1 FY19     Apex Frozen Foods Limited   9
Apex Frozen Foods Limited - Investor Presentation Q1 FY19 Results CIN: L15490AP2012PLC080067 - Apex - Frozen Foods
Global Seafood Industry – Overview

    Increased seafood intake globally, reflected in higher per capita consumption of seafood (kg)

                                                                                                  Rising income level

                                                                                                  Variety in product offering
                                                            20
                       15                                                                         Richer protein content

                      1995                                 2015                                   Favourable State policies like FTAs

    Source: FAO, CRISIL Research

   Seafood industry’s growth trajectory, led by rising share of Aquaculture – Production (mn tonne)

                                   Capture   Aquaculture
                                                                                                Total production grew at a CAGR of 3.3% over
                                                                                                 2005-2015
                                                                   93                           Driven by 7% CAGR in aquaculture while
                                                  69
                                   35                                                            capture fishery stagnated with a 1% CAGR
             18
             70                    76             85               87
                                                                                                The trend is expected to continue in favour of
                                                                                                 aquaculture growth
           1995                2005             2015              2020P

    Source: FAO, CRISIL Research
Investor Presentation Q1 FY19                                      Apex Frozen Foods Limited                                              10
Global Demand-Supply Scenario, Favourable for India

      Demand: Top 5 importing countries, forming ~50%                             Supply: Asia forms ~92% of total aquaculture production

                                                                                       69.6%
                                                                                       15.0%
                                                                   2015                     67.7%
                                                                                            14.7%                                                2015
         20-22%
                                                                   2020P                                                                         2020P
     18.0%
                                                                                                           9.9%

                                                                                                     7.8%
                     11.0%                                                                                        6.8%6.7%
                                     9-11%
                         8-10%   9.0%
                                                                                                                              5.2%
                                             7.0%                                                                                 4.8%
                                                    5-7%          5-7%
                                                           5.0%                                                                          3.0%3.0%

        USA             Japan     China       Spain        Thailand                      China          India     Indonesia   Vietnam    Bangladesh

             Rising demand for Shrimp and Tuna in the                                        India is gaining market share on the back
             USA is driving its market share increase in                                     of its quality output at competitive prices;
                       consumption, globally                                                      Largest exporter of shrimp to USA

     Source: CRISIL Research                                                       Source: FAO, CRISIL Research

Investor Presentation Q1 FY19                              Apex Frozen Foods Limited                                                        11
India’s Growth in Aquaculture Exports and Farming

           India’s exports on a rise – FY18 (lakh tonnes)                                      Frozen shrimp exports by India
                                                                                                                                          4.8
                   13.77                         Total Seafood                                               3.7               3.7
                (21% y-o-y)                                                                          3.2             3.1
                   5.66
                (30% y-o-y)                      Frozen Shrimp                    1.7        1.8

                                                                                 189         229     301    358      374      434     566

                   4.02
                                                  L. Vannamei                    FY12    FY13       FY14   FY15     FY16      FY17    FY18
                (22% y-o-y)
                                                                                                      '000 tonnes      $ bn

    Source: MPEDA                                                            Source: MPEDA

                     Significant potential for scaling up shrimp farming in India – Area under culture (‘000 hectares)

                                                                                                            Strong growth in
                                                                                                            FY17 but the area
                                                                                                            under culture still
                                                                                                            forms only 12-14% of
                                                                                                            the     total    area
                                                                                                            suitable for shrimp
                         119           139             131             141              168                 farming in India

                        FY13           FY14           FY15            FY16              FY17

Investor Presentation Q1 FY19                        Apex Frozen Foods Limited                                                       12
03
                Our Core Strengths

Investor Presentation Q1 FY19   Apex Frozen Foods Limited   13
Integrated Operations Ensure Quality Control & Timely Delivery

    Hatchery                         Farming                          Processing               Packaging               Logistics

                                                                          • Capacity of           • As per customer       • 1,500 MT of cold
        • Three operational             • 1,800 acres land
                                                                            15,240 MTPA of          requirement in          storage capacity
          units; combined
                                        • Forms 18-20% of                   processed shrimp        Retail, Food
          breeding capacity                                                                                               • Own reefer fleet
                                          total raw material                                        Service Cos. and
          of over 1bn SPF*                                                • Adding another                                  for transportation
                                          requirement                                               Private Label
          seeds                                                             20,000 MTPA                                     of goods
                                                                                                    brands

                                Backward integration allows flexibility in shaping production plan based on customers’ needs

     * Specific Pathogen Free

Investor Presentation Q1 FY19                                  Apex Frozen Foods Limited                                           14
Strategically Located – Close to Farms as well as Ports

                                Andhra Pradesh accounts for ~70% of the total shrimp farming in India

                                                                                Processing Plant

                                                                                Hatchery and Farm Locations

                         Our facilities are in proximity to one another, enabling smooth transition to the next stage:
                        Farms are within 10-200 kms; Kakinada port is within ~20 kms; Vizag port is within ~150 kms

Investor Presentation Q1 FY19                       Apex Frozen Foods Limited                                            15
Long Standing Relationships with Reputed Clients

                       Our key distributors…                               …The end customers (Retail/Food Service Companies)

              Pacific Seafood
                                                                      Walmart                                 WinCo
                                                                                                                FOODS
                 OCEAN WORLD
                       VENTURES
                                                                               Sysco             US.           Kroger
                                                                                                FOODS
              Mazzetta Company

                Chicken of the Sea                                     SAFEWAY                                  ALDI
                                frozen foods

Investor Presentation Q1 FY19                  Apex Frozen Foods Limited                                              16
Quality Control Certifications act as Entry Barrier

                                                               EU Approved

                        Government of India
                        Ministry of Commerce
                        Directorate General of Foreign Trade

                                Four Star Export
                                House                                             Approved

Investor Presentation Q1 FY19                         Apex Frozen Foods Limited              17
Founded by Promoters with Extensive Experience …

          Industry knowledge, relationships and experience of the founders has enabled sustained growth

                          Karuturi Satyanarayana Murthy, Chairman and Managing Director
                               Founding Promoter of the company and has an experience of over 25 years in aquaculture industry
                               Responsible for making strategic decisions and decisions relating to business development and
                                overall administration
                               Active member of the Rotary International Club

                          Karuturi Subrahmanya Chowdary, Executive Director
                               Promoter of the company with experience of over 15 years in aquaculture industry.
                               Played a significant role in the development of our business
                               Involved in the business operations and marketing activities of our Company.

                   ...Supplemented by a Strong First Line of Management having Deep Operational Experience

Investor Presentation Q1 FY19                        Apex Frozen Foods Limited                                            18
04
                Annual Financial Highlights

Investor Presentation Q1 FY19   Apex Frozen Foods Limited   19
Robust Growth in Revenue and Profits…

             Total income (Rs mn)                               EBITDA (Rs mn) & Margin (%)                  PAT (Rs mn) & Margin (%)

   FY14                     5,146                             FY14    329     6.4%                    FY14      134 2.6%

   FY15                        6,044                          FY15    382     6.3%                    FY15      186   3.1%

   FY16                        6,083                          FY16    455      7.5%                   FY16      197   3.2%

   FY17                          7,093                        FY17    549        7.7%                 FY17      251     3.5%

   FY18                                   10,185              FY18    1,299                   12.8%   FY18      791                   7.8%

                                                                Margin expansion led by higher
          Grown at a CAGR of 19%                                utilization, in-house farming and            Grown at a CAGR of 56%
                                                                       value-added products
   Note: The data beyond FY17 is as per Restated Financials

Investor Presentation Q1 FY19                                  Apex Frozen Foods Limited                                         20
…Led by Strong Financial Discipline, Leading to…

           Net debt-to-equity (x)                                             Working capital (Days)                                      Diluted Book value (Rs/share)

   FY14                                       2.0                    FY14                               48                             FY14          12.1

   FY15                                1.5                           FY15                                  54                          FY15            17.9

   FY16                       1.0                                    FY16                                 51                           FY16              24.1

   FY17                     0.9                                      FY17                                       60                     FY17                 35.0

   FY18        0.1                                                   FY18                                 52                           FY18                                 96.7

           Improved D/E led by…                                        …largely stable working capital…                                   …and growing surplus profits

  Note: The data beyond FY17 is as per Restated Financials.
  Ratios: Net D/E = (Total debt – Cash & equivalents) ÷ Net-worth;   WC days = Inventory days + Debtor days − Creditor days;   BVPS = Net-worth ÷ Total no. of outstanding shares

Investor Presentation Q1 FY19                                          Apex Frozen Foods Limited                                                                            21
…Enhanced Profitability for Stakeholders

                             Return on Net Worth (%)                                                     Return on Capital Employed (%)

                      FY14                                      43.1%                                  FY14                    18.6%

                      FY15                                     39.6%                                   FY15                    19.3%

                      FY16                             30.0%                                           FY16                   18.0%

                      FY17                           27.2%                                             FY17                   17.8%

                      FY18                                   38.4%                                     FY18                               28.5%

                                                        Consistently generating high Return Ratios

   Note: The data beyond FY17 is as per Restated Financials;
   Ratios: RoNW = PAT ÷ Average Net-worth × 100; RoCE = EBIT × (1-tax rate) ÷ Average Capital employed × 100

Investor Presentation Q1 FY19                                      Apex Frozen Foods Limited                                                      22
Profit & Loss Highlights

                Profilt & Loss (Rs mn)                                     FY14          FY15      FY16    FY17     FY18
                Net revenue                                                5,143        5,994      6,035   6,987    9,986
                Other income                                                  3            50        47     106      199

                Total income                                               5,146        6,044      6,083   7,093   10,185
                Raw material                                               3,885        4,752      4,510   5,317    7,031
                Employee expenses                                           226           258       233     249      389
                Other expenses                                              705           652       884     977     1,466
                EBITDA                                                      329           382       455     549     1,299
                EBITDA margin (%)                                          6.4%          6.3%      7.5%    7.7%    12.8%
                Depreciation                                                 45                4     49      63       87
                EBIT                                                        283           378       406     487     1,213
                EBIT margin (%)                                            5.5%          6.3%      6.7%    6.9%    11.9%
                Finance cost                                                 80            96       104     112       87
                Profit Before Tax                                           204           282       302     374     1,126
                Tax                                                          70            96       105     123      335
                Profit After Tax                                            134           186       197     251      791
                PAT margin (%)                                             2.6%          3.1%      3.2%    3.5%     7.8%
                Note: The data beyond FY17 is as per Restated Financials

Investor Presentation Q1 FY19                                      Apex Frozen Foods Limited                                23
Balance Sheet Highlights

       Standalone (Rs mn)                FY15       FY16         FY17    FY18              Standalone (Rs mn)            FY15    FY16    FY17    FY18
       Shareholder’s Funds                 560       753         1,094   3,023
                                                                                           Non-current assets             523     632     857    1,373
       Share capital                       240       240          240     313
                                                                                           Net block                      523     552     829    1,111
       Reserves & surplus                  320       513          854    2,710

       Non-current liabilities             103       131          273      66              Capital work-in-progress          -     80       8     209

       Long term borrowings                 94       119          210      83
                                                                                           Other non-current assets         1       1      21         54
       Deferred tax liability                 8        10          63      -35
       Other non-current                                                                   Current Assets                1,128   1,156   1,910   2,902
                                              1         2            -     18
       liabilities
                                                                                           Inventories                    503     596     638    1,016
       Current liabilities                 989       904         1,400   1,187

       Short term borrowings               777       642          847     722              Trade receivables              502     415     828     674

       Trade payables                      115       161          309     266
                                                                                           Cash & cash equivalents         16      18      46     644
       Other current liabilities            35         31          44      49
                                                                                           Short term loans & advances    107     127     398     568
       Short term provisions                61         70         199     149

       Total Liabilities                1,651      1,788         2,767   4,276             Total Assets                  1,651   1,788   2,767   4,276

      Note: The data beyond FY17 is as per Restated Financials

Investor Presentation Q1 FY19                                        Apex Frozen Foods Limited                                                   24
For further information, contact:

                                Mr. Subhramanya Chowdary
                                                                                        Ms. Pooja Sharma
                                     Executive Director
                                                                                   pooja.sharma@stellar-ir.com
                                 ir@apexfrozenfoods.com

Investor Presentation Q1 FY19                          Apex Frozen Foods Limited                           25
You can also read