Appendix 7.2 Detailed Baseline - The London Resort
←
→
Page content transcription
If your browser does not render page correctly, please read the page content below
THE LONDON RESORT PRELIMINARY ENVIRONMENTAL INFORMATION REPORT
Appendix 7.2 Detailed Baseline
INTRODUCTION
Chapter 7: Land use and socio-economics reports the existing socio-economic and
employment conditions relevant to the study areas of the London Resort, and assesses
the impact of the London Resort upon those baseline conditions.
However, it is important to outline the baseline conditions in more detail than Chapter
7: Land use and socio-economics. This appendix reviews the baseline conditions at a
more detailed geography and presents additional metrics and industry specific data.
This appendix follows the same structure as the baseline presented in the chapter,
where data relevant to each effect is listed in order of the effects assessed. Chapter 7:
Land use and socio-economics concludes on the sensitivity of each receptor relevant
to each effect, that sensitivity is not repeated in this appendix.
The study areas are consistent with that presented in the main chapter, as shown in
Table 7.2.1 below. Notably, the listed study area abbreviations are used throughout the
appendix.
Study areas considered in the London Resort
Geographical
Definition Rationale
Study Area
The DCO Order Limits. The PSB study area is used for effects which
The Project Site Refer to Figure 7.1 in are at the Project Site level. It is used for the
Boundary (PSB) Chapter 7 for a map of assessment of displacement / loss of
the PSB businesses.
The CIA is used to assess the displacement /
loss of community uses, such as open spaces,
Community A 500m radius around
public rights of way and other recreational or
Impact Area (CIA) the PSB
community facilities as the community uses
affected will be in or near the Project Site.
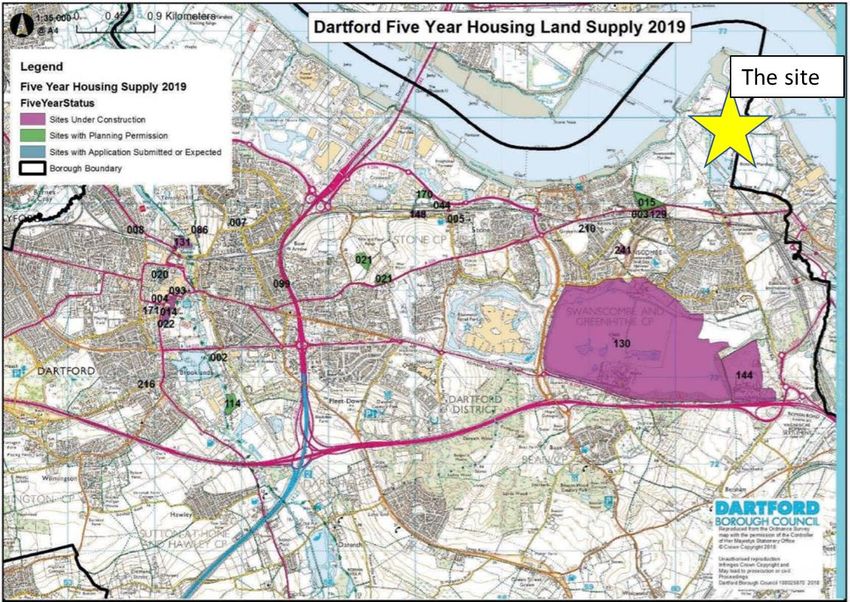
Dartford The borough boundary of The Dartford dwelling requirements are used
Dartford local authority to assess the impact of the displacement of
dwellings as a result of property acquisition
on the Dartford housing market
Dartford, Gravesham and The three local authorities that the Project
Core Study Area
Thurrock (local Site falls within. Many of the effects are
(CSA)
authorities) expected at the CSA.
Sub-Regional Kent and Medway, Essex, This study area is presented in the baseline
Context Area1 Thurrock (combination of for context but is not used to assess the
(SRCA) districts) significance of any effects.
Labour A 60-minute travel time 60-minutes is considered a reasonable
1
Defined as county / unitary authorities to be consistent with ONS statistical data releases.
7.2-1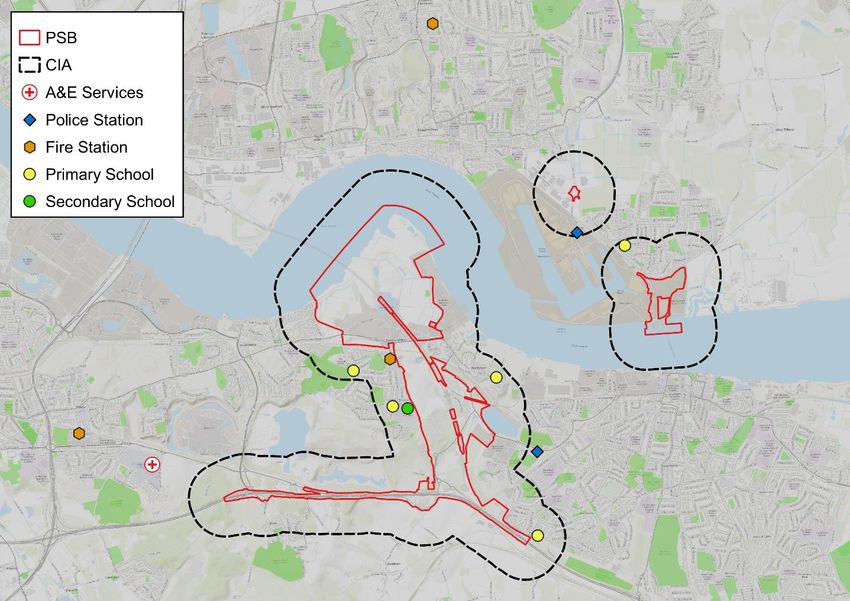
PRELIMINARY ENVIRONMENTAL INFORMATION REPORT THE LONDON RESORT
Geographical
Definition Rationale
Study Area
Catchment Area (car or public transport) commuter time for an employee. This study
(LCA) to the site2. area is used to assess employment effects
given it is likely that the majority of workers
will come from within this study area.
This study area is presented in the baseline
predominantly for context. This area is used
to assess the significance of one effect –
Regional Context South East, East and
trade diversion from other theme parks. This
Area (RCA) London
is because the majority of other top theme
parks in the UK are also located within the
RCA.
England, Great Britain,
Due to the nationally significant nature of the
United Kingdom
National Area London Resort, some socio-economic effects
(depending on data
need to be considered at a national level.
source availability)
CONSTRUCTION PHASE
Employment generation and effects on businesses in the supply chain
The London Resort is expected to support a large construction workforce. To
understand the impact of this, it is important to understand the existing construction
employment and construction workforce availability.
Number and proportion of construction workers
In 2019, there were 17,300 working age residents in the CSA that were employed in
construction; 8.5% of the total residential workforce. The LCA had 361,000 residents
employed in the construction workforce, accounting for 3.8% of the residential
workforce. Within the LCA, the largest individual supply of construction workers of any
Local Authority within 60-minutes of London Resort is in Newham. Newham is home to
20,300 construction workers3 and has an average peak hour commute time to the
Project Site of 33-minutes by car and 44-minutes by public transport.
By comparison, the SRCA had 9.3% of its total workforce employed in construction, the
RCA had 7.4% and the UK had 7.2%, showing that the local study areas have a higher
prevalence of construction workers than the larger / further afield study areas. This is
2
Travel time data for car and transit modes of travel are sourced from the Google Maps distance matrix API. For PT
travel times, Ebbsfleet International or Tilbury (whichever is closer for each MSOA) is taken as the end point of the
journey. It has then been assumed that the onward transfer from Ebbsfleet and Tilbury to the site will take 10
minutes. These assumptions have been made in order to provide more realistic commutable labour market zones for
consideration, because the travel time from both Ebbsfleet and Tilbury to the site will be considerably improved in
the Future Baseline as a result of the scheme. The simplistic assumptions made here are illustrative at this stage
(although deemed likely to be materially appropriate for these purposes) and may be refined for the ES.
3
ONS, Annual Population Survey, 2019
7.2-2
THE LONDON RESORT PRELIMINARY ENVIRONMENTAL INFORMATION REPORT
likely to reflect the scale of construction activity that has taken place in these areas
historically, placing a larger requirement for a construction workforce, and making the
construction profession more attractive to residents.
Working age residents employed in construction, January to December 2019
Working age residents Total workforce % of employed residents
employed in construction working in construction
CSA 17,300 203,000 8.5%
SRCA 161,000 1,723,100 9.3%
LCA 390,000 4,330,600 8.3%
RCA 913,700 12,396,300 7.4%
UK 2,335,900 32,551,900 7.2%
Source: ONS, Annual Population Survey, 2019; Volterra calculations
Sub sectors of construction employment
In 2018, the LCA had 221,500 workplace based construction workers and the CSA had
13,010 workplace based construction workers – accounting for 4.5% and 7.8% of the
LCA and CSA total workplace based workers respectively. 27% of these worked in
electrical, plumbing and other construction installation activities. A further 24% worked
in the construction of residential and non-residential buildings. These two subsectors
were the largest in terms of construction employment in the SRCA, LCA, RCA and GB.
The CSA appears to have a large proportion of their workplace construction workforce
employed in other specialised construction activities (19%) compared to the SRCA, LCA,
RCA and National levels (13%, 8%, 8% and 11% respectively).
Construction sub-sector employment, 2018
CSA SRCA LCA RCA GB
Electrical, plumbing and 3,500 27% 28% 53,000 24% 25% 26%
other construction
installation activities
Construction of 3,100 24% 23% 64,000 29% 28% 24%
residential and non-
residential buildings
Building completion and 1,900 14% 16% 32,000 14% 16% 16%
finishing
Construction of other civil 600 4% 6% 16,000 7% 8% 9%
engineering projects
Development of building 500 4% 7% 26,000 12% 10% 7%
projects
Construction of roads and 200 2% 5% 8,500 4% 4% 4%
railways
Demolition and site 800 6% 2% 3,000 1% 1% 2%
preparation
7.2-3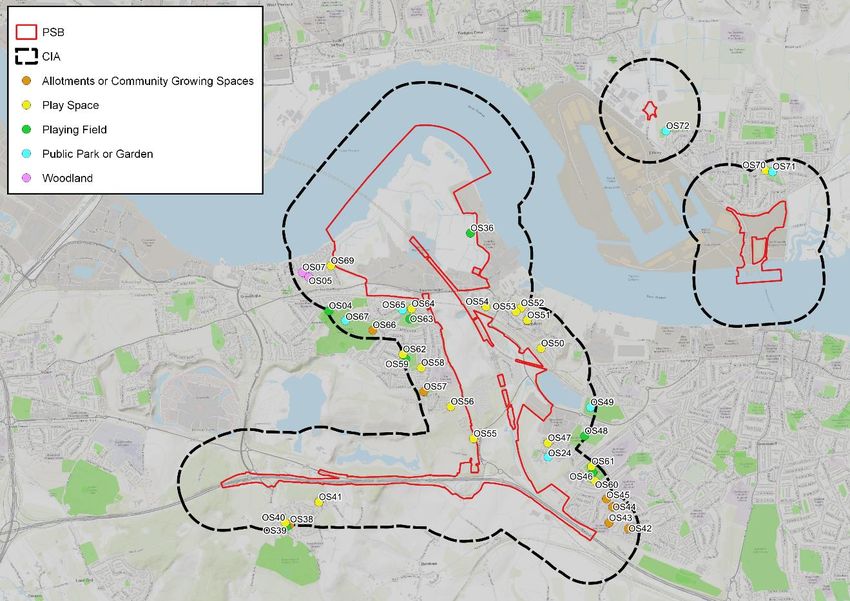
PRELIMINARY ENVIRONMENTAL INFORMATION REPORT THE LONDON RESORT
CSA SRCA LCA RCA GB
Construction of utility 30 0% 0% 800 0% 1% 1%
projects
Other specialised 2,500 19% 13% 18,500 8% 8% 10%
construction activities
n.e.c.
Total construction 13,0004 100% 100% 221,500 100% 100% 100%
workforce
Total workforce 163k 1.4m 4.9m 12.4m 30.8m
% of total workforce 7.8% 6.8% 4.5% 4.7% 4.8%
employed in construction
Source: ONS, Business Register and Employment Survey, 2018.
Construction business counts by size
In 2019, there were 3,200 construction firms in the CSA, accounting for 22% of all firms.
This is a higher proportion than the SRCA (19%) and substantially higher than the
regional and national comparators (13%).
Construction business counts, 2019
Construction firms All firms Proportion of all firms
CSA 3,200 14,800 22%
SRCA 26,600 143,500 19%
RCA 154,700 1,208,900 13%
UK 343,700 2,718,400 13%
Source: ONS, UK Business Counts, 2019. Note: due to data availability, LCA estimates have been excluded
due to unreliable data. An approximation will be investigated further for DCO application.
In 2019, 96% of construction firms in the CSA were micro firms (firms with less than 10
employees), broadly in line with the SRCA, RCA and UK comparators (95.4%, 95.6% and
94.4% respectively). The CSA has a slightly smaller proportion of medium firms (0.3%)
compared to the other geographies, but 0.2% of firms are large firms, compared to
0.1% in all other geographies.
Construction businesses by size (number of employees), 2019
CSA SRCA LCA RCA UK
Micro (0 to 9) 96.0% 95.4% 96.0% 95.6% 94.4%
Small (10 to 49) 3.6% 4.0% 3.5% 3.8% 4.9%
Medium (50 to 249) 0.3% 0.5% 0.5% 0.4% 0.6%
Large (250+) 0.2% 0.1% 0.1% 0.1% 0.1%
4
Due to rounding in the original datasets, this total does not match that of Table 7.2.2
7.2-4
THE LONDON RESORT PRELIMINARY ENVIRONMENTAL INFORMATION REPORT
Source: ONS, UK Business Counts, 2019
Mobility
The construction workforce is known for being highly mobile compared to other
industries. CITB construction workforce mobility regional reports demonstrate that, in
2018/19, approximately half of workers in the South East and East and approximately
a third of workers in London travelled at least 50 miles to work in the 12 months prior
to the survey. Construction workers in the South East travelled an average of 27 miles
from their residence to work, slightly higher than workers in the East (24 miles) and
higher than the UK construction worker average of 18 miles. By comparison, the
average commuting distance across England for all commuters was 9.0 miles, 10.5 in
the South East, 11.5 in the East and 7.8 in London, highlighting that on average
construction workers travel double the distance to work than the average across all
industries.5
Construction workforce mobility in the South East, East and London
South East East London UK
Proportion of construction workforce who travelled 48% 52% 34% *
at least 50 miles from their home to work in the last
12 months
Proportion of construction workforce who travelled 17% 15% 13% 17%
at least 10 miles from their home to work in the last
12 months
Proportion of construction workforce who are 7% 5% 10% 5%
staying in temporary accommodation
Average commuter Construction workers 27 24 16 18
distance (miles) All Industries (National 10.5 11.5 7.8 9.0
Travel Survey) (England)
Sources: CITB Workforce Mobility and Skills Reports (South East, East of England and Greater London),
2019; National Travel Survey FY18. *denotes missing data.
Workforce availability (unemployment, NEETs, churn, claimants)
In 2018, there were 7,900 unemployed people in the CSA, equivalent to 3.9%
employment rate. This is lower than the unemployment rate recorded across all other
geographical comparators. The LCA is estimated to have 251,700 unemployed people
at a rate of 4.6%; higher than the national comparator.
Unemployment and unemployment rate, January to December 2018
Unemployed %
CSA 7,900 3.9%
5
National Travel Survey, Table NTS2212, FY18
7.2-5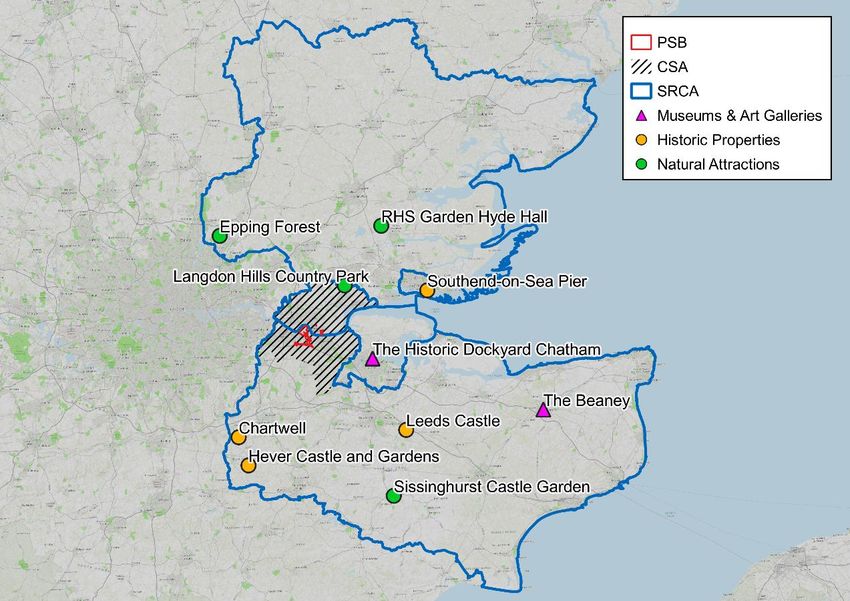
PRELIMINARY ENVIRONMENTAL INFORMATION REPORT THE LONDON RESORT
Unemployed %
SRCA 67,300 4.0%
LCA 251,700 4.6%
RCA 503,100 4.1%
UK 1,374,600 4.3%
Source: ONS, Annual Population Survey, 2018
A young person not in education, employment or training (NEET) provides a potential
source of workforce. NEETs are a market which may benefit from the employment and
skills initiatives offered by the London Resort. Data is not available at the CSA level,
therefore the SRCA is used to proxy the NEET availability. In the three months to
February 2019, there was an average of 3,720 16 to 17 year olds in the SRCA that were
classified as NEET. The majority of these were in Kent (2,070). The count of NEETs as a
proportion of 16 to 17 year olds was 5.1%, which is slightly higher than the RCA (4.9%)
and slightly lower than England (5.5%). The proportional representation of NEETs is
noticeably higher in Medway (6.9%) and Kent (6.4%).
NEETs 2018-19
NEETs NEETS Of which known Of which activity
(aged 16 to 17) (as a proportion of to be NEET not known
16 to 17 year olds)
SRCA 3,720 5.1% 2.6% 2.5%
Kent 2,070 6.4% 2.8% 3.6%
Medway 440 6.9% 2.8% 4.1%
Thurrock 60 1.6% 1.6% 0.0%
Essex 1,150 3.7% 2.4% 1.3%
RCA 23,410 4.9% 2.3% 2.7%
England 61,830 5.5% 2.6% 2.9%
Source: Department for Education, NEET and participation: local authority figures, 2018-2019
Labour market churn (employees moving from one job to another) is also an indication
of the proportion of the workforce that will become available within a given year. As
can be seen from 7.2.14 below, the majority of construction workers in all geographies
expect to move jobs within the next 12 months.
Proportion of construction workforce that expected to be at their current job for less
than 12 months
South East East London UK
Proportion 67% 70% 73% 66%
Source: CITB Workforce Mobility and Skills Reports (South East, East of England and Greater London), 2019
According to an ONS survey of employment, 30% of construction workers are with a
7.2-6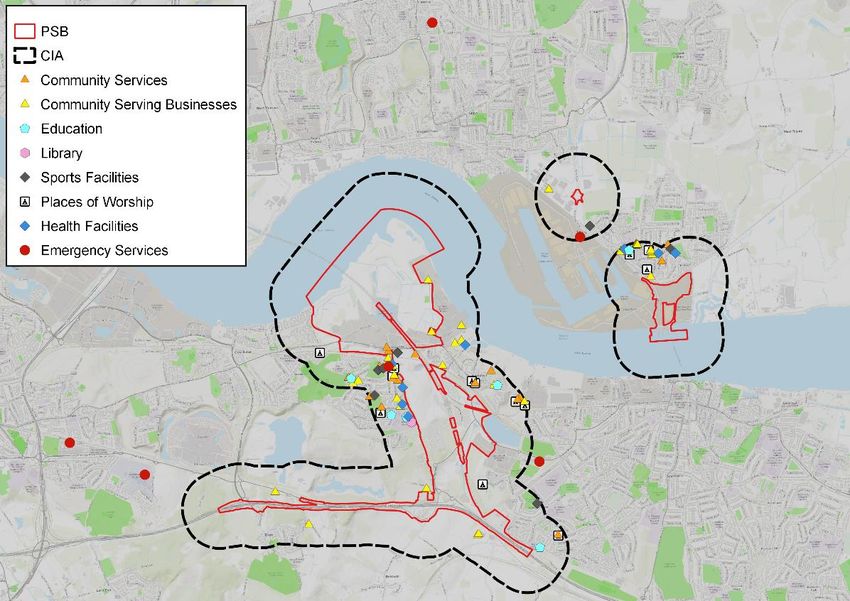
THE LONDON RESORT PRELIMINARY ENVIRONMENTAL INFORMATION REPORT
different employer from that which they had 12 months prior and 5% moved from
being employed to not in employment within 12 months. This is compared to 29% and
6% across all industries, implying that construction worker annual churn is on par with
that of all industries.6
Given the recent pandemic, it is important to check that the most recent statistics of
certain metrics have not been affected in such a way that they would not be
representative of the pre-pandemic state of the baseline. Figure 7.2.1 shows that there
has been a pronounced increase in claimants in all geographies since the beginning of
2020. In order to remove the impacts of the pandemic, therefore, average counts from
each month in 2019 have been used to inform worker availability.
Index of all claimants, January 2013 = 100
250
200
150
100
50
0
January 2013
January 2014
January 2015
October 2015
January 2016
January 2017
January 2018
January 2019
January 2020
October 2013
October 2014
October 2016
October 2017
October 2018
October 2019
July 2013
July 2014
July 2015
July 2016
July 2017
July 2018
July 2019
April 2013
April 2014
April 2015
April 2016
April 2017
April 2018
April 2019
April 2020
CSA SRCA LCA RCA GB
Source: ONS, Claimant Count, 2013 to 2020
In 2019, there were an average of 6,000 claimants in the CSA and 51,000 in the SRCA,
which includes those claiming jobseekers allowance and unemployment related
universal credit. As a proportion of the 16-64 population, claimants account for 2.6% in
the CSA and in the LCA, slightly lower than GB level (2.7%) but higher than the SRCA
(2.4%) and RCA (2.2%).
Claimant count, 2019
CSA SRCA LCA RCA GB
All claimants 6,000 51,000 143,000 344,000 1,101,000
Proportion of 16-64 year olds 2.6% 2.4% 2.6% 2.2% 2.7%
6
ONS, Employee turnover levels and rates by industry section, UK, January 2017 to December 2018
7.2-7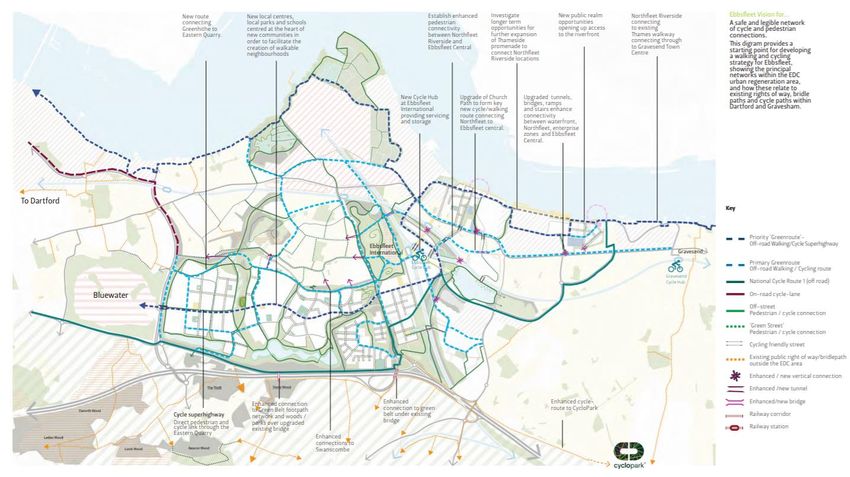
PRELIMINARY ENVIRONMENTAL INFORMATION REPORT THE LONDON RESORT
Source: ONS, Claimant Count, 2020; ONS, 2018 Mid-year population estimates
Future baseline – construction employment
In 2019, the Construction Skills Network estimated that 168,500 UK construction jobs
would be created between 2019 and 2023, reaching 2.79 million in 2023. This equates
to 0.5% annual growth, in line with the whole economy average.7 The annual growth is
extrapolated to 2024 to provide estimates for the peak year of construction. Table
7.2.11 below displays the growth in each relevant region.
Construction employment growth 2019-2023
Construction jobs Total construction Growth Annual 2024
required (2019 to 2023) jobs 2023 (2019 – 2023) growth
South East 13,200 429k 3.9% 0.8% 432k
East of England 24,550 250k 2.0% 0.4% 251k
Greater London 17,800 453k 4.8% 0.9% 457k
UK 168,500 2.79m 2.6% 0.5% 2.8m
Source: CITB, Construction Skills Network forecasts 2019-2023, 2019; Volterra calculations.
Further work will be done for the DCO application submission to consider the possible
construction workforce requirements of the Ebbsfleet Garden City and Lower Thames
Crossing, as it will be important to consider the combined impact of these three major
developments within the future baseline to inform the assessment.
Labour market, skills and training
The London Resort will provide a valuable opportunity to raise the qualifications of
construction workers, providing upskilling and training opportunities. To assess the
impact of this, the existing level of skills and training in the construction labour market
need to be understood.
Resident qualifications
The qualification levels of the workforce within specific industries are not available. The
qualifications of the whole resident workforce therefore provide an indication of likely
construction qualifications, since construction workers make up part of the overall
residential population. In 2019, only 33% of CSA residents were qualified to NVQ4+
level, comparable to the SRCA (35%) but lower than the RCA (46%) and the UK (40%).
Of all CSA residents, 9% had no qualifications- slightly higher than the SRCA and UK
levels (8%) and higher than the RCA (7%). These statistics imply that working residents
7
Construction Skills Network forecasts 2019-2023, 2019
7.2-8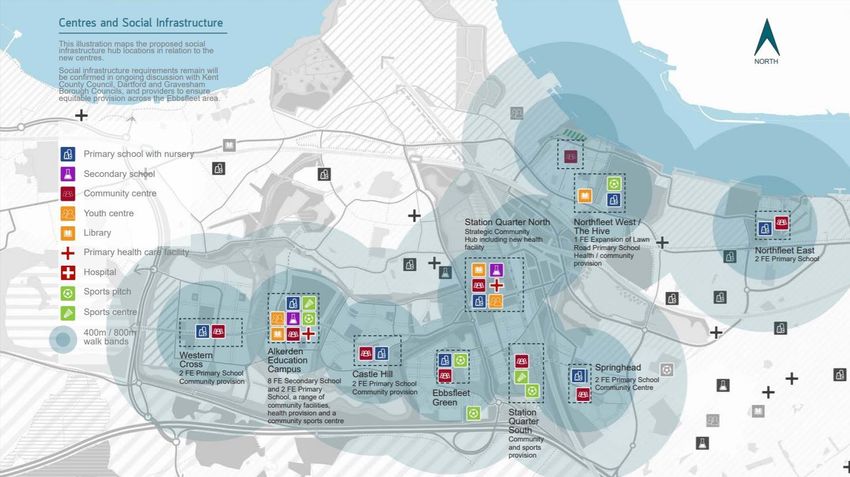
THE LONDON RESORT PRELIMINARY ENVIRONMENTAL INFORMATION REPORT
of the CSA are qualified to a lower level than other geographical comparators.
Resident qualifications, January to December 2019
CSA SRCA LCA RCA UK
NVQ4 or above 33% 35% 45% 46% 40%
NVQ3 or above 52% 54% 61% 62% 58%
NVQ2 or above 72% 73% 75% 78% 76%
NVQ1 or above 83% 85% 84% 87% 86%
Other Qualifications 7% 6% 8% 7% 7%
No Qualifications 9% 8% 8% 7% 8%
Source: ONS, Annual Population Survey, 2019
Workplace qualifications
Table 7.2.13 below shows qualifications of the whole workforce across the various
study areas, not specific to construction (which is detailed in the following section),
from the Census 2011, which is the most recent reliable and comprehensive source
available. This shows that 23% of workers in the CSA are qualified to level 4 and above
– far lower than the RCA (40%) and England (35%). On the other hand, 19% of workers
in the CSA are qualified to level 1 – far higher than the RCA (13%) and England (14%).
The CSA also has a larger proportion of workers that have no qualifications (13%) than
Regional (9%) and national (10%) comparators, but marginally more with
Apprenticeships or other qualifications (11% in comparison to 9% across England). This
implies that workers in the CSA are generally qualified to a less high level than the
regional and national comparators.
Workplace qualifications, 2011
No Level Level Level Level 4 Apprenticeships and
qualifications 1 2 3 and above other qualifications
CSA 13% 19% 20% 14% 23% 11%
RCA 9% 13% 15% 13% 40% 10%
England 10% 14% 17% 15% 35% 9%
Source: ONS, 2011, Census. Note: due to data availability, LCA and SRCA estimates have been excluded due
to unreliable data. An approximation will be developed for DCO application.
Construction qualifications
The most recent source for workplace based qualifications by industry is also the 2011
Census. This shows that, in 2011, 14% of construction workers in the CSA were qualified
at a Level 4 or above (degree level qualification or higher) – lower than the RCA (18%)
and UK (17%). All three geographical areas have 13% of construction workers with no
qualifications. Comparing this with the qualifications across the whole workforce shows
7.2-9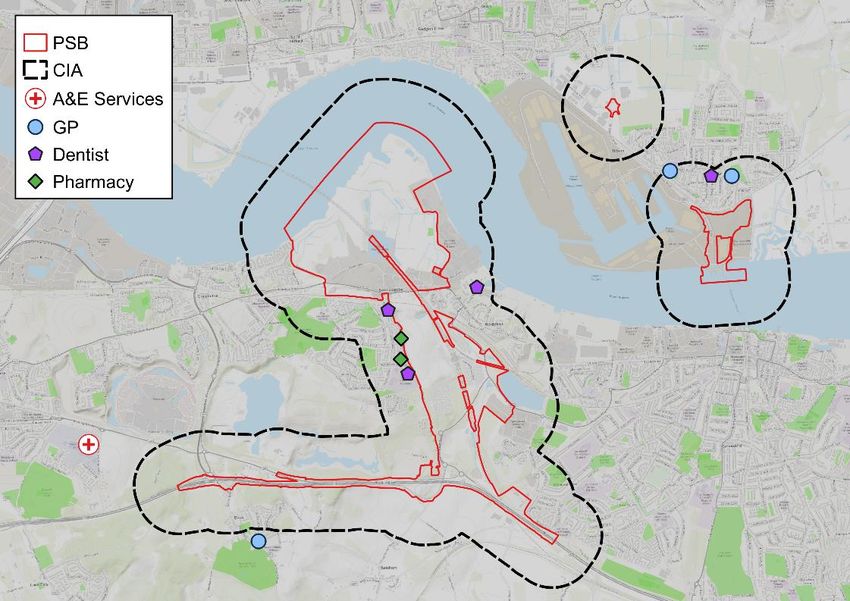
PRELIMINARY ENVIRONMENTAL INFORMATION REPORT THE LONDON RESORT
that construction workers are similarly likely to have no qualifications, but considerably
less likely to have Level 4 or above level qualifications. This is further accentuated by
the lower rate of higher level qualifications in the CSA, which is true both generally
across workers, but also specifically within the construction industry. Apprenticeships
are a more prevalent form of qualification across the construction industry than the
national average across all sectors, and the CSA’s rate of qualification is on par with the
national and regional levels.
Construction qualifications, 2011
CSA RCA UK
Level 4 or above 14% 18% 17%
Level 3 17% 15% 17%
Level 2 20% 17% 17%
Level 1 19% 16% 16%
Apprenticeship 18% 19% 19%
No Qualifications 13% 13% 13%
Source: ONS, 2011, Census. Note: due to data availability, LCA and SRCA estimates have been excluded due
to unreliable data. An approximation will be developed for DCO application.
Construction worker incomes
The Annual Survey of Hours and Earnings shows that as of 2019, construction workers
within the CSA earned an estimated annual income between £38,300 (residence based)
and £38,500 (workplace based).8
The residence-based annual income of construction workers in the CSA, at £38,300, is
slightly lower than the SRCA (£39,400) and RCA (£39,300), but higher than the
corresponding national average (£36,500). In contrast, the workplace-based annual
income of construction workers in the CSA, at £38,500, is higher than that of any other
study area.
Across all geographies and whether residence- or work-place based, the construction
industry annual incomes are higher than the average across all industries.
Annual incomes of construction workers, 2019
Residence based Workplace based
Construction All industries Construction All industries
CSA £38,300 £31,900 £38,500 £32,000
8
Annual income estimates for construction workers are obtained by calculating the income differential between the
weekly earnings of the construction industry and all industries. In order to factor in the seasonality of construction
incomes, the income differential is based on a 12-month average of weekly earnings. The differential is applied to
annual incomes for relevant study areas from ASHE.
7.2-10THE LONDON RESORT PRELIMINARY ENVIRONMENTAL INFORMATION REPORT
Residence based Workplace based
Construction All industries Construction All industries
SRCA £39,400 £32,800 £36,100 £30,100
RCA9 £39,300 £32,800 £37,700 £31,400
UK £36,500 £30,400 £36,500 £30,400
Sources: ONS, EARN03 Average Weekly Earnings, 2019; Annual Survey of Hours and Earnings, 2019. Note:
due to data availability, LCA estimates have been excluded due to unreliable data. An approximation will
be developed for DCO application.
Construction, Planning and the Built Environment Apprenticeship starts
According to the Department for Education, there were 140 starts in the CSA in
construction, planning and the built environment in the academic year 17/18. Starts in
this sector equated to 6% of all apprentices in the CSA for that academic year, in line
with England (6%), slightly higher than the RCA (5%) and slightly lower than the SRCA
and South East LEP (SE LEP) (7%). The number of starts has been slowly rising over
time; there were 75% more starts in 17/18 in the CSA than in 14/15. Growth in starts
over time has also been observed at the other geographies, but the growth was fastest
in the CSA.
In 17/18, there were 70 apprenticeship achievements in the CSA. Over the period
14/15 to 17/18, the CSA has seen an annual average achievement rate of 48%. This is
slightly higher than the RCA (47%), SRCA and SE LEP (44%) and slightly lower than the
England level (51%).
Apprenticeship starts in construction, planning and the built environment,
academic years 14/15 to 17/18
14/15 15/16 16/17 17/18
Starts Starts Starts Starts % of all Achieve Annual average
starts ments achievement rate
(14/15 to 17/18)
CSA 80 110 110 140 6% 70 48%
SRCA 1,100 1,300 1,370 1,600 7% 800 44%
SE LEP 1,270 1,460 1,550 1,770 7% 880 44%
RCA 4,920 5,870 5,710 6,630 5% 3,150 47%
England 18,390 21,560 21,390 22,870 6% 12,540 51%
Source: Department for Education, 2019
Future baseline – construction labour market, skills and training
The Construction Skills Network forecast stated that the most in demand jobs over the
9
London has been excluded from the RCA to avoid skewing the earnings data.
7.2-11PRELIMINARY ENVIRONMENTAL INFORMATION REPORT THE LONDON RESORT
2019-2023 period (in absolute terms) would be: other construction process managers
(3,420), other construction professional and technical staff (3,260) and wood trades
and interior fit-out (2,380). In terms of base 2019 employment, the biggest
requirements were predicted for scaffolders (3.1%), logistics personnel (2.6%), and
plant operatives (2.3%).10
Crime levels
Concerns are often raised on major projects that the presence of a large construction
workforce can affect crime levels. The crime baseline in the CSA, is therefore
considered here.
National crime data
Table 7.2.17 below shows that there were 114 crime incidents per 1,000 population in
2019 in the CSA, a 35% higher prevalence of crime than the average across England and
Wales (84 per 1,000). The type of crime with the highest rate in the CSA was violence
without injury (20 per 1,000) which was almost double the national rate of 11. For many
types of crime, the CSA is in line with, or only slightly higher than England and Wales
rates, however criminal damage and arson, shoplifting, stalking and harassment,
vehicle offences and violence without injury are all higher in the CSA than the national
rate.
Crime incidents per 1,000 population, year ending December 2019
CSA England and Wales
All other theft offences 9 8
Bicycle theft 1 1
Burglary 7 6
Criminal damage and arson 13 9
Death or serious injury caused by illegal driving 0 0
Drug offences 2 3
Homicide 0 0
Miscellaneous crimes against society 3 2
Non-residential burglary 2 2
Possession of weapons offences 1 1
Public order offences 9 7
Residential burglary 5 4
Robbery 1 1
Sexual offences 3 3
Shoplifting 9 6
Stalking and harassment 12 8
Theft from the person 1 2
Vehicle offences 12 7
10
Construction Skills Network forecasts 2019-2023, 2019
7.2-12THE LONDON RESORT PRELIMINARY ENVIRONMENTAL INFORMATION REPORT
CSA England and Wales
Violence with injury 10 9
Violence without injury 20 11
Total 114 84
Source: ONS Crime Statistics, 2019
Data from the 2019 Index of Multiple Deprivation shows that Dartford, Gravesham and
Thurrock collectively rank within the top 25% most deprived areas when it comes to
crime.11 Individually, Dartford and Gravesham respectively rank as the 6th and 19th most
deprived local authorities in terms of crime (out of 317 local authorities), whereas
Thurrock ranks 75th on that list. In comparison to other local authorities, the CSA
therefore performs particularly poorly when it comes to crime.
Crime over time
Over time, the figure below (Figure 7.2.2) shows that whilst crime levels per 1,000
population in the CSA have generally moved in the same direction as the corresponding
trends exhibited by both the RCA and nationally (both rising in the past three years),
there has been a relatively faster increase in the rate of crime in the CSA since 2016
than other comparators, indicating a persistently more pronounced problem with
crime in the CSA..
11
Index of Multiple Deprivation, 2019 MHCLG
7.2-13PRELIMINARY ENVIRONMENTAL INFORMATION REPORT THE LONDON RESORT
Number of crimes per 1,000 population, 2007 – 2018
120
100
80
60
40
20
0
2007 2008 2009 2010 2011 2012 2013 2014 2015 2016 2017 2018
CSA RCA England and Wales
Source: ONS Crime Statistics, 2018 – Police Force Area Data Tables
Future baseline – crime levels
This report found no data to inform the future baseline, and effects are assessed against
the current baseline levels.
Local healthcare
The large construction workforce supported by the London Resort could require local
healthcare services in the form of GPs, dentists, pharmacies and emergency care.
Existing healthcare provision is therefore considered here, so that the relative
additional strain on healthcare provision can be determined.
Primary healthcare
Data on GP provision across the CIA shows that two GP practices are situated within a
500m radius of the site, both of which are located on the north side of the river, whilst
one other GP which lies just outside the CIA boundary is located on the south side, as
shown in Figure 7.2.3. Across all three GPs, a total of approximately 42,200 patients are
currently registered, and are served by 9.4 FTE practitioners. This equates to a ratio of
4,500 patients for every GP FTE. There are a total of 178 FTE GPs across the CSA, which
serve over 420,000 patients, resulting in a ratio of 2,400 patients for every GP FTE. The
CSA, but the CIA in particular, therefore has a patient to GP ratio which is considerably
higher than the recommended benchmark set by the Department of Health and Social
7.2-14THE LONDON RESORT PRELIMINARY ENVIRONMENTAL INFORMATION REPORT
Care (DHSC), which currently stands at 1,800 patients per FTE GP.12
GPs in the CIA
GP Name Borough Total Patients Total GP FTEs Patients per GP FTE
Tilbury Health Centre Thurrock 11,500 2.5 4,600
Swanscombe Health Centre Dartford 20,400 5.9 3,400
Sai Medical Centre Thurrock 10,300 1.0 10,300
Total - CIA - 42,200 9.4 4,500
Total - CSA - 420,700 178.0 2,400
Source: NHS Digital – GP Workforce Statistics March 2020
Additionally, two pharmacies have been identified within the CIA. These pharmacies
fall just outside the PSB and are Ackers Chemists Ltd and Swan Valley Pharmacy.
There are four NHS registered dental surgeries that are situated within the CIA. Across
all four surgeries, a total of 14 dental practitioners carry out these dental services. NHS
information on each surgery also indicates that only one of these practices is not taking
in new patients.
Dental practices within the CIA
Dental practice name No. of practitioners Taking in new patients?
Aligndent NK Ltd 5 Yes
Hews House 1 No
Elite Dental Studio 4 Yes
Patiali Limited 4 Yes
Total 14 -
Source: NHS Dental Statistics, 2019-20
12
NHS London, 2009. HUDU Planning Contribution Model Guidance Reports.
7.2-15PRELIMINARY ENVIRONMENTAL INFORMATION REPORT THE LONDON RESORT
Healthcare Facilities in the CIA
Sources: Ordnance Survey, Addressbase Premium; Google Maps; Volterra calculations
Emergency healthcare
The nearest A&E to the site is Darent Valley Hospital, which is part of the Dartford and
Gravesham NHS Trust. The Dartford and Gravesham Trust also covers Queen Mary’s
Hospital and Erith & District Hospital, but these do not offer A&E services.
Table 7.2.20 shows the number of A&E attendances in 2018/19 and the percentage of
A&E visits that were admitted, transferred or discharged within 4 hours at the Dartford
and Gravesham Trust. This is compared to that of the three other NHS Trusts falling
under the Kent and Medway CCG that have Accident and Emergency (A&E)
departments. It can be seen that the Dartford and Gravesham Trust is performing
better than two of the other Trusts and slightly better than the national average for
England, with 87% of people being attended to in under 4 hours. No trusts hit the NHS
target of 95% of A&E patients admitted, transferred or discharged within 4 hours,
however it can be seen that this is also the case at the national level, demonstrating
countrywide constraints.
A&E attendances and performance
NHS trust name A&E attendances Percentage admitted, transferred or
2018-19 discharged in 4 hours or less 2018-19
Dartford and Gravesham NHS Trust 132,300 87%
East Kent Hospitals University NHS 221,400 70%
Foundation Trust
7.2-16THE LONDON RESORT PRELIMINARY ENVIRONMENTAL INFORMATION REPORT
NHS trust name A&E attendances Percentage admitted, transferred or
2018-19 discharged in 4 hours or less 2018-19
Maidstone and Tunbridge Wells NHS 183,400 91%
Trust
Medway NHS Foundation Trust 125,900 80%
England 22,367,800 84%
Source: NHS Digital, 2018/19 - Provider level analysis for HES Accident and Emergency Attendances
Future baseline – healthcare
The Dartford Borough Council Infrastructure Delivery Plan13 states that a new primary
healthcare facility is to be provided within Ebbsfleet Garden City (EGC), although it is
unsure of the timing of the delivery. Furthermore, a new primary healthcare facility is
being provided at Stone / Greenhithe area (just outside the CIA) providing new facilities
for three GP practices in order to meet demand from new housing development
nearby. This will be delivered by 2022. The Plan also mentions the potential expansion
at Darent Valley Hospital in response to demand from development, but this is
uncertain.
The Ebbsfleet Implementation Framework will be used by the EDC to shape and support
its plans. The provisional locations of future primary healthcare facilities in the EGC
Framework are shown in Figure 7.2.4. This will help to meet some of the additional
demand that new residents at EGC will impose.
Centres and social infrastructure
13
Dartford Borough Council, 2019, Infrastructure Delivery Plan
7.2-17PRELIMINARY ENVIRONMENTAL INFORMATION REPORT THE LONDON RESORT
Source: Ebbsfleet Development Corporation, Ebbsfleet Implementation Framework Summary, 2017
Effect of temporary construction on the temporary accommodation market
A number of the construction workforce are expected to be non-home based, and will
require temporary accommodation near to the site – usually in the form of tourism
accommodation or private housing. Information on the existing accommodation
market in the CSA (considered to be the location that most non-home based workers
will seek accommodation) has therefore been collected and is presented here. As well
as existing capacity, availability and affordability of the accommodation options need
to be considered. The underlying assumptions with regards to availability and
affordability are outlined for each of the choices below.
Baseline
Tourism accommodation stock
Visit Britain14 reported 4,900 tourism bed spaces in the CSA across hotels, holiday
dwellings and campsites in 2016. Visit Britain15 also reported that hotel bed space
occupancy reached a peak of 63% over 2019 which has conservatively been applied as
a year-round occupancy despite lows of 44%. Analysis suggests that 15% of these bed
spaces will be affordable for construction workers16. In the absence of more
information, the same hotel occupancy and affordability has been applied to holiday
dwellings which is conservative as these are likely to be more affordable (on a per room
per occupied night basis) than hotels.17 For campsites, occupancy rates for English
holiday parks / campsites reached a peak of 70% in 2018 which has conservatively been
applied as a year-round occupancy despite high variability with lows of 11%.18 The same
survey reported that the total cost of holiday accommodation (touring pitch fees, park
fees and park facility fees) was £26, hence all pitches are considered affordable.
Since the 2016 stock audit, the offering of short-term home lettings to visitors has
grown in number and popularity and is considered a strong tourism accommodation
option for construction workers. As such, it has been considered here separately. It is
not clear from the Visit Britain data whether short-term home lettings (via platforms
14
Visit Britain, 2016, Accommodation Stock Audit
15
Visit Britain, 2019, Accommodation Occupancy
16
Under the Construction Industry Joint Council (CIJC) Working Rule Agreement, construction industry workers can
receive subsistence allowances of little over £40 a night to cover accommodation and food and drink. For workers
not subject to the Agreement, workers may be able to afford a higher rate per working day. It is assumed that £40 is
an appropriate basis for determining affordability. Hotel bookings websites in the CSA were used to determine the
average daily rate of local rooms and compared to the affordability threshold. The proportion of average daily rates
that fell within the threshold is the proportion considered affordable. More detail will be available for DCO
application.
17
House of Commons Library, Briefing Paper Number 8395, 26 May 2019, The growth in short-term lettings (England)
18
UK Caravan and Camping Alliance, 2019, Pitching the Value: Economic Benefit Report for Holiday Parks and
Campsites UK
7.2-18THE LONDON RESORT PRELIMINARY ENVIRONMENTAL INFORMATION REPORT
such as Airbnb) are included in their data or, if so, to what extent, so this report has
conservatively halved the identified stock number of rentals found in the CSA in order
to avoid double counting with the Visit Britain data. Further work will be done in
advance of the DCO application to consider this further.
The airdna.co.uk site offers occupancy for each local authority, which has been
averaged to 68% for the whole area to inform availability. For affordability, the site also
offers ADRs which were adjusted to a per bedroom basis and averaged across the area
at £42.20. This was used to inform the assumption that 75% of these might be
considered affordable for construction workers. The site provides average bedrooms
per rental, which was 2.1 across the whole area. It has been conservatively assumed
that there was one bed space per bedroom in these rentals.
Combining together these various sources, it is estimated that there are 580 available
and affordable tourism accommodation bed spaces within the CSA – Table 7.2.21
shows the distribution of these by accommodation type, showing that the vast majority
(over 75%) are in hotels. Short-term home lettings (such as Airbnbs) also form a
considerable proportion of available and affordable stock however (just under 20%).
Tourism accommodation bed spaces in the CSA
Tourism accommodation type Bed spaces
Hotels Bed spaces 4,800
Available and affordable 450
Holiday Dwellings Bed spaces 60
Available and affordable 10
Campsites Bed spaces 10
Available and affordable 10
Home lettings Bed spaces 220
Available and affordable 110
Total available and affordable 580
Sources: Visit Britain, 2016, Accommodation Stock Audit; airdna.co.uk, 2020
Housing market stock – PRS
In terms of the Private Rented Sector (PRS), it is estimated that there are 24,500 PRS
dwellings in the CSA.19 According to the Census,20 there were 2.3 bedrooms per PRS
dwelling and it is assumed that there is one bed space per bedroom. The English
Housing Survey reports that approximately 10% of PRS dwellings across England are
vacant21 and that this has been the case since early 2000s.22 In the absence of more
19
ONS, Subnational dwelling stock by tenure estimates, 2018. These research outputs are not official statistics on
dwelling stock by tenure.
20
Census, 2011, KS402EW and DC4405EW
21
English Housing Survey, 2018
22
MHCLG, 2011, Dwelling Stock Estimates: 2011 England.
7.2-19PRELIMINARY ENVIRONMENTAL INFORMATION REPORT THE LONDON RESORT
localised data, this is used to proxy PRS vacancy rates in the study areas. This vacancy
rate includes natural vacancies which are required to give the market fluidity and allow
it to function. This fluid element is approximated by taking the proportion of dwellings
in the study areas that were living at a different address one year before the survey was
taken (c. 30%)23 and adjusting to a monthly statistic of c. 2%. This leaves a latent
property vacancy rate of c. 8%. In terms of affordability, the Valuation Office Agency
(VOA) release rental market summary statistics, breaking down monthly rent in the PRS
sector by region, administrative area, and number of bedrooms.24 This analysis has
adjusted the data for the study areas to be on a per room per working night basis. 25
These gave mean and median rents per room per working night as shown in Table
7.2.22. Based on these rents, the assumed proportion that will be affordable have been
estimated (as in the table).
Overall, it is estimated that there are 4,540 available and affordable PRS bed spaces
within the CSA.
PRS bed spaces in the CSA
Bed spaces
PRS dwellings 24,500
PRS bedrooms 56,770
Mean rent per room per working night 29
Median rent per room per working night 26
Proportion considered vacant/available (assumption) 8%
Proportion considered affordable (assumption) 100%
Total available and affordable 4,540
Housing market stock – Owner Occupied sector
In terms of the Owner Occupied (OO) sector, it is estimated that there are 106,900 OO
dwellings in the CSA.26 According to the English Housing Survey, 4.3% of OO households
are vacant, and 3% of England OO households moved in the past year.27 This results in
an estimated 1.3% latent capacity in the OO sector. Notably, the profile of construction
workers that would tend to seek this type of accommodation is more senior,
managerial roles. Given this, these workers are most likely to either live by themselves
(in a 1-bed or studio) or to live with their families (who would take up other bed spaces
in the dwelling but are not included in the jobs estimates). Very few would look to buy
and share with another worker(s). Therefore, a conservative ratio of one worker bed
space per OO dwelling has been assumed. The median house price in the CSA is
£296,000, higher than the England rate (£240,000). The median house price to
23
Census, 2011, Table UKMIG011
24
MHCLG, 2018/19, Private rental market summary statistics
25
Where an average of 16 working nights per month has been applied
26
ONS, Subnational dwelling stock by tenure estimates, 2018. These research outputs are not official statistics on
dwelling stock by tenure.
27
English Housing Survey, 2018
7.2-20THE LONDON RESORT PRELIMINARY ENVIRONMENTAL INFORMATION REPORT
affordability ratio in the CSA is 9.1, meaning that a resident on a median income would
need just over nine times their earnings in order to afford a house in the area. This is
higher than the equivalent ratio for England (7.8).28 Overall, it can be deduced that
houses are slightly less affordable in the CSA than the national average. Given the
expected managerial profile of OO seekers (likely on higher than median incomes), it
has conservatively been assumed that half of the dwellings in the CSA will be affordable
for construction workers.
Overall, there are expected to be 1,390 houses available for sale each year in the CSA,
690 of which could be considered affordable, equating to 690 bed spaces.
OO bed spaces in the CSA
Bed spaces
Total privately owned dwellings 106,900
Available for sale each year 1,390
Total available and affordable (assumption) 690
In summary, there are estimated to be 5,820 available and affordable bed spaces within
the CSA, the majority of which (4,540, 78%) are in the PRS sector.
Bed spaces within the CSA
Accommodation type Available and affordable bed spaces
Tourism accommodation 580
Private rented sector housing 4,540
Owner occupied housing 690
Total 5,820
Source: Volterra calculations
Future baseline – temporary accommodation market
The EDC Implementation Development Framework29 outlines, for the six existing
development proposals with consent, that there is maximum consent for over 21,000
sqm of hotel floorspace for five of the six proposals. Of this, 11,000 sqm is at Eastern
Quarry (along the bottom of the CIA) with 5,000 sqm each at Ebbsfleet Green and
Northfleet Embankment West. There is also 147,000 sqm across an (undefined) split of
retail, hotels and leisure in Ebbsfleet Central.
Considerable housing growth is planned in the CSA, some of which will be delivered
before the construction of the London Resort. A proportion of this new housing might
reasonably be assumed to be available and affordable either as OO or PRS options for
construction workers. Similarly, the rise in popularity of short -term, home lettings
(such as Airbnb), coupled with the rise in dwelling stock might feasibly mean that more
28
MCHLG, Median house price to residence based earnings, 2019
29
Ebbsfleet Development Corporation, Ebbsfleet Implementation Framework, 2017
7.2-21PRELIMINARY ENVIRONMENTAL INFORMATION REPORT THE LONDON RESORT
properties or rooms are available via this route.
All of these would contribute towards increased temporary accommodation available
in the future baseline, across all types. However, in order to be conservative, none of
this is assumed to occur nor relied upon. This assessment therefore assesses effects
against the current baseline levels.
Displacement/loss of business and other services
The London Resort will result in the displacement of businesses and services from the
PSB, which may be able to relocate or may be lost. Baseline information on these
existing businesses is presented here. Limited information is known at this time about
the employment supported by the current uses on site and so estimates are made,
which are described in this section. A land referencing exercise is being undertaken
which will provide more detailed information to inform the DCO application
submission.
Baseline
Estimating businesses located within the PSB
The employment within the PSB has been estimated based on two methods:
Using ONS data from the Business Register and Employment Survey which has
estimates of employment by industry at the LSOA level;30 and
Using data from the Valuation Office Agency allows the floorspace that lies within the
red line to be calculated by use type. The floorspaces can then be converted into
employment estimates using typical employment densities.
ONS BRES – LSOA method
The LSOAs are small areas used for collecting data by the ONS. Due to the size of these
areas, they do not perfectly match with boundaries, such as the PSB. For example, one
LSOA (Dartford 002D) covers most of the red line area and so is used as the best-fit
employment estimate for the existing level of employment. There are other LSOAs
which overlap with the red line, but since they do so by only a proportionally small
amount, including them would likely lead to an overestimate of employment.
Ebbsfleet International Station lies within with the PSB. The employment at the station
would not be displaced as a result of the London Resort. While that is the case, it is
difficult to adjust the employment estimate for the station without knowing the exact
split of employment uses there. It should therefore be noted that the employment
30
Lower Layer Super Output Area (LSOA) is a geospatial statistical unit used in England and Wales to facilitate the
reporting of small area statistics. They have a minimum population of 1,000 with a mean size of 1,500.
7.2-22THE LONDON RESORT PRELIMINARY ENVIRONMENTAL INFORMATION REPORT
estimate may overstate onsite jobs by including those related to Ebbsfleet station. This
is also true for other parts of the PSB where land uses are potentially included within
the estimates presented here but the uses themselves would not be displaced.
Swanscombe town centre is outside of the PSB but also falls within the LSOA; likely
town centre uses are therefore removed from the LSOA employment estimate. In
particular, this means that the following industries are excluded:
Retail trade, except of motor vehicles and motorcycles (95 FTE jobs); and
Food and beverage activities (35 FTE jobs).
BRES is used to estimate jobs contained within the LSOA. In 2018, the latest date for
which BRES data is available, Dartford 002D LSOA supported 1,620 jobs,31 equivalent to
1,420 full-time equivalent (FTE) jobs.32
After adjusting for town-centre related employment (in Swanscombe), the LSOA is
estimated to have 1,445 jobs, equivalent to 1,295 FTEs.
The issue with this approach is that any jobs on the Essex Project Site are excluded and
there may be additional jobs included on the Kent Project Site because the statistical
area does not match exactly with the PSB, but conversely it also likely includes jobs
which are located within the LSOA but not within the PSB.
VOA – floorspace method
An alternative approach is to review the VOA data, which lists all commercial property
identified within the PSB, including their floorspace and use type. This dataset confirms
that the majority of the floorspace lies within the northern part of the Dartford LSOA,
with limited businesses on the Essex Project Site, providing confidence that the first
estimate based on ONS data would have identified the vast majority of employment.
Table 7.2.25 summarises the total commercial floorspace by use type within the PSB.
For the reasons outlined above, commercial floorspace at Ebbsfleet International
station is removed.
Floorspace within the PSB
Use type Floorspace (NIA, m2)
Retail, store or showroom 2,300
Industrial / manufacturing 11,200
Light industrial 7,800
Storage 51,700
31
Business Register and Employment Survey. ONS Crown Copyright Reserved [accessed from Nomis on 18 May 2020]
32
A full-time equivalent job is a measure that adjusts for the number of hours worked. For these purposes it is
assumed that one ‘part-time’ job is equivalent to half of a full-time job.
7.2-23PRELIMINARY ENVIRONMENTAL INFORMATION REPORT THE LONDON RESORT
Use type Floorspace (NIA, m2)
Food and beverage 200
Offices 1,500
Total 70,100
Source: Valuation Office Agency
There is a total of approx. 70,100m2 (NIA) of floorspace within the PSB. Typical
employment densities are then applied to each use type. For example, there is typically
between 8m2 and 13m2 of floorspace for every office-based FTE employee,33 meaning
that 1,500m2 of NIA office floorspace might support between 115-190 employees.
The typical densities used are in line with the Employment Densities Guide. It should
be noted that applying densities to each use type is inexact as densities can vary
significantly within each use class. A range of possible values is therefore estimated
rather than a single best-guess value.
Applying densities in this way it is estimated that there are between 1,330 and 1,870
FTEs (equating to between 1,520 and 2,140 jobs) within the red line. This is above the
estimate of c.1,295 FTE employees (1,445 jobs) using the BRES LSOA method. While
some of this is due to the properties that lie outside of the single LSOA used in the BRES
estimate, occupancy is also likely to be an issue. The floorspace approach assumes that
each property in question is fully occupied. In reality, there will be some degree of
under-occupancy and some property might even be vacant for significant periods.
Estimate FTE jobs by use type within the PSB
Use type FTE jobs
Retail, store or showroom 115 - 150
Industrial / manufacturing 360
Light industrial 190
Storage 560 – 1,000
Offices 115 – 180
Total (FTEs) 1,330 – 1,870
Sources: Valuation Office Agency; Employment Densities Guide
The VOA approach assumes that all businesses are occupied at full occupancy, which is
unlikely given the Applicant’s understanding of the Project Site. However, in order to
be conservative, it is assumed that the Project Site currently supports 1,330 FTEs (1,520
jobs), the lower of the VOA estimate but higher than the LSOA estimate. Land
referencing work is underway to understand the businesses on site and the number of
jobs supported. This will be provided in the ES. This is comparable with a range of
employees provided to the Planning Inspectorate by Bramwell Associates34 (who
33
Homes and Community Agency (2015), Employment Densities Guide
34
Reply to written question - 07 July 2020 https://infrastructure.planninginspectorate.gov.uk/projects/south-
east/the-london-resort/?ipcsection=advice&ipcadvice=60e9228ac3
7.2-24THE LONDON RESORT PRELIMINARY ENVIRONMENTAL INFORMATION REPORT
represent owners and businesses likely affected) in June 2020 of between 1,000 and
1,500 employees.
Future baseline - businesses
The estimates of current workforce within the PSB are viewed likely to be conservative
in terms of job numbers which might be displaced. All users within the red line are
aware of the status of the project, and within the estimates full occupancy is already
assumed. It is therefore viewed unlikely that any additional workforce over and above
the existing baseline estimated could be supported by the present uses, and so the
future baseline position is assumed to remain the same as the current baseline. The
effects are therefore assessed against the current baseline levels.
The EDC Implementation Development Framework outlines, for the six existing
development proposals with consent, that there is maximum consent for over 600,000
sqm of office floorspace. Of this, 120,000 sqm is at Eastern Quarry (along the bottom
of the CIA) and 450,000 sqm is in Ebbsfleet Central (in the centre of the CIA). In
Northfleet Embankment West, 46,000 sqm is allocated to B1 (office), B2 & B8
(industrial). In Northfleet Embankment East, 87,550 is allocated across B1, B2 & B8. In
terms of retail space, there is expected to be a maximum of 28,000 sqm delivered
across five of the six proposals (26,000 sqm at Eastern Quarry) and 147,000 sqm across
an (undefined) split of retail, hotels and leisure in Ebbsfleet Central.35
In the future baseline it is therefore likely that in terms of quantum, the new floorspace
delivered will more than offset the 70,100m2 (NIA) of floorspace within the PSB which
is lost as a direct result of the London Resort. However it is known that some of the
uses currently on the site are bespoke to the location (some are known as ‘bad
neighbour’ uses), and therefore in order to appropriately assess the loss of floorspace
as a result on the London Resort, the loss of the 70,100m2 (NIA) of floorspace within
the PSB is considered.
Displacement/loss of community uses
The London Resort will result in the displacement or disruption (potentially indirectly
through other effects) of some community uses. Baseline information on these existing
community uses is presented here.
Community uses within the PSB and CIA
Community uses
This section uses a variety of sources to identify the potential community uses located
within the PSB and then more widely within the CIA. 7.2.77 shows a breakdown of the
facilities within the PSB and CIA by type. Their locations across the PSB and CIA are also
shown in Figure 7.2.5.
35
Ebbsfleet Development Corporation, Ebbsfleet Implementation Framework, 2017
7.2-25PRELIMINARY ENVIRONMENTAL INFORMATION REPORT THE LONDON RESORT
Using Addressbase Premium, four potential community facilities are identified as being
located within the PSB: a public convenience facility, Essandor Sports and social club,
London Bus & Truck Ltd, and a rifle range. Being within the PSB, these uses are at risk
of displacement. At this stage we have been unable to identify any further detail about
these. Further work will be done in advance of the DCO application submission to
determine their presence (or not) and the extent to which they are facilities currently
used by the community.
Some 80 potential community facilities have been identified across the CIA; 39 of these
are community serving businesses, 18 are community services, 13 are places of
worship, and 7 are sports facilities. There are also 2 emergency services and a library.
Community serving businesses can include: post office, market (indoor/outdoor),
public house/bar/nightclub, restaurant/cafeteria, shop, and other licensed premise
vendors. Community services are defined as any facility that can be classed as a
public/village hall, public convenience centre, church hall/religious meeting place, and
community service centre/office.
Current provision of community facilities
No. of community facilities/services provided
Type
CIA PSB
Community Services36 18 2
Community Serving Businesses37 39 1
Places of Worship 13 0
Library 1 0
Emergency Services 2 0
Sports Facilities 7 1
Total 80 4
Sources: Ordnance Survey, Addressbase Premium; Google Maps; Volterra calculations
: Community Facilities / Services within the PSB and CIA
36
Community Services have been defined as any facility that can be classed as a public/village hall, public convenience
centre, church hall/religious meeting place, and community service centre/office.
37
Community Serving Businesses includes the following entities – post office, market (indoor/outdoor), public
house/bar/nightclub, restaurant/cafeteria, shop, and other licensed premise vendor.
7.2-26THE LONDON RESORT PRELIMINARY ENVIRONMENTAL INFORMATION REPORT
Sources: Ordnance Survey Addressbase Premium; Google Maps
Research suggests that it is best practice for one community centre to be provided for
every 7,000 – 11,000 people residing in a community.38 Earlier research by the same
authors suggested that the catchment population required to sustain one community
centre, in terms of viability, is approximately 4,000 people.39 Within the CIA there are
eight public / village halls or other community facilities (which are contained within the
‘community services' category), and the area has a population of 69,500; this means
that there is a community centre per approximately 8,700 residents in the area, within
the optimum range indicated by research for both financial viability and best practice.
The CIA is within the 5th decile (where 1st is the most deprived) on the IMD’s barriers
to access to housing and services subdomain, indicating that the area has average levels
of access to public services.40 Data indicates that problems are more likely to be
associated with homelessness and housing affordability, rather than access to services
(refer to housing baseline below).
In terms of emergency services, A&E services are located towards the lower western
area of the London Resort (refer to the health baseline). There are two police stations
– one is located in the CIA and on the north side of the river (Tilbury Police Station) and
the other is located on the south side of the river on the eastern part of the London
Resort (North Kent Police Station), just outside the CIA. There are also three fire stations
in the vicinity of the London Resort – one is within the CIA whilst the other two are
38
Barton, Grant and Guise, 2010, Shaping neighbourhoods for local health and global sustainability
39
Barton, Grant and Guise, 2003, Shaping Neighbourhoods: A Guide for Health, Sustainability and Vitality
40
MHCLG, 2019, English Index of Multiple Deprivation
7.2-27You can also read