APPENDIX A RETAIL SUSTAINABILITY ASSESSMENT - City of Wanneroo
←
→
Page content transcription
If your browser does not render page correctly, please read the page content below
APPENDIX A   RETAIL SUSTAINABILITY ASSESSMENT

                                                                                      URBIS
                         20180424 PA1313 - LOT 408 (NO. 19) NEERABUP ROAD CLARKSON ACTIVITY
APPENDICES                                                               CENTRE PLAN - FINAL
BUNNINGS CLARKSON
     SITE RETAIL
     SUSTAINABILITY
     ASSESSMENT

     Final Report

4 APRIL 2018
FINAL
PREPARED FOR BWP TRUST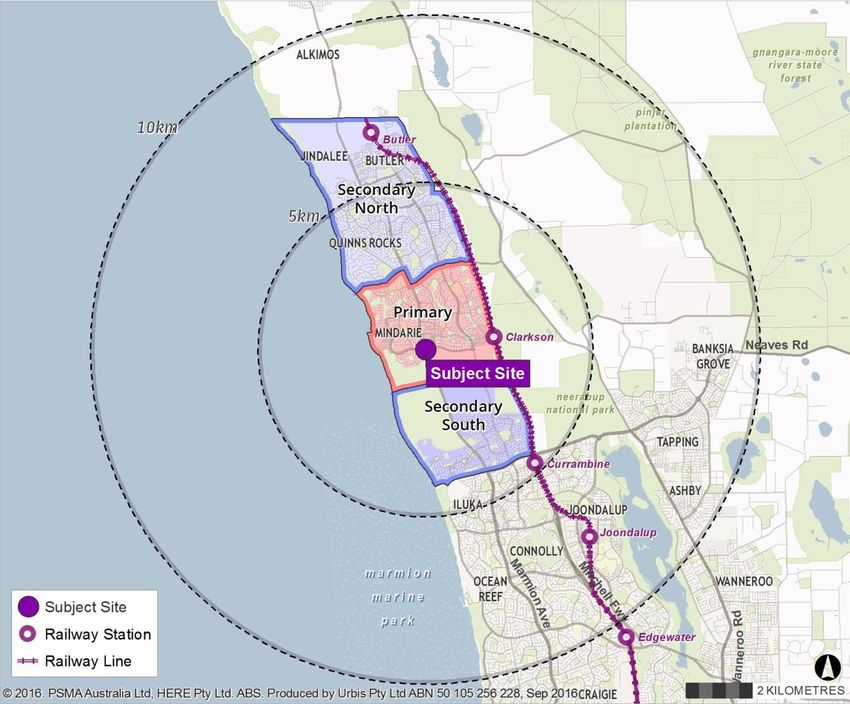
URBIS STAFF RESPONSIBLE FOR THIS REPORT WERE:
Director                    Rhys Quick
Associate Director          Michael Knight
Senior Consultant           Suzanne Turner
Project Code                PA 1313
Report Number               Final Report

© Urbis Pty Ltd
ABN 50 105 256 228

All Rights Reserved. No material may be reproduced without prior permission.

You must read the important disclaimer appearing within the body of this report.

urbis.com.au
CONTENTS

TABLE OF CONTENTS
Introduction ........................................................................................................................................................ 1
1.      Property Attributes & Proposed Development ...................................................................................... 3
1.1.    The Subject Site .................................................................................................................................... 3
1.1.1. Regional Context .................................................................................................................................. 3
1.1.2. Local Context ........................................................................................................................................ 4
1.2.    Planning Framework ............................................................................................................................. 5
1.3.    Proposed Development ........................................................................................................................ 7
2.      Trade Area Profile ................................................................................................................................. 8
2.1.    Trade Area Definition ............................................................................................................................ 8
2.2.    Trade Area Resident Population ........................................................................................................... 9
2.3.    Socio-Economic Profile of Trade Area Residents .............................................................................. 10
2.4.    Trade Area Resident Retail Spend Market ......................................................................................... 10
2.4.1. Retail Spend Per Capita ..................................................................................................................... 11
2.4.2. Total Retail Spend Market .................................................................................................................. 11
3.      Retail Hierarchy .................................................................................................................................. 13
3.1.    Centre Policy....................................................................................................................................... 13
3.2.    Centre Hierarchy ................................................................................................................................. 13
3.3.    Future Retail Developments ............................................................................................................... 15
4.      Economic Need, Demand & Impacts .................................................................................................. 16
4.1.    Proposed Development ...................................................................................................................... 16
4.2.    Assumptions ....................................................................................................................................... 16
4.3.    Market Need & Supportable Scale of Development ........................................................................... 16
4.4.    Turnover Potential of Proposed Development .................................................................................... 16
4.5.    Impact Analysis ................................................................................................................................... 18
4.5.1. Trading Impacts .................................................................................................................................. 18
4.6.    Economic Impacts............................................................................................................................... 21
4.6.1. Methodology ....................................................................................................................................... 21
4.6.2. Construction Phase............................................................................................................................. 22
4.6.3. Operation Phase ................................................................................................................................. 22
5.      Conclusions ........................................................................................................................................ 24
Disclaimer ........................................................................................................................................................ 26

Appendix A                 Catchment Socio-demographics

TABLES:
Table 1.1 ............................................................................................................................................................. 5
Table 1.2 ............................................................................................................................................................. 6
Table 1.3 ............................................................................................................................................................. 7
Table 2.1 ............................................................................................................................................................. 9
Table 2.2 ...........................................................................................................................................................12
Table 3.1 ...........................................................................................................................................................15
Table 4.1 ...........................................................................................................................................................17
Table 4.2 ...........................................................................................................................................................18
Table 4.3 ...........................................................................................................................................................20

URBIS
BUNNINGS CLARKSON RETAIL SUSTAINABILITY
ASSESSMENT FINAL REPORT 030418.DOCX
Table 4.4 ...........................................................................................................................................................20
Table 4.5 ...........................................................................................................................................................22
Table 4.6 ...........................................................................................................................................................23

MAPS:
Map 1.1 ............................................................................................................................................................... 3
Map 1.2 ............................................................................................................................................................... 4
Map 1.3 ............................................................................................................................................................... 6
Map 2.1 ............................................................................................................................................................... 8

CHARTS:
Chart 2.1 ............................................................................................................................................................. 9
Chart 2.2 ...........................................................................................................................................................10
Chart 2.3 ...........................................................................................................................................................11

                                                                                                                                                 URBIS
                                                                           BUNNINGS CLARKSON RETAIL SUSTAINABILITY ASSESSMENT FINAL REPORT 030418.DOCX
CONTENTS
INTRODUCTION
Purpose
Urbis has been engaged by BWP Trust to undertake an independent assessment of the sustainability
demand and impact of a proposed retail development on its former Bunnings Warehouse site at Lot 408
Neerabup Road, Clarkson.
While a specific retail plan has not been finalised at this time, this report considers the impact on the network
of activity centres around Clarkson of a range of mixed use development including up to 10,000 sq.m of
shop-retail floorspace. Separate capacity exercises have established this quantum of space is capable of
being accommodated and could include:
A second-tier supermarket of approximately 2,500 sq.m;
A range of complementary specialty shops and other uses;
Retail showrooms or bulky goods facilities of around 5,000 sq.m.
As prescribed in State Planning Policy 4.2 (SPP 4.2) a Retail Sustainability Assessment is required to
consider the impact of such a development and is to include the following:
6.5 Retail Sustainability Assessment
“A Retail Sustainability Assessment (RSA) assesses the potential economic and related effects of a
significant retail expansion on the network of activity centres in a locality. It addresses such effects from a
local community access or benefit perspective, and is limited to considering potential loss of services, and
any associated detriment caused by a proposed development. Competition between existing businesses
of itself is not considered a relevant planning consideration.”
This is distinct from a Retail Needs Assessment, which provides an assessment of projected future retail
needs for a catchment population. These are intended to form a basis for local planning strategies, and
district or activity centre structure plans 1.
This report presents two options for the development outcome to consider the range of impacts that might
result: one where all 10,000 sq.m is allocated to shop-retail uses (a higher impact outcome) and a second
where shop-retail use is only assumed to be 5,000 sq.m as the other 5,000 sq.m is allocated to non-shop
showroom uses.
Report Objectives
Having regard to the requirements of SPP 4.2 and the economic issues associated with the proposed
development, the RSA report provides an assessment of the:
Market need and demand for increased retail facilities. This will be undertaken in terms of the
requirements of the market as well as the appropriate scale and role of the former Bunnings warehouse
site as a retail-anchored mixed-use node.
Potential trading impact of the proposed retail development on the existing and planned activity centre
hierarchy. Impacts will be assessed in the context of PLUC 5 Shop/Retail floorspace (SHP)
Other economic impacts and community benefits associated with the proposed retail development.
1State Planning Policy 4.2: Activity Centres for Perth and Peel (2010), s 6.2.2. Western Australian Planning
Commission.
URBIS
BUNNINGS CLARKSON RETAIL SUSTAINABILITY ASSESSMENT FINAL REPORT
030418.DOCX INTRODUCTION 1Report Structure
This report includes the following sections:
Section 1 (Property Attributes and Proposed Development) provides an overview of the proposed
retail development and location attributes of the subject site.
Section 2 (Trade Area Profile) outlines an assessment of the trade area market that would be expected
to be served by the proposed retail development.
Section 3 (Retail Supply) details the existing and planned centre hierarchy in the region of relevance to
the proposed retail development.
Section 4 (Economic Need, Demand and Impacts) outlines the assessment of the market need,
demand and impact of the proposed retail development. This includes an estimate of potential retail
turnover of the proposed development and assessment of associated trading impacts on other activity
centres and other economic impacts and community benefits (e.g. employment generation).
Section 5 (Conclusions) outlines the key findings and conclusions of the Retail Sustainability
Assessment.
URBIS
2 INTRODUCTION BUNNINGS CLARKSON RETAIL SUSTAINABILITY ASSESSMENT FINAL REPORT
030418.DOCX1. PROPERTY ATTRIBUTES & PROPOSED DEVELOPMENT 1.1. THE SUBJECT SITE The subject site (site) is located at the northeast corner of Marmion Avenue and Neerabup Road, with a land area of approximately 3.0 ha. The site was previously occupied by a Bunnings Warehouse, the operations of which have recently been relocated to a new site approximately 430 m to the east, leaving the site vacant. This is a strategic site within the Clarkson Activity Centre, adjacent to the Ocean Keys Shopping Centre. BWP Trust is looking to deliver an optimal development outcome reflective of the location and size of site. 1.1.1. Regional Context The site is located within the Clarkson Secondary Activity Centre, within the City of Wanneroo municipal area (see map below). The activity centre is a key regional service centre for the catchment population, with the nearest district level and above activity centres being Currambine District Centre (6 km south), and Butler District Centre (6.5 km north). Higher level activity centres nearby are the well-established Joondalup Strategic Metropolitan Centre (8.5 km south). and the emerging Yanchep Strategic Metropolitan Centre (18.5 km north). Regional Context Map Map 1.1 Source: Urbis 2017 URBIS BUNNINGS CLARKSON RETAIL SUSTAINABILITY ASSESSMENT FINAL REPORT 030418.DOCX PROPERTY ATTRIBUTES & PROPOSED DEVELOPMENT 3
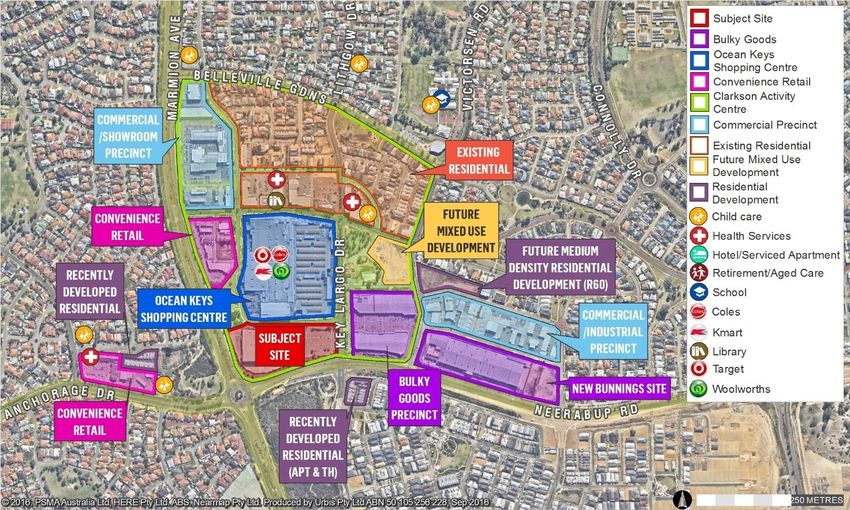
1.1.2. Local Context
Within Clarkson Secondary Centre, the site is located facing Marmion Avenue and Neerabup Road,
immediately south of the existing shop-retail core comprised of Ocean Keys Shopping Centre and a range of
convenience retail developments (see map below).
The site is highly accessible by car and well-exposed to passing trade along Marmion Avenue. Public
transport is provided by bus services to Clarkson Train Station and the surrounding suburbs, with a bus stop
located on the western edge of the site.
Outside of the Ocean Keys Shopping centre, the Clarkson Secondary Centre features a variety of land uses
including a large format retail precinct with the new Bunning Warehouse site, commercial / industrial areas
and commercial / showroom precincts. To the north of Ocean Keys Shopping Centre, Ocean Keys Boulevard
forms a main street environment that incorporates civic, retail and non-retail, and food catering uses.

Subject Site Surrounds                                                                                         Map 1.2

Source: Urbis 2017

                                                                                                                    URBIS

4 PROPERTY ATTRIBUTES & PROPOSED DEVELOPMENT             BUNNINGS CLARKSON RETAIL SUSTAINABILITY ASSESSMENT FINAL REPORT
                                                                                                              030418.DOCX
1.2. PLANNING FRAMEWORK
The current planning framework for the site is summarised in Table 1.1 below.
Planning Framework
State and Local Context Table 1.1
Planning Framework Type Relevance
Perth and Peel@3.5 million Regional Strategy Recognises Clarkson Secondary Centre
2015
Draft North West Sub-Regional Sub-regional Strategy Recognises Clarkson Secondary Centre
Planning Framework 2015
Metropolitan Region Scheme Region Scheme Zoned “Urban”
2017
SPP 4.2: Activity Centres for State Planning Policy Designates Clarkson Secondary Centre
Perth and Peel 2010
City of Wanneroo Town Local Planning Scheme Zoned “Centre”
Planning Scheme No. 2
R-Code subject to agreed Structure Plan
City of Wanneroo Local Local Planning Policy Recognises Clarkson Secondary Centre
Planning Policy 3.2: Activity
Centres
Clarkson Activity Centre Agreed Activity Centre Zoned “Business”
Structure Plan 2012 Structure Plan
Source: Urbis 2017; WAPC 2015, 2017; City of Wanneroo 2012; State of Western Australia 2010
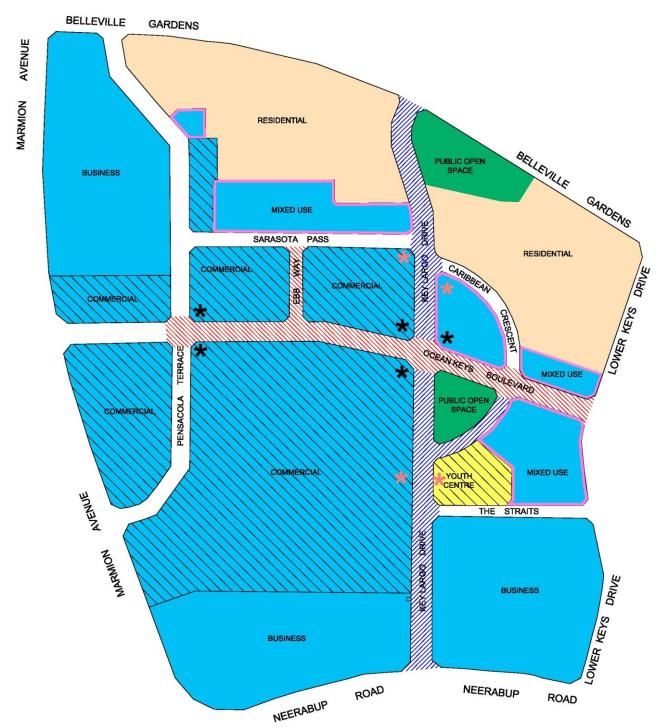
The existing Clarkson Activity Centre Agreed Structure Plan (As Amended), adopted by the WAPC in May
2012 (the Plan), is the key guiding planning document for development of the site. Within this Plan, the site is
currently within the Business Zone (see map 1.4 below). The structure plan states that the Business Zone
“should comprise predominantly mixed business/showroom uses, with supporting bulky goods retail, office,
and service commercial uses.”
The Plan sets out the estimated Shop-Retail floorspace within the structure plan area for the future, based
on the information available at the time of publication. This suggests that in 2016, 42,015 sq. m. NLA shop-
retail floorspace is located within the activity centre. By 2021 this was estimated to increase to 44,065 sq. m.
NLA. The growth trajectory growth outlined in the plan intends that retail floorspace in the centre will grow
57% above 2016 levels by 2031. Total floorspace in the centre is planned to reach 102,678 sq. m beyond
2031, with Shop-Retail space at 44,565 sq. m, just over 16,000 sq. m higher than 2016 levels. Table 1.2
following outlines agreed structure plan estimates out to 2031.
N.B. there is the potential to modify the current Business Zoning under the Structure Plan to Commercial
Zone, which will allow for Shop uses.
URBIS
BUNNINGS CLARKSON RETAIL SUSTAINABILITY ASSESSMENT FINAL REPORT
030418.DOCX PROPERTY ATTRIBUTES & PROPOSED DEVELOPMENT 5Clarkson Activity Centre Structure Plan Map and Subject Site Map 1.3
Subject Site
Source: City of Wanneroo, 2012
Clarkson Activity Centre Agreed Structure Plan Floorspace Estimates
Table 1.2
Current 2016 2021 2026 2031 Beyond 2031
Shop Retail
floorspace
(NLA Sq. m) 28,373 42,015 44,065 44,565 44,565
Other
Floorspace
(NLA Sq. m) 37,911 41,563 46,363 51,763 58,113
Total
Floorspace
(NLA Sq. m) 66,284 83,578 90,428 96,328 102,678
Other
Floorspace (%) 57% 50% 51% 54% 57%
Surplus /
Deficit (Other
Floorspace sq.
m NLA) 18,026 16,490 19,235 22,865 27,310
Source: City of Wanneroo, 2012
URBIS
6 PROPERTY ATTRIBUTES & PROPOSED DEVELOPMENT BUNNINGS CLARKSON RETAIL SUSTAINABILITY ASSESSMENT FINAL REPORT
030418.DOCX1.3. PROPOSED DEVELOPMENT
The proposed development options for the site is detailed in Table 1.3 below. The site is effectively a
redevelopment of the existing site previously anchored by a 10,000 sq. m Bunnings Warehouse. The
proposed Shop / Retail uses are not an increase on the previous provision of Other Retail floorspace as the
tenancy is currently vacant.
Option 1 proposes a 2,500 sq. m supermarket anchor with an additional 7,500 sq. m of specialty retail shops
that may include other potential majors, and other stores across the categories of food retail, food catering,
apparel and other general retail uses.
Option 2 proposes a maximum of 5,000 sq. m of PLUC 5 retail floorspace, again anchored with 2,500 sq. m
supermarket but with allowance for 5,000 of other retail space that may be comprised largely of boutique
large format retail space.
Subject Site Proposed Uses
Table 1.3
Proposed Proposed
Use Previous
(Option 1) (Option 2)
Other Retail
Former
Bunnings
10,000 sq. m 5,000 sq. m
Warehouse
(Vacant)
Shop / Retail Uses
Supermarket 2,500 sq. m 2,500 sq. m
Shops and
7,500 sq. m 2,500 sq. m
Services
Total Floorspace 10,000 sq. m 10,000 sq. m 10,000 sq. m
Source: Urbis
URBIS
BUNNINGS CLARKSON RETAIL SUSTAINABILITY ASSESSMENT FINAL REPORT
030418.DOCX PROPERTY ATTRIBUTES & PROPOSED DEVELOPMENT 72. TRADE AREA PROFILE
2.1. TRADE AREA DEFINITION
The trade area defined for the analysis of potential market opportunities for the subject site development is
illustrated on the map below.
The trade area extends further north and south beyond the immediate vicinity of the subject site to include
the neighbouring suburbs. We note:
The trade area includes a total of three sectors, the Primary, the Secondary North and the Secondary
South.
The Primary Trade Area covers the suburbs of Clarkson and Mindarie, within 1km-3km from the subject
site. The Primary Sector is expected to generate the larger share of the market demand for potential
future uses at the subject site.
The Secondary North Sector incorporates Butler, Jindalee, Quinns Rocks, Merriwa and Ridgewood.
Although these suburbs are served by their respective local centres, residents still rely on the Ocean
Keys Shopping Centre and the remainder of the Clarkson Activity Centre for the provision of higher
order goods or services.
The Secondary South Sector extends across Tamala Park to include the suburbs of Burns Beach and
Kinross. Given the proximity to the Lakeside Joondalup Shopping Centre some 3km (direct line
distance) to the south east, market demand from this sector is expected to be less significant compared
to the Primary and the Secondary North sectors. Nonetheless, Clarkson offers a convenient alternative
shopping destination.
Bunnings Clarkson Site Trade Area Definition Map 2.1
Source: Urbis
URBIS
8 TRADE AREA PROFILE BUNNINGS CLARKSON RETAIL SUSTAINABILITY ASSESSMENT FINAL REPORT
030418.DOCX2.2. TRADE AREA RESIDENT POPULATION
The historical and forecast resident population in the trade area defined for the former Bunnings Clarkson
site is outlined in Table 2.1. These population estimates are based on the following sources of information:
The Australian Bureau of Statistics’ (ABS) 2011 and 2016 Census of Population and Housing.
New Dwelling Approvals (NDAs) data prepared by the ABS to June 2016. This data provides an
indication of potential short-term dwelling development activity and resident population growth.
Population forecasts prepared by .id Consulting at a small area level.
A review and analysis of current and proposed residential developments in the trade area by Urbis.
Between 2011 and 2017 the trade area resident population grew by more than 9,300 or 15%. In 2017 the
estimated residential population of the former Bunnings Clarkson Site Trade Area, had an estimated resident
population of 69,580 with 19,380 in the Primary Sector.
While growth in the Primary Sector has plateaued, the secondary sector is expected to see significant growth
going forward, with an estimated 53% growth in Secondary Sector population forecast between 2017 and
2032.
The NDA data shows (refer to Chart 2.1) a continuing steady level of proposed residential development
activity in the Secondary Sector of the trade area, with an average of 507 approvals per year over the most
recent three-year period (i.e. 2013-2016), with 60% of these occurring in the Secondary North sector
New Dwelling Approvals
Bunnings Clarkson Site Main Trade Area, Ten Years to 2015/2016 Chart 2.1
2,500
Secondary South Secondary North Total Primary
2,000
1,500
1,000
500
0
06/07 07/08 08/09 09/10 10/11 11/12 12/13 13/14 14/15 15/16
So urce: A B S; Urbis
Historical & Forecast Resident Population
Bunnings Clarkson Site Main Trade Area, 2011-2032 Table 2.1
2011 2017 2022 2027 2032
Total Primary 20,110 19,830 19,980 20,340 20,540
Secondary North 30,800 36,810 44,790 52,180 55,140
Secondary South 9,350 12,950 17,460 20,940 20,790
Main Trade Area 60,270 69,580 82,220 93,470 96,480
11-17 17-22 22-27 27-32 11-17 17-22 22-27 27-32
Total Primary -47 30 72 40 -0.2% 0.2% 0.4% 0.2%
Secondary North 1,002 1,596 1,478 592 3.0% 4.0% 3.1% 1.1%
Secondary South 600 902 696 -30 5.6% 6.2% 3.7% -0.1%
Main Trade Area 1,552 2,528 2,250 602 2.4% 3.4% 2.6% 0.6%
1. A s at December 31
So urce: A B S; Western A ustralia To mo rro w 2015; SA Fi; Urbis
URBIS
BUNNINGS CLARKSON RETAIL SUSTAINABILITY ASSESSMENT FINAL REPORT
030418.DOCX TRADE AREA PROFILE 92.3. SOCIO-ECONOMIC PROFILE OF TRADE AREA RESIDENTS
The socio-economic profile of trade area residents is based on the results of the 2016 Census of Population
and Housing. Chart 2.2 provides a summary of the key characteristics for the main trade area as a whole.
Tables A.1 and A.2 in the Appendix to this report provide a more detailed range of variables for each trade
area sector.
The trade area demographic profile is typical of outer suburbs growth areas. The key features of the trade
area resident population are as follows:
Per capita incomes 8% below the Perth average. The average household income in the trade area is
4% below the Perth average.
The age profile is more skewed to younger family households with the population in the age brackets of
0-14 and 35-39, 4 percentage points and 3 percentage points respectively above the Perth average
Families with children under 15 account for 37% of households, 8 percentage points higher than the
Perth average
Around 48% of the population was born overseas, higher than the Perth average of 39%. This area is
appealing to migrants from the United Kingdom, New Zealand and South Africa in particular.
Key Socio-Economic Characteristics
Bunnings Clarkson Site Main Trade Area, 2016 Chart 2.2
15%
Variation from Perth
+10%
10% +8% pts +9% pts
+4% pts
5% +3% pts
+0% pts +0% pts
0% +0% pts
-1% pts
-2% pts
-5% -4% -5% pts
-10% -8%
Above $130,000
Aged 65+
Household Size
% Overseas
Average Household
Families with
% White Collar
Aged 0-14
Aged 50-64
Aged 15-34
Aged 35-49
% Renting
Per Capita
Professionals
Income
under 15
children
HH Income
Born
Income
Income Age Profile
So urce: A B S; Urbis
2.4. TRADE AREA RESIDENT RETAIL SPEND MARKET
The retail spending market has been estimated using MarketInfo, a micro-simulation model developed by
MDS Market Data Systems Pty Ltd. This model is based on information from the ABS’ Household
Expenditure Survey (HES), the Census of Population and Housing (2011) and other information sources that
provide up-to-date information on changes in spending behaviour and/or income levels (e.g. Australian
National Accounts, Australian Taxation Statistics, etc.). MarketInfo is used widely by stakeholders in the
retail industry and by other consultants preparing Retail Sustainability Assessments/Economic Impact
Assessments.
The model uses micro-simulation techniques to combine propensity to spend on particular commodities with
the socio-economic characteristics of individuals to derive spending per capita estimates on a small area
basis (i.e. the Statistical Area One level).
URBIS
10 TRADE AREA PROFILE BUNNINGS CLARKSON RETAIL SUSTAINABILITY ASSESSMENT FINAL REPORT
030418.DOCXThe retail expenditure estimates throughout the report include the component of turnover attributable to
goods and services tax, and that all values are expressed in calendar years in constant 2017 dollar terms
(i.e. inflation is not included).
The retail spending estimates outlined in this report represent the categories of retail goods and services
which are served by retailers within the PLUC 5 definition. A summary of the types of retail expenditure
within the PLUC 5 retail definition is provided in Table A.3 in Appendix A. Throughout this report PLUC 5
retail expenditure is referred to as retail expenditure, spend or spending.
2.4.1. Retail Spend Per Capita
Chart 2.3 outlines estimates of retail spend per capita for residents of the Bunnings Clarkson site main trade
area in the year to 2017. Consistent with the lower incomes of working residents, retail spend per capita
across the main trade area is 3% below the Perth average.
A further breakdown of retail spend per capita by product groups, including food and groceries (which is the
market of most relevance to supermarkets) is also provided in Chart 2.3. Spending on bulky goods items is
higher than average per capita, typical of growth areas where households are being established.
Retail Spend Per Capita by Product Group
Bunnings Clarkson Site Main Trade Area, Variation from the Perth Average Chart 2.3
+8%
Variation from Perth
Average
-1%
-3% -3% -3%
-4%
-8% -7%
-10%
-11%
Food Food Apparel Homewares Bulky Leisure/ Retail Food Non-Food Total Retail
Retail Catering Goods General Services
So urce: A B S; M arketInfo ; Urbis
2.4.2. Total Retail Spend Market
The current and forecast annual retail spend generated by main trade area residents is shown in Table 2.2.
In the year to December 2016, retail expenditure by main trade area residents amounted to $992 million,
including $291 million by primary trade area residents and $701 million by secondary trade area residents.
The forecast growth in retail expenditure by main trade area residents incorporates the following:
Forecast population growth as outlined in Section 2.2 of this report.
Retail spend per capita growth, averaging 0.7% per annum from 2017 to 2022 and 1.2% per annum from
2022 to 2027. The lower rate in the first five years allows for the softer economic environment currently
but expectation for more normalised growth by 2019-2020.
Of note, the forecasts exclude retail price inflation and are expressed in constant 2017 dollar terms
(including GST).
Over the next five years to 2022, annual retail expenditure generated by main trade area residents is
forecast to increase by an average of 4.2% per annum. From 2022 to 2027, forecast growth is expected to
be higher at an average of 3.8% per annum. More of the growth will be concentrated in the secondary
sectors due to ongoing population growth.
On this basis, annual retail spend by main trade area residents is forecast to increase by $224 million to
$1.22 billion by 2022 and a further $251 million to $1.47 billion by 2027. Over the 10-year period, the trade
area retail market is forecast to increase by around 48%. This substantial increase in retail spending
capacity will require a substantial increase in floorspace across centres used by trade area residents.
URBIS
BUNNINGS CLARKSON RETAIL SUSTAINABILITY ASSESSMENT FINAL REPORT
030418.DOCX TRADE AREA PROFILE 11In terms of the market of most relevance to the proposed Woolworths supermarket, i.e. food and groceries,
expenditure in this category is forecast to grow from $455 million in 2017 to $652 million by 2027 (+43%).
Total Retail Spending Market
Bunnings Clarkson Site Main Trade Area, 2017 - 2027 Table 2.2
Per Cap
Food Food Home- Bulky Leisure/ Retail Total Annual Pop
Apparel = + Spend
Retail Catering w ares Goods General Services Retail Growth Growth
Growth
Primary Trade Area:
2017 133 31 26 19 15 34 9 267
2022 138 33 27 21 16 36 10 282 1.1% 0.2% 0.9%
2027 146 36 30 23 17 39 11 303 1.4% 0.4% 1.1%
Secondary Trade Area
2017 328 72 61 45 35 84 22 647
2022 423 96 80 61 46 111 29 847 5.5% 4.6% 0.9%
2027 516 122 100 79 57 139 36 1,049 4.4% 3.3% 1.1%
Main Trade Area:
2017 460 103 87 64 50 119 31 914
2022 561 129 108 82 62 148 39 1,129 4.3% 3.4% 0.9%
2027 662 158 130 102 75 178 47 1,352 3.7% 2.6% 1.1%
So urce: A B S; M arketInfo ; Urbis
URBIS
12 TRADE AREA PROFILE BUNNINGS CLARKSON RETAIL SUSTAINABILITY ASSESSMENT FINAL REPORT
030418.DOCX3. RETAIL HIERARCHY
This section of the report outlines a review of the existing and future distribution of retail centres and
precincts in the region of relevance to the proposed Bunnings Clarkson site redevelopment.
3.1. CENTRE POLICY
On the 31st of August 2010, the Western Australian State Government released State Planning Policy 4.2,
Activity Centres for Perth and Peel. This document outlines the centres hierarchy across metropolitan Perth
and covers seven types of activity centres as follows:
Perth Capital City
Primary Centres
Strategic Metropolitan Centres
Secondary Centres
Specialised Centres
District Centres
Neighbourhood Centres
The Activity Centres Policy outlines the requirements for the planning and development of new activity
centres and the redevelopment and renewal of existing centres. In terms of the activity centres hierarchy, a
number of provisions are specified to meet the Policy’s objectives:
“The responsible authority should not support activity centre structure plans or development proposals
that are likely to undermine the established and planned activity centre hierarchy.
Activity centre structure plans and developments should be consistent with the centre’s classification in
the hierarchy.
The responsible authority should consider the main role/function and typical characteristics for each
centre type”.
3.2. CENTRE HIERARCHY
The location and hierarchy designation of the activity centres, including individual supermarkets, in the
catchment for the Clarkson Secondary Centre is provided in Map 2.1 (provided in Section 2 of this report).
Estimates of PLUC 5 shop/retail floorspace, key anchor tenants and distance from the subject site for
individual activity centres is provided in 0.
Strategic Metropolitan Centre
Joondalup Strategic Metropolitan Centre – although not in the defined catchment, Joondalup is
one of ten strategic metropolitan centres and, given its size, has the capacity to draw retail spend
from across the north west metropolitan corridor. Located 8.6 kms south east, the centre
incorporates both the Lakeside Joondalup Shopping Centre and significant retail, commercial and
non-retail floorspace in the town centre. The Land Use and Employment Survey reports that the total
PLUC 5 floorspace in the centre is 98,575 sq. m with Lakeside Joondalup comprising 88,170 sq. m.
Lakeside Joondalup includes major retailers like Myer, Big W Target, Kmart and Coles as well as a
number of other majors and mini major tenants. As the State Planning Policy 4.2 states: “Strategic
metropolitan centres are the main regional activity centres. They are multipurpose centres that
provide a diversity of uses. These centres provide the full range of economic and community
services necessary for the communities in their catchments”.
URBIS
BUNNINGS CLARKSON RETAIL SUSTAINABILITY ASSESSMENT FINAL REPORT
030418.DOCX RETAIL HIERARCHY 13 Secondary Centres
Clarkson Secondary Centre - is the most obvious and immediately relevant centre to this analysis
as it contains the subject site. The Land Use and Employment Survey reports that the total PLUC 5
floorspace in the centre is 44,297 sq, m and is dominated by the 34,000 sq. m Ocean Keys
Shopping Centre. Key tenants of the Ocean keys include Kmart, Woolworths, Coles, and JB Hi-Fi.
Outside of Ocean Keys the centre features about 3,800 sq. m of PLUC 5 space. Secondary Centres
“share similar characteristics with strategic metropolitan centres but serve smaller catchments and
offer a more limited range of services, facilities and employment opportunities. They perform an
important role in the city’s economy, and provide essential services to their catchments”.
District Centres
Currambine District Centre – the LUES survey reports the Currambine centre as comprising
18,186 sq. m of PLUC 5 floorspace with Currambine Marketplace reported as 8,375 sq. m of retail
floorspace featuring Woolworths and Farmer Jacks supermarkets. The centre is outside of the trade
area for the Bunnings Clarkson site but is expected to draw some expenditure from the Secondary
Southern sector of the trade area.
Butler District Centre – Butler Central Shopping Centre is a newly opened centre that will ultimately
comprise around 8,800 sq. m of retail floorspace. As yet the centre is not fully leased and like most
of the centres in the trade area, is expected to draw mostly from the Secondary North sector.
Neighbourhood and Local Centres
Brighton Centre– is a 4,570 sq.m centre with about 90% of the floorspace accounted for by a Coles
supermarket anchored shopping centre of approximately 4,000 sq. m. The centre is located 7.1 Kms
north of Clarkson subject site.
Quinn’s Centre – LUES reports that Quinns is a 6,483 sq. m centre featuring a small, 1,790 sq. m
shopping centre with an GA and a BWS. The centre is located on the border of the Secondary North
and Primary trade areas.
Merriwa Centre - is a 2,784 sq. m centre with an IGA based centre of 1,600 sq. m near the border
of the Secondary North and Primary trade areas.
Kinross Centre – is a 4,900 sq. m Supa IGA anchored centre located at the southern end of the
Secondary Southern sector
Butler Local Centre – is a small (1,200 sq. m) IGA and liquor store based centre one km to the east
of Brighton Village
Carramar Neighbourhood Centre- sits outside of the trade area and is east of a main border in
Wanneroo Rd. The 4,600 sq. Woolworths anchored shopping centre forms most of the Carramar
activity centre.
URBIS
14 RETAIL HIERARCHY BUNNINGS CLARKSON RETAIL SUSTAINABILITY ASSESSMENT FINAL REPORT
030418.DOCXActivity Centres Floorspace
Land Use and Employment Survey Table 3.1
DoP Land Use and Employment Survey
LUES Complex LUES PLUC 5
Activity Centre Name LUES Name
No. Floorspace
Strategic Metropolitan Centre
Joondalup Strategic Metropolitan
Joondalup City 600 98,575
Centre
Secondary Centres
Clarkson Secondary Centre Clarkson 672 44,297
District Centres
Currambine District Centre Currambine Market Place 946 18,186
Butler District Centre Butler Boulevarde 9464 2,680
Neighbourhood and Local
Centres*
Brighton Brighton 8812 4,570
Quinns Road Quinns Road 659 6,483
Merriwa Plaza Merriwa Plaza 8789 2,784
Kinross Kinross 671 4,975
Carramar Carramar 9446 3,142
N.B. The 1,200 sq. m Butler IGA & Liquor is not identified in the LUES data.
Source: Urbis, DoP
3.3. FUTURE RETAIL DEVELOPMENTS
The only retail development approved of relevance in terms of its impact on the Clarkson Activity Centre is in
Butler and is described as follows:
Butler Central Shopping Centre Expansion. Stage 2 of the Butler Central Shopping Centre is
scheduled for completion in March. We understand that at completion the centre will comprise
approximately 8,800 sq. m of retail floorspace. We have estimated approximately 75% of the total retail
floorspace falls into current competing supply, with a further 2,130 sq. m (approximately) due for
completion in the near future.
Aldi Clarkson We also note that Aldi are expected to lodge a DA shortly for a site in the Clarkson
primary catchment. Details on this DA are not available at present but we have factored the potential
impact of development on the Bunnings Clarkson site on what we anticipate to be the Aldi development.
It should be noted however, that there is some uncertainty as to the exact final location of and Aldi
Clarkson store (were it to proceed) as it is understood that more than one location may be under
consideration by Aldi.
Beyond the trade area, key incoming developments may include development of a neighbourhood centre in
Catalina, although no firm details are available on the scale of the development at this stage and it has not
been factored into our modelling.
URBIS
BUNNINGS CLARKSON RETAIL SUSTAINABILITY ASSESSMENT FINAL REPORT
030418.DOCX RETAIL HIERARCHY 154. ECONOMIC NEED, DEMAND & IMPACTS
This section outlines the demand for, impact and benefits of the proposed redevelopment of retail floorspace
as part of a mixed-use development on the Bunnings Clarkson site. It presents the quantifiable impacts on
the trading levels of centres within the local retail hierarchy, as well as considering the benefits to the
community in terms of job creation, consumer choice and general retailer competitiveness.
4.1. PROPOSED DEVELOPMENT
As detailed in Section 1 of the report, BWP Trust are proposing to construct a mixed-use development on the
subject site, including a retail component. The development will deliver major improvements to the overall
amenity and range of retail shops and services in the Clarkson Secondary Centre on a strategic site that sits
vacant since Bunnings Warehouse relocated. These changes are expected to better address the needs of
the community, provide an enhanced experience for shoppers and support the designated role of the centre.
As stated previously, Option 1 proposes a 2,500 sq. m supermarket anchor with an additional 7,500 sq. m of
specialty retail shops Option 2 proposes a maximum of 5,000 sq. m of PLUC 5 retail floorspace, again
anchored with 2,500 sq. m supermarket but with allowance for 5,000 of large format retail space
4.2. ASSUMPTIONS
The key assumptions factored into the assessment of need, demand and impacts are as follows:
The opening year of trade for the proposed development is calendar year 2022.
Population and retail spending growth by trade area residents is as outlined in Section 2.
The existing and future supply of retail shops and services is as outlined in Section 3.
4.3. MARKET NEED & SUPPORTABLE SCALE OF DEVELOPMENT
For the purposes of this report, we consider an outcome where a total of 10,000 sq.m of shop retail space is
delivered. This is considered as a higher impact scenario to assist in determining the impact range that
could result from development on site, regardless of the nature or mix of the retail space. The more likely
outcome is for a smaller shop-retail provision, with showroom-type uses that are not considered as part of
the PLUC 5 classification.
The proposed retail development for the former Bunnings Clarkson site will address a range of market needs
as follows:
Strategic Site within the Activity Centre – the site is a key location within the established activity
centre and its addition will strengthen the Clarkson offer and contribute to the retail offering in the centre
and extend the consumer servicing needs of the catchment.
Market Capacity - the market capacity has been considered in determining that the retail component of
the development as proposed can be sustained in this location, including a mid-sized supermarket.
While the Clarkson centre offers large format stores, there is an opportunity for other chains to operate
a mid-sized supermarket.
Improved Access and Site Activation - The development of the site will improve catchment access to
retail services and serve to activate a key location within the activity centre.
Based on a supermarket of 2,500 sq.m, evidence from Urbis Retail benchmarks data on centres across
the country indicates a total of around 5,000 sq.m of traditional retail space is supportable.
A further 5,000 sq.m of retail showrooms is considered appropriate and sustainable given the prominent
corner location and extension of existing uses along Neerabup Road.
4.4. TURNOVER POTENTIAL OF PROPOSED DEVELOPMENT
In order to assess the potential economic impacts that could eventuate from the proposed Bunnings
Clarkson Site development, the turnover potential of the proposed Bunnings Clarkson Site requires
consideration.
URBIS
16 ECONOMIC NEED, DEMAND & IMPACTS BUNNINGS CLARKSON RETAIL SUSTAINABILITY ASSESSMENT FINAL REPORT
030418.DOCXThe turnover performance of the centre is based on future market demand and attainable market shares and
trading densities (e.g. turnover per sq.m). Estimated market shares take into account the scale, composition
and quality of the proposed retail development as well as the location and competitiveness of other retail
locations. The turnover potential is assessed on the basis of the net additional retail turnover that would be
generated by the proposed development.
The turnover potential of the proposed centre is assessed for the PLUC 5 shop/retail floorspace of the centre
for calendar year 2022. Turnover figures are expressed in constant $2017 including GST.
In Table 4.1 and Table 4.2 we have profiled net additional retail turnover for the two options: Option1
includes an additional 10,000 sq. m whereas Option 2 explores the impacts of an additional 5,000 sq. m of
retail floorspace.
Option 1 shows that, taking the relevant factors into account, the proposed Bunnings Clarkson site has the
potential to achieve a net additional retail turnover of approximately $58 million. Against a net additional
retail floorspace of 10,000 sq.m, this turnover level equates to an average trading level of around $6,201 per
sq.m.
In terms of market shares the proposed Bunnings site retail component would capture:
A 4.6% share of retail expenditure by trade area residents, including 4.9% of food retail expenditure.
A 8.2% share of retail expenditure by primary trade area residents, including around 9.7% of food
expenditure.
Approximately 10.6% of turnover could be sourced from beyond the trade area, recognising the high
profile and accessible location of the subject site within the broader town centre and potential for the
centre to access home bound commuters.
These market shares are considered attainable for the development proposed. They are also quite modest,
indicating the impact on other centres in the hierarchy will be limited.
Option 1 - Net Additional Retail Turnover (Additional 10,000 sq. m)
Bunnings Clarkson Site, 2022 ($2017, including GST) Table 4.1
Resident Spending ($M) Market Share Potential Turnover Potential ($M)
Food NF Total Food NF Total Food NF Total
Total Primary Trade Area 171.0 110.8 281.9 9.7% 5.8% 8.2% 16.6 6.4 23.0
Secondary Trade Area
Secondary North 371.0 230.8 601.7 3.8% 3.1% 3.6% 14.3 7.1 21.4
Secondary South 148.4 96.6 245.0 3.5% 2.4% 3.1% 5.2 2.3 7.6
Total Secondary 519.4 327.4 846.7 3.8% 2.9% 3.4% 19.5 9.4 28.9
Main Trade Area 690.4 438.2 1,128.6 5.2% 3.6% 4.6% 36.1 15.9 52.0
Turnover From Beyond TA 10.4% 11.0% 10.6% 4.2 2.0 6.2
Centre Retail Turnover ($M) 40.3 17.8 58.1
So urce: Urbis
Option 2 shows that, development of the site has the potential to achieve a net additional retail turnover of
approximately $40 million, against a net additional retail floorspace of 5,000 sq.m, this turnover level equates
to an average trading level of around $8,056 per sq.m. (excluding the 5,000 sq. m for large format retailing)
In terms of market shares the proposed Bunnings site retail component would capture:
A 3.2% share of retail expenditure by trade area residents, including 4% of food retail expenditure.
An 5.8% share of retail expenditure by primary trade area residents, including around 7.9% of food
expenditure.
Approximately 10.6% of turnover could be sourced from beyond the trade area, recognising the high
profile and accessible location of the subject site and potential for the centre to access home bound
commuters.
URBIS
BUNNINGS CLARKSON RETAIL SUSTAINABILITY ASSESSMENT FINAL REPORT
030418.DOCX ECONOMIC NEED, DEMAND & IMPACTS 17Option 2 – Net Additional Retail Turnover (Additional 5,000 sq. m)
Bunnings Clarkson Site, 2022 ($2017, including GST) Table 4.2
Resident Spending ($M) Market Share Potential Turnover Potential ($M)
Food NF Total Food NF Total Food NF Total
Total Primary Trade Area 171.0 110.8 281.9 7.9% 2.5% 5.8% 13.5 2.8 16.3
Secondary Trade Area
Secondary North 371.0 230.8 601.7 3.1% 1.3% 2.4% 11.5 3.0 14.5
Secondary South 148.4 96.6 245.0 2.9% 1.0% 2.1% 4.2 1.0 5.2
Total Secondary 519.4 327.4 846.7 3.0% 1.2% 2.3% 15.7 4.0 19.8
Main Trade Area 690.4 438.2 1,128.6 4.2% 1.6% 3.2% 29.2 6.8 36.1
Turnover From Beyond TA 10.4% 10.8% 10.5% 3.4 0.8 4.2
Centre Retail Turnover ($M) 32.6 7.7 40.3
So urce: Urbis
4.5. IMPACT ANALYSIS
4.5.1. Trading Impacts
Trading Impact Analysis Scope and Context
An Impact assessment is designed to provide an indication of the trading environment and average trading
conditions under which retailers are likely to operate in. They are also intended to profile likely changes in
turnover (declines or gains) that retailers can reasonably expect over time.
Because an impact assessment seeks to forecast how groups of people are likely to alter their shopping
behaviour in response to a given change in the competitive environment, it is not possible to be so precise
as to estimate exactly what will happen to each individual retailer, or each group of retailers in each location.
It is therefore not possible in any impact assessment of this type to estimate precisely what will be the trading
impacts on any specific individual retailer. The impact on any one individual retailer, or any small group of
retailers in a given location, would depend on many factors, only some of which are within their control. The
actions that retailers take will determine the eventual impact on each of them and furthermore, the actions
which they each take will also determine the eventual impact on the other retailers involved.
All of these factors need to be kept in mind when considering the likely impact of any relocation and
expansion of a retailer within the existing retail network. Existing retailers are not passive participants, but
rather will play a major role in the eventual impact which they will experience.
It should also be noted that the effects of new competition on individual businesses or centres are not a
relevant planning consideration in most situations. The relevant consideration in planning terms relates to
the ongoing ability for a centre to continue to provide for the needs of the community which they serve, and
to ensure that new development does not fundamentally undermine the viability (or resulting trading levels)
and role of existing and planned centres, particularly their role as community focal points for a range of
needs. The sustainability of the activity centre hierarchy is of paramount importance, not simply the one-off
percentage trading impact. Of note, a centre can have a significant percentage impact but still be viable
given the resulting trading levels are still within sustainable levels.
Trading Impacts Methodology
Shopper behaviour is related to the satisfaction of particular requirements, and decisions regarding where to
shop are based on the sum total of a number of judgements, including relative accessibility, the availability of
particular traders, convenience, variety, carparking, and others. As a result, residents like to spread their
purchases across a wide variety of shopping centres and areas, and to use the full range of facilities
available to satisfy particular needs.
The method of analysis used to assess the impacts on individual centres from a retail development is based
on a “competitive usage” model. This model is based on the principle that if shoppers choose to direct some
of their retail expenditure to the subject development proposal, then they will reduce their expenditure at
URBIS
18 ECONOMIC NEED, DEMAND & IMPACTS BUNNINGS CLARKSON RETAIL SUSTAINABILITY ASSESSMENT FINAL REPORT
030418.DOCXother centres in direct proportion to their usage of each centre or location, as reflected by each centre’s
market share from the various trade area sectors. In assessing the potential impacts on other centres in the
hierarchy we have adopted a “turnover allocation approach”.
The assessment of impacts on specific retail centres relies upon an understanding of the existing turnover
and level of usage of centres in the trade area and beyond. The model estimates the degree to which
various shopping locations within and beyond the trade area are used for retail shopping by allocating a
proportion of turnover to each trade area sector (i.e. source of sales). These estimates result in market
share calculations for each competitive centre and thereby form the basis by which the impact of the
proposed retail development is distributed to all other centres used by residents of the trade area.
It is also relevant to consider the dollar impacts in relation to the turnover that would potentially be generated
by these and other shopping centres over the intervening period. The impact analysis therefore details the
turnover loss or net impact which is expected for each centre/location, expressed as a reduction in turnover
and as a percentage of the turnover level for each centre in 2022.
Quantification of Impact from New Retail Development
Tables 4.2 and 4.3 outlines the assessment of potential trading impacts on individual activity centres as a
result of the proposed development of a Bunnings Clarkson site redevelopment. The analysis considers two
options – Option1 includes an additional 10,000s sq. m whereas Option 2 explores the impacts of an
additional 5,000 sq. m of retail floorspace. Option 1 outlines the maximum impact in terms of retail turnover
that might be expected of the larger development, and it follows that the impacts of Option 2 will be
inherently lower than Option 1.
The key information provided in Tables 4.3 and 4.4 is as follows:
Column 1: Estimated current PLUC 5 shop/retail turnover (year to December 2017) for existing activity
centres, based on a combination of publicly available data relating to the performance of shopping
centres (e.g. Shopping Centre News Big/Little Guns editions); Urbis’ proprietary databases, and our
observations of the relative trading performance of each centre.
Column 2: Estimated potential retail turnover in the year to December 2022 for existing and proposed
activity centres incorporating allowance for forecast market growth, the impact of online retailing general
loss of market share and other proposed retail based developments (e.g. Extension of the Butler Village
Shopping Centre).
Column 3: Estimated retail turnover at each centre in the year to December 2022 incorporating
allowance for the proposed development at the Bunnings Clarkson site.
Columns 4 and 6: The change in retail turnover ($M and percentage) from 2017 to 2022 incorporating
trading impacts of all assumed new retail competition, including the proposed Bunnings Clarkson Site.
Columns 5 and 7: The reduction in retail turnover ($M and percentage) in 2022 as a result of the
development of the retail component of the proposed Bunnings Clarkson Site.
URBIS
BUNNINGS CLARKSON RETAIL SUSTAINABILITY ASSESSMENT FINAL REPORT
030418.DOCX ECONOMIC NEED, DEMAND & IMPACTS 19Option 1 – Distribution of Impact on Activity Centres
Additional 10,000 sq. m of Retail Floorspace Table 4.3
Est. Retail Turnover ($M) Turnover Inc./Dec. ($M) Impact
Existing Pre-Dev Post-Dev. Existing Pre-Exp
2017 2022 2022 2017 2022 2017 2022
(1) (2) (3) (4)=(3)-(1) (5)=(3)-(2) (6)=(4)/(1) (7)=(5)/(2)
Centres within Trade Area
Clarkson Secondary Centre 250.7 293.4 335.4 +84.7 +42.0 +33.8% +14.3%
Bunnings Clarkson Site 0.0 0.0 58.1 +58.1 +58.1 N/A N/A
Ocean Keys Shopping Centre 233.3 259.9 245.7 +12.4 -14.2 +5.3% -5.5%
Clarkson - excluding Ocean Keys 17.4 19.4 18.3 +0.9 -1.1 +5.2% -5.7%
Kinross Neighbourhood Centre 29.7 36.4 35.6 +5.9 -0.8 +20.0% -2.3%
Brighton District Centre 51.6 58.1 56.2 +4.6 -1.9 +9.0% -3.3%
Quinns Local Centre 17.1 18.8 18.0 +0.9 -0.8 +5.1% -4.5%
Meriwa Local Centre 13.4 15.0 14.5 +1.0 -0.6 +7.7% -3.7%
Butler District Centre 87.6 100.1 96.0 +8.3 -4.1 +9.5% -4.1%
Other Centres
Joondalup Strategic Metropolitan Centre 668.2 750.4 741.0 +72.8 -9.4 +10.9% -1.3%
Currambine District Centre 86.8 97.5 95.0 +8.2 -2.5 +9.4% -2.6%
Carramar District Centre 29.3 32.7 32.3 +3.0 -0.4 +10.4% -1.1%
N.B. The Clarkson Secondary Centre entry is the subtotal of three sites including the Bunnings Clarkson
Site, the Ocean Key Shopping Centre and Clarkson – Excluding Ocean Keys.
Option 2 - Distribution of Impact on Activity Centres
Additional 5,000 sq. m of Retail Floorspace Table 4.4
Est. Retail Turnover ($M) Turnover Inc./Dec. ($M) Impact
Existing Pre-Dev Post-Dev. Existing Pre-Exp
2017 2022 2022 2017 2022 2017 2022
(1) (2) (3) (4)=(3)-(1) (5)=(3)-(2) (6)=(4)/(1) (7)=(5)/(2)
Centres within Trade Area
Clarkson Secondary Centre 250.7 293.4 323.0 +72.2 +29.6 +28.8% +10.1%
Bunnings Clarkson Site 0.0 0.0 40.3 +40.3 +40.3 N/A N/A
Ocean Keys Shopping Centre 233.3 259.9 250.5 +17.2 -9.4 +7.4% -3.6%
Clarkson - excluding Ocean Keys 17.4 19.4 18.7 +1.3 -0.7 +7.7% -3.5%
Aldi Clarkson N/A 14.1 13.4 N/A -0.7 N/A -4.7%
Kinross Neighbourhood Centre 29.7 36.4 35.8 +6.2 -0.6 +20.8% -1.6%
Brighton District Centre 51.6 58.1 56.6 +5.1 -1.5 +9.8% -2.6%
Quinns Local Centre 17.1 18.8 18.2 +1.1 -0.6 +6.3% -3.4%
Meriwa Local Centre 13.4 15.0 14.6 +1.2 -0.4 +8.7% -2.9%
Butler District Centre 87.6 100.1 96.9 +9.2 -3.2 +10.5% -3.2%
Other Centres
Joondalup Strategic Metropolitan Centre 668.2 750.4 745.1 +77.0 -5.3 +11.5% -0.7%
Currambine District Centre 86.8 97.5 95.5 +8.7 -2.0 +10.0% -2.0%
Carramar District Centre 29.3 32.7 32.4 +3.1 -0.3 +10.6% -0.9%
Note all turnover figures provided in Tables 4.3 and 4.4 are expressed in constant $2017.
The main findings from the impact analysis is as follows:
The one-off impacts in 2022 on individual centres range from -1.1% to -5.7%, which are within
acceptable levels that would not impact the sustainability of any one centre. There are no impacts close
to 10%, a notional benchmark for when impacts need to be more closely considered.
URBIS
20 ECONOMIC NEED, DEMAND & IMPACTS BUNNINGS CLARKSON RETAIL SUSTAINABILITY ASSESSMENT FINAL REPORT
030418.DOCXYou can also read