Appendix G Economics Assessment - Christchurch City Council
←
→
Page content transcription
If your browser does not render page correctly, please read the page content below
Appendix G
Economics Assessment

             Project number 245022 File Papanui Supermarket Retail Office and Resilience Hub AEE.docx, 2019-06-07 Revision 1   91
Final Report: Thursday, 8 November 2018

Economic Analysis of Resource
Consent for PAK’nSAVE Papanui
PREPARED FOR

Foodstuffs South Island Limited

INSIGHT ECONOMICS                 CLEAR AND CONCISE SOLUTIONS BASED ON RIGOROUS RESEARCH AND ANALYSIS
Authorship
This document was written by Fraser Colegrave. For further information, please contact
him at the details below:

Mobile: (021) 346 553

Email: fraser@ieco.co.nz

Web: www.insighteconomics.co.nz

© Insight Economics Ltd, 2018. All rights reserved.

Disclaimer
Although every effort has been made to ensure the accuracy of the material and the integrity
of the analysis presented herein, Insight Economics Ltd accepts no liability for any actions or
inactions taken based on its contents

Contents
Executive Summary ............................................................................................................... 1

1      Introduction .................................................................................................................... 4
    1.1     Context and Purpose of this Report ........................................................................4
    1.2     Scope, Focus and Study Area ..................................................................................4
    1.3     Structure of this Report ...............................................................................................4

2      Context ............................................................................................................................ 5
    2.1    Site Location and Description ...................................................................................5
    2.2    Zoning and Permitted Uses ........................................................................................6
    2.3    About the Proposed Development .........................................................................6
    2.4    Future Role as a Post-Disaster Structure ..................................................................6

3      Current Supermarket Supply ........................................................................................ 8
    3.1    Map of Current Supermarkets ..................................................................................8
    3.2    Stores by Brand and District ......................................................................................8
    3.3    Current Supermarket Floorspace .............................................................................9
    3.4    Impacts of the Quakes and Recent Changes in Supply .....................................9

4      Current and Future Retail Demand ............................................................................ 10
    4.1    Effects of the Quakes .............................................................................................. 10
    4.2    Current Retail Expenditure...................................................................................... 10
    4.3    Current Floorspace Demand ................................................................................. 11
    4.4    Projected Population Growth ................................................................................ 12
    4.5    Projected Retail Expenditure ................................................................................. 12
    4.6    Resulting Growth in Floorspace and Land Demand ......................................... 13

5      Economic Rationale for the Proposal ........................................................................ 14
    5.1    Overview .................................................................................................................... 14
    5.2    Response to Anticipated Demand Growth ........................................................ 14
    5.3    Fit with Operational Requirements ....................................................................... 14
    5.4    Limited Opportunities to Establish Elsewhere ...................................................... 15
    5.5    Proximity to Growth Areas ...................................................................................... 16
    5.6    Highest and Best Use of the Land ......................................................................... 16
    5.7    Increased Building Resilience and Post-Disaster Capacity .............................. 17
    5.8    Site is Poor Fit with Industrial Uses ........................................................................... 17
    5.9    Industrial Land is Relatively Abundant ................................................................. 17

6      Analysis of Retail Distribution Effects .......................................................................... 19
    6.1    Steps in the Analysis ................................................................................................. 19
    6.2    Definition of Retail Distribution Effects .................................................................. 19
    6.3    Centres at Potential Risk ......................................................................................... 19
    6.4    Description of Papanui/Northlands ...................................................................... 20
    6.5    Current Health and Vitality ..................................................................................... 21
    6.6    Likely Impacts of the Proposal ............................................................................... 21
    6.7    Conclusion on Flow-On Effects .............................................................................. 22

7      Impacts on Supply of Industrial Land ........................................................................ 23
    7.1   Steps in the Analysis ................................................................................................. 23
    7.2   Planned and Actual Future Supply ....................................................................... 23
    7.3   Future Demand......................................................................................................... 23
    7.4   Summary and Conclusion ...................................................................................... 24

8      Summary and Conclusions ......................................................................................... 25
Executive Summary
This report analyses the likely economic effects of Foodstuffs’ proposal to develop a new
PAK’nSAVE store next to its South Island head offices in Papanui. The store has been
designed to operate as an emergency coordination facility in times of crisis, which Civil
Defence can utilise for disaster response activities. It will also integrate with the adjacent
commercial development located at 3-7 Northcote Road, which will continue to provide
ongoing/commercial local use on the site. Finally, the existing Northlands PAK’nSAVE
store may potentially be converted to a smaller, New World-branded supermarket, to
help optimise Foodstuff’s citywide network of stores.

The subject site is mostly zoned as Industrial General, although the site at 3-7 Northcote
Road is zoned as Commercial Local. Accordingly, resource consent is required for the
proposed PAK'nSAVE development, because supermarkets are not provided for within
the Industrial General Zone. To assist, this report analyses its likely economic effects,
including potential adverse effects.

The analysis begins by identifying the site’s location, and describing its current use.
Then, it profiles current supermarket supply in the study area of greater Christchurch.
Currently, there are 48 supermarkets in the study area, with an estimated total
floorspace of 167,000m2 GFA.

Next, we consider current and future demand for core retailing in the study area to
understand the need for additional zoned land. Using Statistics New Zealand’s medium
population projection, we estimate retail growth of $3.5 billion (or 58%) to 2043, which
equates to the need for 681,000m2 of additional retail floorspace, and 136 hectares of
extra zoned land (at an average floor area ratio of 0.5).

Having set the scene, we then explore the economic rationale for the proposal. There are
several driving forces, including:

    •   Future demand growth – if supermarkets maintain their current share of food
        retailing, growth in spending will support 27 new stores by 2043. The proposal
        is thus merely a natural market response to forecast growth in demand.

    •   Supermarkets have specific operational requirements, particularly around
        accessibility and parking. The subject site meets all these, plus it represents a
        strategic refinement to the overall network of PAK'nSAVE stores. In addition,
        the proposed site enables various co-location benefits with Foodstuffs’ South
        Island Head Office, which cannot be realised at alternative locations.

    •   The subject site is close to several priority growth areas – in fact, it is within five
        kilometres of every priority growth area located north of the CBD.

    •   Foodstuffs has unsuccessfully tried to sell and/or lease the site for industrial uses
        for some time, incurring significant opportunity costs in the process. The
        proposal resolves this lingering issue, while enabling the land to be put to its
        highest and best use.
                                                                                              1
• Finally, the new building will be designed to have the structural integrity of an
IL4 building and will become a food distribution hub in times of need. The
combination of an on-site fuel facility, generator, and bore will enable Civil
Defence to operate from there and assist with delivering food and water to
Christchurch.
Next, we considered the risk of retail distribution occurring because of the proposal.
Three at-risk centres were identified, but only Papanui/Northlands was studied in detail
because (i) it is the closest centre with a supermarket, (ii) it is a key activity centre, and
(iii) the proposal has direct impacts on its tenancy mix.
Northlands was found to be the third largest retail centre in Christchurch by retail GFA,
and the eighth largest in NZ. It has a strong fashion focus, with fashion retail accounting
for nearly a quarter of retail employment (compared to a national average of 6%).
Next, we estimated the retail vacancy rate in Papanui and Northlands to help gauge
health and vitality. Our research identified eight vacancies, equalling 2.6% of total GFA.
There were no vacancies in Northlands, however. Accordingly, we consider the mall –
and the rest of the centre – in relatively good health.
The analysis then considers the likelihood of retail distribution effects occurring at
Northlands and Papanui. In short, we consider this highly unlikely because:
• Northlands is a large and successful mall, with high footfall and zero vacancies.
It is thus resilient, and well-placed to absorb any minor competitive effects.
• The new PAK'nSAVE store will compete mainly with other PAK'nSAVE stores;
much less so other food retailers in Northlands or Papanui. Further, since
supermarket spending is forecast to continue growing over time, any trade
impacts due to the proposal will be both minor and short-lived.
• While the proposed supermarket will be adjacent to the small, existing
commercial local zoned area at 3-7 Northcote Road, no additional retail
tenancies will be enabled by the proposal. Accordingly, it will not directly
compete with specialty retailers in Northlands or Papanui. Further, given the
limited size and scope of the adjacent Commercial Local zone, there is little (if
any) scope for cumulative adverse effects to arise in conjunction with the
proposed supermarket development.
• More importantly, people who previously shopped at specialty stores in
Northlands or Papanui will return there even if they no longer frequent the
mall’s supermarkets, because those specialty retailers remain the best way to
meet those specific retail needs.
Finally, we consider potential impacts on the supply of industrial land. First, we note
that there is roughly 638 hectares currently available according to the Council’s register,
2with more to come. Then, we forecast future demand, which equates to an additional
282 hectares under our medium scenario (and 400 hectares under our high scenario).
Accordingly, we conclude that there is ample industrial land to meet future needs, and
that the loss of 1.6 hectares due to the proposal is immaterial.
Based on the results of our detailed analysis – as summarised above – we strongly
support the resource consent on economic grounds.
31 Introduction
1.1 Context and Purpose of this Report
Foodstuffs South Island Limited (Foodstuffs) owns a 1.6-hectare site next to its head
offices in Papanui, Christchurch. To help optimise its network and cater for growth,
Foodstuffs wishes to relocate its PAK’nSAVE store at Northlands to a dedicated, stand-
alone building on the site. Then, it will consider the possibility of backfilling the
resulting tenancy at Northlands with a New World store.
The plan also involves the proposed PAK'nSAVE being built to importance level 4 (IL4),
so that it can be an emergency coordination facility and perform important, post-
disaster functions to assist Civil Defence and other agencies in case of natural disasters.
Under the operative District Plan, most of the site is zoned Industrial General, so the
proposed site development requires resource consent. To assist, this report analyses the
likely economic effects of the proposal, including potential adverse effects.
1.2 Scope, Focus and Study Area
While the subject site is adjacent to a small area of existing, commercially-zoned land,
the proposal does not create any new retail tenancies other than the supermarket itself..
Accordingly, there is no scope for other businesses to establish alongside it, with any
potential trade impacts therefore limited to other supermarkets and the centres of which
they form part. That narrow scope is reflected in this report, which focusses primarily
on the supermarket sector. The main exception is section 4, which forecasts future retail
expenditure – and hence future land demand – across all core retail categories to fully
understand the need for additional zoned land to meet forecast retail growth over time.
Further, while the site is located in Christchurch City, we set the study area equal to all
of Greater Christchurch, because the three districts that comprise it effectively operate as
one (sub-regional) retail market.
1.3 Structure of this Report
The remainder of this report is structured as follows:
• Section 2 describes the location and current state of the subject site.
• Section 3 briefly summarises current study area supermarket supply.
• Section 4 estimates current and future study area retail demand.
• Section 5 describes the economic rationale for the proposal.
• Section 6 analyses potential retail distribution effects.
• Section 7 considers impacts on the supply of industrial land.
• Section 8 provides some brief concluding remarks.
42 Context
2.1 Site Location and Description
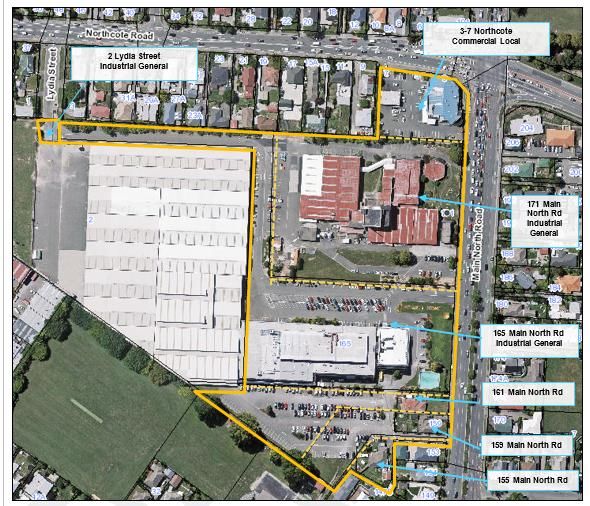
The subject site for this resource consent application is located at 159-171 Main North
Road, and 3-7 Northcote Road, Papanui, Christchurch. The extent of the subject site is
illustrated by the yellow outline in the map below.
Figure 1: Map of Site Location
The site is bound by residences to the north, Main North Road to the east, St Joseph’s
School to the south, and warehousing to the west. The site itself is flat and square, but
some of its buildings were badly-damaged by the quakes. As a result, large parts have
remained idle since 2011.
At the time of writing, the site housed the following current activities:
• A commercial local centre comprising a vacant Harvest Market store, a vacant
Mad Butchers shop, and an Oil Changers workshop;
• Foodstuffs South Island’s head office; and
• Carparking.
52.2 Zoning and Permitted Uses
A significant proportion of the subject site is zoned Industrial General under the
operative District Plan, which enables a wide range of non-residential uses to establish
as of right. For example, the following uses are all classified as permitted activities.
• Ancillary office
• Ancillary retail activity
• Community corrections facility
• Emergency service facilities
• Food and beverage outlet
• Gymnasium
• High technology industrial activity
• Industrial activity
• Parking lots and parking buildings
• Preschool
• Public transport facility
• Second-hand goods outlets
• Service industry
• Service station
• Trade and industry training activity
• Trade supplier
• Warehousing and distribution activities
• Yard-based supplier
However, supermarkets are not a permitted activity, and hence require consent.
2.3 About the Proposed Development
Foodstuff’s proposed redevelopment of its site seeks to:
• Establish, operate and maintain a supermarket and associated fuel facility,
ancillary offices, car parking, access, signage and landscaping;
• Provide an emergency coordination facility;
• Alter the existing site access and relocate existing car parks for the existing
Foodstuffs South Island Limited Head Office; and
• Alter access arrangements for the retail and commercial tenancies located at 3-7
Northcote Road, Papanui, Christchurch.
2.4 Future Role as a Post-Disaster Structure
The Application includes an emergency response function (emergency coordination
facility (ECF)) designed in consultation with Civil Defence Christchurch and
Canterbury, which will be used to increase community resilience.
The proposed Papanui PAK’n SAVE will operate as a stand-alone, business-as-usual
supermarket. However, it has been specifically designed to provide for built-in natural
disaster resilience to accommodate an ECF during times of major disruptions. The
overall emergency response will include use of the supermarket and fuel site, the wider
6site and its utilities, the existing Foodstuffs Head Office, and associated carparking,
access and the signalised crossing.
The ECF has been designed to provide for three days of self-sufficiency, and it is
proposed to be used:
• to enable Foodstuffs' business operations to resume quickly after an emergency
event to support the community response, and provide a "lifeline" of fast
moving consumer goods (such as packaged foods, water, toiletries and over-the-
counter drugs) and fuel;
• for emergency response operations coordinated by Canterbury Civil Defence
Emergency Management (Civil Defence) and other agencies; and
• to provide the local community with a 'safe space' where people can congregate
to receive resources, for communication of key information, or as a shelter,
depending on the response from Civil Defence or the Crown.
73 Current Supermarket Supply
This section briefly describes the current supply of supermarkets across the sub-region.
3.1 Map of Current Supermarkets
Figure 2 plots the location of supermarkets currently in the city. 38 stores are shown,
with a further 10 located just off the map, bringing the study area total to 48.
Figure 2: Map of Supermarkets (Focussing on Christchurch City)
3.2 Stores by Brand and District
Table 1 disaggregates current supply by brand and district. It confirms that most
supermarkets are in the city, with only a handful in Selwyn and Waimakariri. It also
shows that Countdown and New World are the most common brands.
Table 1: Current Supermarket Supply by Brand and District
Brand/District Christchurch Selwyn Waimakariri Total
Countdown 13 1 2 16
Fresh Choice 3 1 4
New World 12 2 2 16
PAK'nSAVE 5 1 6
Super Value 6 6
Total 39 3 6 48
83.3 Current Supermarket Floorspace
We converted the store counts above to estimates of floorspace using estimates of
average floorspace by supermarket brand.1 Table 2 presents the results, which suggests
that there is about 167,000m2 of supermarket GFA currently in greater Christchurch.
Table 2: Estimated Current Supermarket GFA across Greater Christchurch
Brand # Stores Average GFA Total GFA GFA Shares
Countdown 16 3,900 62,400 37%
Fresh Choice 4 2,800 11,200 7%
New World 16 2,900 46,400 28%
PAK'nSAVE 6 6,900 41,400 25%
Super Value 6 900 5,400 3%
Total 48 3,500 166,800 100%
Table 2 also shows that the three major brands account for 90% of GFA, led by
Countdown with 37%, New World with 28%, and PAK'nSAVE on 25%. It also shows
that PAK'nSAVE stores are significantly larger than other brands. In fact, the average
PAK'nSAVE store is 77% larger than the average Countdown, and 138% larger than the
average New World store. This, in turn, reflects the “discount warehouse” nature of the
PAK'nSAVE brand, whose business model strongly relies on scale for profitability.
3.4 Impacts of the Quakes and Recent Changes in Supply
Several supermarkets were badly damaged by the quakes, but most have since been
repaired or rebuilt. However, a handful of stores are yet to be fully remediated, and are
therefore not operating at their full potential.
On the other side of the equation, a few new stores have opened since 2011, including
New World Wigram, New World Prestons, and Countdown Spitfire Square. However,
the additional GFA provided by these stores is probably only slightly higher than the
GFA still to be rebuilt, meaning that total GFA today is probably about the same as it
was pre-quake despite steady increases in annual supermarkets sales. This, in turn,
indicates that existing stores are likely to be trading well and that there is likely to be
headroom to accommodate additional supply.
1These figures were sourced from several places, including building consent data, media releases, and
the Property Council’s shopping centre database.
94 Current and Future Retail Demand
This section analyses current and future retail demand across greater Christchurch.
4.1 Effects of the Quakes
The devastating quakes of 2010/11 caused major economic disruption across the city,
and brought the CBD to a standstill. However, data from the Christchurch retail trade
indicator shows that the city’s retail sector has since recovered strongly. In fact, citywide
retail sales have been consistently increasing for more than five years, and are now 37%
higher than the trough of late 2010. 2 Hence, despite some obvious ongoing challenges,
the sector is in good health overall.
Figure 3: Christchurch Seasonally-Adjusted Retail Trade Index vs National Average
1,800
Christchurch
1,700 NZ
Seasonally-Adjusted retail Sales index (Base = 1000 in Dec 2004)
1,600
1,500
1,400
1,300
1,200
1,100
February 2011
Earthquake
1,000
900
800
2003Q4
2004Q2
2004Q4
2005Q2
2005Q4
2006Q2
2006Q4
2007Q2
2007Q4
2008Q2
2008Q4
2009Q2
2009Q4
2010Q2
2010Q4
2011Q2
2011Q4
2012Q2
2012Q4
2013Q2
2013Q4
2014Q2
2014Q4
2015Q2
2015Q4
2016Q2
4.2 Current Retail Expenditure
Having confirmed the sector’s general recovery, we next used our Integrated Retail Model
for Greater Christchurch to estimate current ‘core’ retail demand by store type.3 The
http://www.stats.govt.nz/~/media/Statistics/Browse%20for%20stats/ChristchurchRetailTradeIndicator/
2
HOTPJun16qtr/ChristchurchRetailTradeIndicatorJun16qtrHOTP.pdf
3 The IRM integrates real-world data from a range of sources, including detailed electronic transaction
data, and has been gradually developed over several years. It accurately predicts real world
transactions totalling billions of dollars across most major urban areas of the country and, as a result,
has been used to successfully support numerous retail developments nationwide. An earlier version of
the model was also used by CCC to help determine the appropriate size of the retail component of the
recently-created Halswell key activity centre.
10resulting estimates are presented in Table 3, and represent total retail demand across
greater Christchurch in 2017.4
Table 3: Estimated Core Retail Expenditure in Greater Christchurch in 2017 ($millions ex GST)
Core Retail Store Types Demand ($m) Shares
Clothing, Footwear and Personal Accessories Retailing $380 6%
Department Stores $480 8%
Electrical and Electronic Goods Retailing $320 5%
Food Retailing (incl. supermarkets) $2,330 38%
Food and beverage services $910 15%
Furniture, Floor Coverings, Houseware and Textiles $230 4%
Hardware, Building and Garden Supplies Retailing $620 10%
Pharmaceutical and Other Store-Based Retailing $580 10%
Recreational goods retailing $230 4%
Total $6,080 100%
Table 3 confirms that food retailing – which includes supermarkets – is the largest retail
category in greater Christchurch. In fact, the model estimates that food retailing will
exceed $2.3 billion this year (excluding GST), which equates to nearly 40% of core retail
demand across the study area.
4.3 Current Floorspace Demand
To estimate the current underlying demand for retail floorspace, we translated our
estimates of expenditure above into measures of floorspace uptake using industry-
standard estimates of sales productivity per square metre. The following table shows
our calculations, which yield an estimated 1.16 million square metres of retail floorspace
currently used for core retailing across greater Christchurch.
Table 4: Estimated Current Core Retail Floorspace across Greater Christchurch
Expenditure Average Floorspace
Core Retail Store Types
in 2017 ($m) Sales/m2 Demand (GFA)
Clothing, Footwear and Personal Accessories Retailing $380 $4,800 79,200
Department Stores $480 $3,000 160,000
Electrical and Electronic Goods Retailing $320 $6,000 53,300
Food Retailing (incl. supermarkets) $2,330 $11,500 202,600
Food and beverage services $910 $3,500 260,000
Furniture, Floor Coverings, Houseware and Textiles $230 $3,500 65,700
Hardware, Building and Garden Supplies Retailing $620 $3,800 163,200
Pharmaceutical and Other Store-Based Retailing $580 $4,800 120,800
Recreational goods retailing $230 $4,200 54,800
Total $6,080 n/a 1,159,600
As a cross-check, we note that research undertaken by Property Economics in 2013
estimated that citywide retail floorspace was just over one million square metres, which
is slightly less than our estimate. However, since Property Economics’ estimate is now a
4The model includes all store types deemed as core retail in the retail trade survey, except
accommodation and non-store (online) retailing.
11few years old, and because it excluded Selwyn and Waimakariri, the two estimates are
actually very close once these minor differences are accounted for. Accordingly, we
consider our demand estimates accurate and fit-for-purpose.
4.4 Projected Population Growth
Before estimating future retail demand, we first review forecast growth in the key
underlying driver – population – using Statistics New Zealand official projections. To
that end, Figure 4 plots the projected population to 2043 under three scenarios.
Figure 4: Population Projections for Greater Christchurch to 2043 (2013 base)
800,000
700,000
600,000
Study Area Population
500,000
400,000
300,000
200,000
Official Estimates
Low Projection
100,000
Medium Projection
High Projection
0
1996 1999 2002 2005 2008 2011 2014 2017 2020 2023 2026 2029 2032 2035 2038 2041
Relative to the estimated current population of 489,000, these projections equate to
estimated future growth of:
• 44,000 people (9%) under the low scenario,
• 153,000 people (31%) under the medium, and
• 263,000 people (54%) under the high scenario
Clearly, solid population growth is expected, which bodes well for the retail sector.
4.5 Projected Retail Expenditure
Table 5 presents our estimates of future retail expenditure, assuming that:
• Population growth will follow the Stats NZ medium projection,
• Inflation-adjusted household spending will continue to grow 1% annually, and
• Tourism and business spending will grow pro-rata with household spending to
maintain their respective shares over time.
12Table 5: Estimated Growth in Core Retail Expenditure to 2043 ($ millions ex GST)
Core Retail Store Types 2017 $m 2043 $m Growth $m
Clothing, Footwear and Personal Accessories Retailing $380 $600 $220
Department Stores $480 $760 $280
Electrical and Electronic Goods Retailing $320 $510 $190
Food Retailing (incl. supermarkets) $2,330 $3,680 $1,350
Food and beverage services $910 $1,440 $530
Furniture, Floor Coverings, Houseware and Textiles $230 $370 $140
Hardware, Building and Garden Supplies Retailing $620 $990 $370
Pharmaceutical and Other Store-Based Retailing $580 $920 $340
Recreational goods retailing $230 $370 $140
Total $m $6,080 $9,620 $3,540
To summarise: we project core retail sales to reach more than $9.6 billion by 2043, an
increase of $3.5 billion (58%) relative to today. While a chunk of that growth reflects
rapid expansion in neighbouring districts, the city’s population is also set to rise. In
addition, a significant share of retail expenditure originating in the neighbouring
districts leaks into the city anyway, so the overall picture for city retailers is strong.
4.6 Resulting Growth in Floorspace and Land Demand
Finally, we translate the estimated growth in expenditure above into measures of
corresponding growth in floorspace demand. This helps understand the future need for
additional, appropriately-zoned business land to meet the growing needs of the retail
sector over time. Table 6 sets out the workings.
Table 6: Estimated Growth in Demand for Retail Floorspace in Greater Christchurch to 2043
Expenditure Average Extra GFA
Core Retail Store Types
Growth ($m) Sales/m2 Required
Clothing, Footwear and Personal Accessories Retailing $220 $4,800 45,800
Department Stores $280 $3,000 93,300
Electrical and Electronic Goods Retailing $190 $6,000 31,700
Food Retailing (incl. supermarkets) $1,350 $11,500 117,400
Food and beverage services $530 $3,500 151,400
Furniture, Floor Coverings, Houseware and Textiles $140 $3,500 40,000
Hardware, Building and Garden Supplies Retailing $370 $3,800 97,400
Pharmaceutical and Other Store-Based Retailing $340 $4,800 70,800
Recreational goods retailing $140 $4,200 33,300
Total $3,540 n/a 681,100
According to our analysis, growth in retail expenditure will translate to additional
floorspace demand of more than 680,000m2 to 2043, including 117,400m2 of additional
floorspace for food retailing.
Assuming a floor area ratio of 0.5 – a typical average for retail – this floorspace growth
equates to an additional 136 hectares of land needed for future growth in retail activity.
135 Economic Rationale for the Proposal
This section analyses the commercial and economic rationale for the proposal.
5.1 Overview
The proposal to relocate the Northlands PAK’nSAVE store to the subject site is driven
by several related factors. They include:
• Future demand growth, which supports and requires future supply growth;
• The subject site is a good fit with operational requirements;
• There are limited opportunities for viable development elsewhere;
• The subject site is close to several priority growth areas;
• The proposal enables the highest and best use of the land;
• The community benefits of increased resilience and post-disaster capacity;
• The subject site is a relatively poor fit with most industrial uses, and
• There is ample industrial land available anyway.
Each point is discussed further below.
5.2 Response to Anticipated Demand Growth
Section 4.5 showed that retail expenditure is forecast to grow by 58% to 2043 under our
most-expected (medium) scenario. At the same time, section 2.4 showed that there are
currently 47 supermarkets across the study area. This means that, if supermarkets
maintain their current share of food retailing, future increases in retail expenditure will
support an extra 27 supermarkets across greater Christchurch by 2043. Couched in these
terms, the proposal is merely a natural market response expected ongoing growth in
retail expenditure over time.
5.3 Fit with Operational Requirements
Another reason for the proposal is that the subject site is a close fit with supermarket
operational requirements – particularly parking – which are unique for several reasons.
First, supermarkets account for the largest share of retail trade in New Zealand. This is
illustrated in Figure 5, which plots national data from the Retail Trade Survey.
Supermarkets and grocery stores clearly dominate.
14Figure 5: National Core Retail Sales in 2016 from Retail Trade Survey ($billions)
Supermarket and grocery stores $18.0
Food and beverage services $9.5
Hardware, building, and garden supplies $7.1
Pharmaceutical and other store-based retailing $5.3
Department stores $4.6
Accommodation $3.6
Clothing, footwear, and accessories $3.6
Electrical and electronic goods $3.2
Furniture, floor coverings, houseware, textiles $2.4
Recreational goods $2.1
Liquor $1.6
Specialised food $1.6
Non-store and commission-based retailing $1.5
$0 $2 $4 $6 $8 $10 $12 $14 $16 $18 $20
Annual Retail Sales in 2016 $B
Second, supermarkets are the only type of large format retail that provide
“convenience” – rather than comparison – retailing. The resulting combination of large
floorplates and high transaction frequency means that supermarkets not only generate a
lot of visits, but that those visits tend to be made by car. Consequently, supermarkets
need a lot of dedicated, nearby, and at-grade parking to facilitate the safe and efficient
movement of customers. In addition, they need sufficient space in and around the store
to facilitate continual deliveries from suppliers.
Third, because supermarkets are so frequently visited, customers demand that they be
easily accessible, otherwise they will seek to shop elsewhere. While the required level of
accessibility can sometimes be achieved at in-centre locations, stand-alone stores often
enable supermarkets to better meet the exacting needs of customers without impinging
on the needs and rights of other stores and their customers.
Finally, because PAK’nSAVE is a low-cost supermarket, it tends to attract a higher
proportion of “main order” shopping visits than Countdown or New World. These
main-order shopping visits involve the predictable purchase of grocery items to keep
the cupboards stocked with essentials, and are almost invariably made by car given the
larger-than-average basket size. This, in turn, makes adequate levels of parking even
more important for PAK’nSAVE stores than other types of supermarket.
5.4 Limited Opportunities to Establish Elsewhere
During its site selection process, Foodstuffs considered several possible locations.
However, because PAK'nSAVE is such a large store and has such strict operational
requirements, the pool of feasible locations was small. This is particularly true given the
need for future sites to not only enable new stores that are commercially viable in their
own right, but also which also do not undermine the operating performance of other
15nearby PAK'nSAVE stores. Indeed, the site selection process must consider not just the
merits of the site in isolation, but also its potential contribution to the overall operation
of the network of PAK'nSAVE stores. This greatly reduces the number of sites that meet
Foodstuffs’ location criteria.
In addition, colocation of the supermarket with the head office will strengthen the
resilience functions of the proposal. Such benefits cannot be realised elsewhere, and
hence are unique to the subject site.
5.5 Proximity to Growth Areas
Not only is the site a good match with operational requirements, but it is also close to
several priority growth areas. This is illustrated in the map below, which shows that the
store is within five kilometres of every priority growth area north of the CBD.
Figure 6: Priority Growth Areas Within 5 Kilometres of Site
5 km
5 km Site 5 km
5 km
5.6 Highest and Best Use of the Land
Foodstuffs has attempted to sell or lease the site for permitted, industrial uses without
success for several years, with the resulting vacancy incurring significant and ongoing
opportunity costs. Not only would the proposal rectify this, but it would also result in
16the land being put to its highest and best use. This, in turn, is a necessary condition for
economic efficiency to hold in the underlying market for business land.
5.7 Increased Building Resilience and Post-Disaster Capacity
The proposal will result in a highly-resilient building that will act as a discount
supermarket day-to-day and be a post-disaster structure with special functions in times
of future emergency. This increased building resilience and post-disaster capacity will
have several benefits to the wider community, including:
(a) Foodstuffs has made provision for Civil Defence or other emergency
management services to co-locate within the PAK’n SAVE or Foodstuffs Head
Office at the time of a Civil Defence emergency;
(b) Civil Defence can use the ECF to gather and organise resources, prepare for
assigned tasks (equipment checks, planning, briefings, and loading), and for
response personnel to recover after returning from a task;
(c) The onsite service station will provide for refueling of emergency vehicles;
(d) The Site will be a safe place for the local community to congregate to receive
resources, for communication of key information, or as a shelter, as directed by
the Crown and Civil Defence at the time of a national emergency; and
(e) Foodstuffs' will provide essential aid to Civil Defence by distributing fast
moving consumer goods and other resources to affected communities using its
relationships with its suppliers and its own fleet of truck and trailer units.
5.8 Site is Poor Fit with Industrial Uses
As explained in planning, traffic and economic reports commissioned by Foodstuffs
previously , the subject site is not a particularly good fit with many permitted/industrial
uses5. The main issues relate to heavy vehicle movements and the risk of reverse
sensitivity, and are also likely to be why Foodstuffs has been unable to lease or sell the
site under its industrial zoning. Allowing the land to be used for other purposes,
conversely, will release the land from such constraints, and enable it to meaningfully
contribute to the growing local economy.
5.9 Industrial Land is Relatively Abundant
Finally, not only is the land a poor fit with many permitted/industrial uses, but the city
already has an abundance of vacant industrial land. In fact, the Council’s website states
that there was 638 hectares of vacant industrial land already available as at June last
year. As discussed in section 7, this is far more than will ever be needed in future, which
further explains Foodstuffs’ inability to lease or sell the site for industrial purposes.
5For example, this issue was addressed in earlier reporting by Insight Economics as part of the
Christchurch Replacement District Plan hearing process.
1718
6          Analysis of Retail Distribution Effects
6.1        Steps in the Analysis
This section analyses potential flow-on effects associated with the proposal. It comprises
the following steps, each of which is worked through below:

      1.   Define retail distribution effects
      2.   Identify the most at-risk centres
      3.   For each centre, assess the likelihood of retail distribution effects occurring
      4.   Reach overall conclusions

6.2        Definition of Retail Distribution Effects
Under the RMA, decision makers must ignore the effects of trade competition when
evaluating proposals, and instead only consider flow-on (retail distributional) effects.
Such effects may arise if a new store or centre affects existing stores so badly that some
of them close, causing the centres of which they formed part to also decline significantly
overall. A strong body of case law confirms that trade impacts must be very high to go
beyond those ordinarily associated with trade competition, and that effects on
individual stores are irrelevant.

6.3        Centres at Potential Risk
Figure 7 reveals the site’s location within the centre network. It is shown as the blue dot.

                  Figure 7: Location of the Subject Site with the City’s Centre Network

                                                                                             19
Figure 7 shows that Cranford, Bishopdale and Papanui are the three closest centres to
the subject site. However, we consider Papanui to be the only centre that could possibly
experience retail distribution effects because:
1. It is the closest centre that contains a supermarket.
2. It is a key activity centre, and hence near the top of the hierarchy, and
3. The proposal causes a reshuffle of its major tenants.
Conversely, while Cranford is very close, it does not contain any stores that will directly
compete with the proposed new PAK'nSAVE. Similarly, while Bishopdale does contain
a supermarket that will compete, it is twice as far away as Cranford and Papanui, so any
effects will be muted. Accordingly, the rest of this section focuses only on the potential
adverse effects of the proposal on Papanui/Northlands.
6.4 Description of Papanui/Northlands
Papanui is a District Centre that is located about one kilometre south of the proposal. It
effectively comprises two parts:
• Northlands mall, and
• A long ribbon of commercial activity extending south from Northlands.
Northlands mall accounts for more than half of Papanui’s total GFA, and more than 80%
of its retail GFA. It is the third-largest retail area in the city, and the eighth-largest in NZ
by retail area (according to the Property Council’s 2016 Shopping Centre Database).
Interestingly, Northlands has more supermarket GFA than any other shopping centre in
New Zealand, except Sylvia Park in Auckland (11,300m2 vs 11,000m2).
To better understand the market pitch of Northlands, we used the latest detailed
employment data from Statistics New Zealand to identify its core retail mix. This is
summarised in the table below.
Table 7: Northlands Retail Employment in 2016
Core Retail Store Types Employees Shares
Cafes, Restaurants and Takeaway Food Services 180 16%
Clothing, Footwear and Personal Accessories Retailing 259 23%
Department Stores 95 8%
Electrical and Electronic Goods Retailing 25 2%
Furniture, Floor Coverings, Houseware and Textile Goods Retailing 18 2%
Pharmaceutical and Other Store-Based Retailing 109 9%
Recreational Goods Retailing 48 4%
Specialised Food Retailing 35 3%
Supermarket and Grocery Stores 380 33%
Grand Total 1149 100%
Table 7 shows that Northlands has a diverse retail offer with significant employment in
most categories. Perhaps most importantly, it has a strong offering in fashion, with
clothing, footwear and accessories accounting for nearly a quarter of mall retail
20employment. This is almost four times higher than the national average. At the same
time, the mall has a relatively weak offering in traditional bulk retailing categories like
furniture and hardware, which confirms that its market pitch is largely-oriented
towards discretionary, fashion-led shopping visits. This is confirmed by the presence of
cinemas and a foodcourt, which are often key components of such shopping visits.
6.5 Current Health and Vitality
Gauging the health and vitality of at-risk centres is important because, all other things
being equal, the likelihood of retail distribution effects occurring depends on the health
of at-risk centres, and hence their ability to withstand likely competitive effects.
Unfortunately, though, measuring the health and vitality of centres can be difficult,
particularly for large centres like Papanui. That said, the retail vacancy rate is a
frequently-used and easily-measured indicator of centre health, so we used that to
measure the health and vitality of Papanui/Northlands.
Specifically, we undertook detailed searches of online listings for commercial and retail
premises in Papanui to measures its current retail vacancy rate. Table 8 presents our
findings. Overall, eight vacant retail tenancies were identified, with a total GFA of just
over 1,500m2. Given a total centre size of more than 70,000m2, this translates to an
overall vacancy rate of 2.6%, which is low by any standard. Coupled with the findings
of numerous site visits over the last few years, we consider the centre to be healthy and
vital.
Table 8: Current Retail Tenancies Available in Papanui
Address GFA
12A Main North Road 74
17 Main North Road 185
18 Main North Road 100
18B Main North Road 100
34 Main North Road 200
466 Papanui Road 260
485 Papanui Road 323
7 Winston Avenue Papanui 342
Total 1,584
Perhaps most importantly, none of these vacancies are in Northlands. This is important,
because not only is Northlands the closest part of the centre to the subject site in
physical terms, but it is also the only part that is directly affected by the possibility of
replacing the PAK'nSAVE with a New World store. It is therefore reassuring to confirm
that the most at-risk element of Papanui is well-positioned to absorb any impacts.
6.6 Likely Impacts of the Proposal
We now consider likely impacts of the proposal on Papanui. For ease of exposition, we
split the discussion into impacts on (i) Northlands and, (ii) the rest of Papanui.
216.6.1 Impacts on Northlands
Overall, we also do not expect Northlands mall to experience any significant adverse
effects from the proposal because:
• It a large and successful mall with high footfall and no existing vacancies.
Accordingly, it is resilient and more than able to absorb any competitive effects.
• There will be limited competitive impacts on the mall’s own supermarkets
anyway, with the newly-established PAK'nSAVE competing mostly with other
PAK'nSAVE stores across the city.
• Study area supermarket expenditure is also predicted to grow steadily in future,
so not only will trade impacts be minor, but they will also be short-lived.
• The proposed supermarket will operate in a stand-alone manner and not be part
of a wider retail development. As a result, it will not provide any direct
competition for in-centre specialty retailers. Further, given the limited size and
scope of the adjacent Commercial Local zone, there is little (if any) scope for
cumulative adverse effects to arise in conjunction with the proposed
supermarket development.
• Moreover, people who previously shopped at specialty stores at Northlands
before or after their supermarket visit will return to those centres even if they no
longer frequent that centre’s supermarket, because those retailers remain the
best way to meet those specific retail needs.
6.6.2 Impacts on the rest of Papanui
Similarly, we do not consider the proposal to have any meaningful impact on the rest of
the Papanui centre because:
• It does not contain any stores that will compete directly with the proposal, and
• The existing PAK'nSAVE at Northlands is unlikely to generate much cross-
shopping for stores outside the mall, so the loss of that anchor tenant will have
little – if any – impact.
6.7 Conclusion on Flow-On Effects
Based on the discussion above, we do not consider the proposal to have any material
retail distribution effects. Accordingly, the proposal cannot be denied on such grounds.
227 Impacts on Supply of Industrial Land
This section analyses potential effects on the supply of industrial land.
7.1 Steps in the Analysis
Following are the key steps in the analysis:
1. Identify planned and actual future industrial land supply
2. Forecast future industrial land demand
3. Reconcile supply and demand
4. Assess likely impacts of the proposal
7.2 Planned and Actual Future Supply
The Council maintains a vacant land register, which documents the amount of vacant
land available for residential, commercial and industrial development. As at June 2016,
it recorded 638 hectares of vacant industrial-zoned land available. This is likely to
increase in future, however, as there was already 497 hectares of vacant industrial land
available just after the quakes6, and Chapter 6 of the RPS sought to rezone a further 488
hectares for industrial uses. Hence, total future supply of industrial land across the city
is approximately 985 hectares.
While it is important to ensure there is sufficient capacity to meet long-term needs, it is
also important that there is enough to also meet immediate and short-term needs. To
check this, we undertook a desktop survey of industrial land currently available across
the city. Our research identified nearly 250 hectares of land that is currently available
(mainly for industrial uses), including 200 hectares at Hornby Quadrant. This confirms
that there is also sufficient immediate supply to meet short-term needs.
7.3 Future Demand
Having assessed supply, we now turn to demand. First, we summarise a 2013 report by
Property Economics, which was commissioned by CCC as part of its District Plan
review. It includes 20-year employment-based forecasts of industrial land (between 2012
and 2031), which range between 288 and 350 hectares. Noting the abundance of supply,
the report rightly concludes that there will be more than enough industrial land to
support the efficient functioning and growth of the city’s industrial market.
We agree but, for completeness, undertake our own demand forecasts. These use a
similar approach to that used by Property Economics. However, in contrast, we:
1. Update the forecasting horizon to a 25-year period from 2018 to 2043.
2. Capture the impacts of population growth in neighbouring districts,
3. Assume growing labour-force participation by those 65+ (usually excluded), and
4. Model three demand scenarios to provide a likely range.
6Property Economics, Proposed Christchurch City District Plan Commercial and Industrial Chapters
Economic Analysis, November 2013, pp95.
23Figure 8 illustrates the modelling process.
Figure 8: Process for Estimating Future Industrial Land Demand
Identify future
Convert additional Convert extra
increases in the Translate growth in Estimate share of
industrial industrial
working age working age pop to additional city
employment to floorspace to
population of growth in city employment going
additional industrial additional demand
Greater employment to industrial sectors
floorspace for industrial land
Christchurch
Table 9 presents the resulting low, medium, and high projections.
Table 9: Projected Demand for Additional Industrial Zoned Land
Reference Steps in the Analysis Low Medium High
a Projected growth in the working age population7 27,430 36,570 45,710
b Future employment rate 65% 70% 75%
c Share of extra employment in industrial activities8 30% 33% 35%
d=a*b*c Projected future increase in industrial employment 5,350 8,450 12,000
e Average industrial floorspace per employee9 100 100 100
f=d*e Total additional industrial floorspace 535,000 845,000 1,200,000
g Average floor area ratio for industrial uses10 0.3 0.3 0.3
h = f * g/10,000 Additional demand for industrial land (ha) 178 282 400
In summary, we forecast demand for an additional 178 to 400 hectares of industrial land
to 2043, with a most-likely (medium) scenario of 282 hectares.
7.4 Summary and Conclusion
Our analysis indicates that there will be demand for an additional 178 to 400 hectares of
industrial land over the 25-year period to 2043, which is broadly-consistent with
Property Economics’ 20-year forecasts of 288 to 350 hectares. Given that there was 638
hectares of vacant industrial land already available as at June last year, the loss of 1.6
hectares due to this proposal will have no discernible effect. There will still be more than
enough industrial land to meet future needs, even under the most optimistic scenario.
7 The medium scenario equals the Stats NZ medium population projections, while the low scenario is
25% lower than the medium scenario, and the high is 25% higher.
8 This fell between 2000 and 2009, but has since increased again to 33% because of the rebuild.
9 This depends on the types of activity, but the value used is toward the upper end of the range.
10 This is a conservative estimate, with actual values typically ranging between 0.3 and 0.5.
248 Summary and Conclusions
This report has explored the economic rationale for Foodstuffs proposal to relocate its
PAK’nSAVE Northlands store to a site next to its head offices. In addition, this report
has analysed possible adverse economic effects of the proposal, including retail
distribution effects and the loss of industrial land.
The analysis finds that there is a strong and clear economic rationale for the proposal,
and that any retail distribution effects will be minor and relatively short-lived. In
addition, it has shown that the loss of industrial land as a result of the proposal is
immaterial given the abundance currently available.
Accordingly, we strongly support the resource consent on economic grounds.
25You can also read