Application of the Saffir-Simpson Hurricane Wind Scale to Assess Sand Dune Response to Tropical Storms - MDPI
←
→
Page content transcription
If your browser does not render page correctly, please read the page content below
Journal of
           Marine Science
           and Engineering

Article
Application of the Saffir-Simpson Hurricane Wind
Scale to Assess Sand Dune Response to
Tropical Storms
Jean T. Ellis * , Michelle E. Harris , Mayra A. Román-Rivera , J. Brianna Ferguson,
Peter A. Tereszkiewicz and Sean P. McGill
 Department of Geography, University of South Carolina, Columbia, SC 29208, USA;
 mh28@email.sc.edu (M.E.H.); mayrar@email.sc.edu (M.A.R.-R.); jbf2@email.sc.edu (J.B.F.);
 petert@email.sc.edu (P.A.T.); spmcgill@email.sc.edu (S.P.M.)
 * Correspondence: jtellis@sc.edu; Tel.: +1-803-777-1593

 Received: 24 July 2020; Accepted: 18 August 2020; Published: 1 September 2020

 Abstract: Over one-third of the Earth’s population resides or works within 200 km of the coast.
 The increasing threat of coastal hazards with predicted climate change will impact many global citizens.
 Coastal dune systems serve as a natural first line of defense against rising sea levels and coastal storms.
 This study investigated the volumetric changes of two dune systems on Isle of Palms, South Carolina,
 USA prior to and following Hurricanes Irma (2017) and Florence (2018), which impacted the island
 as tropical storms with different characteristics. Irma had relatively high significant wave heights
 and precipitation, resulting in an average 39% volumetric dune loss. During Florence, a storm where
 precipitation was low and winds were moderate, net volumetric dune loss averaged 3%. The primary
 driving force causing dune change during Irma was water (precipitation and storm surge), and during
 Florence, it was wind (aeolian transport). We suggest that the application of the Saffir-Simpson
 Hurricane Wind Scale classifications should be reconsidered because different geomorphic responses
 were measured, despite Irma and Florence both being designated as tropical storms. Site-specific pre-
 and post-storm studies of the dune morphology and site-specific meteorological measurements of the
 storm (wind characteristics, storm surge, precipitation) are critically needed.

 Keywords: coastal storms; tropical cyclones; coastal hazards; incipient foredunes; Saffir-Simpson
 Hurricane Wind Scale; Isle of Palms; South Carolina

1. Introduction
      Approximately 3.2 billion people either live or work within 200 km of a coastline [1]. Additionally,
it is estimated that more than 200 million people are under threat of extreme sea-level events
resulting from coastal storms [2]. During these storms, the beach-dune system serves as a natural
defense mechanism for the coastline, which is unfortunately threatened worldwide by storm-induced
erosion [3]. Dune response to storms is controlled by storm characteristics and the pre-existing
dune morphology [4–7]. Dunes are also weakened from multiple, frequent storm impacts [8–11].
Maintenance of the dunes is imperative not only to the natural environment, but also to the coastal
built environment and surrounding communities that provide provisioning, regulatory, cultural, and
support functions [12]. Accordingly, understanding the geomorphic response of dune systems to storm
events is vital based on the current population distribution, its anticipated growth, and estimations of
more frequent and intensifying tropical cyclones [13].
      Dunes are a critical sedimentological component of the beach-dune-bar system [14,15]. Storms can
have a range of impacts on the dunes, from minor scarping to major overwash or breach events [16,17].

J. Mar. Sci. Eng. 2020, 8, 670; doi:10.3390/jmse8090670                            www.mdpi.com/journal/jmse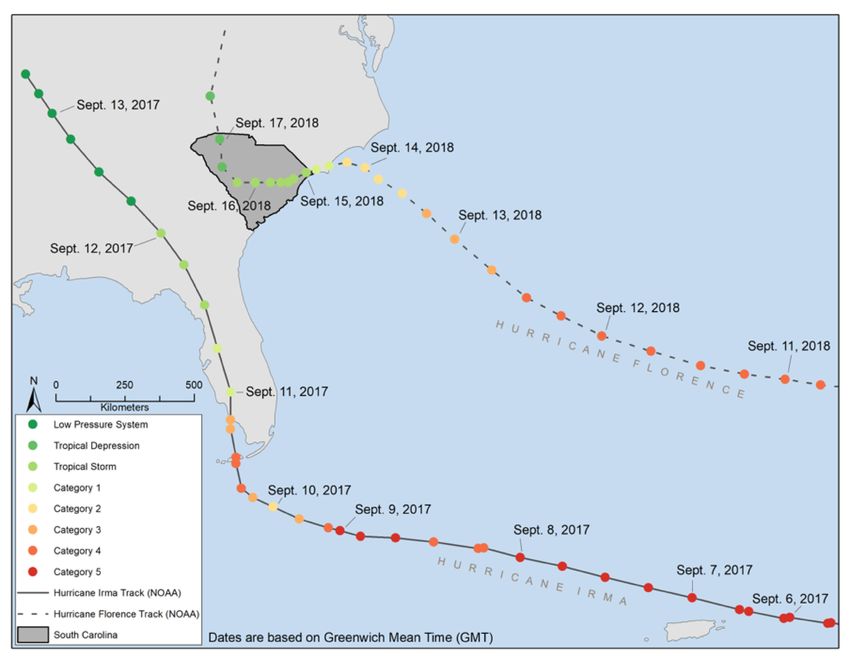
J. Mar. Sci. Eng. 2020, 8, 670                                                                        2 of 15

 Foredune height and extent, relative to the tidal stage during the storm event, are controlling factors
 on dune response [16,18,19], and are also directly related to sediment availability [20–23]. Individual
 characteristics of the storm or dune system can affect the observed geomorphic responses. Generally,
 they are summarized as the relationships between land elevations, water levels, and the stages of rising
 storm waters [24].
      Many studies have been conducted in barrier island dune systems to describe the observations
 and mechanisms of storm-based erosion (described in [14]), here we highlight those specific to
 hurricanes. Pre- and post-Dennis (2005) digital elevation models (DEMs) were generated to calculate
 a 7% volumetric loss along a 2 km long study site along the Florida Panhandle [25]. Following
 Hurricane Ivan (2004, Florida Panhandle), 70% of the incipient foredunes were destroyed and in several
 of their field study locations, storm overwash was noted [26]. During Ivan, it was suggested that
wave set-up and swash were the significant contributors to overwash processes and dune erosion [27].
 Specific to South Carolina, a 25% volumetric loss and a 9% volumetric gain at 14th and 56th Avenues,
 respectively, was measured on Isle of Palms following Hurricane Hugo (1989) [28]. These surveys were
 approximately 250 m in shore-perpendicular length (to −1.5 m MSL), and therefore covered the dune,
 beach, and a portion of the nearshore bar system [28]. Another study investigated Hugo along the coast
 of South Carolina and concluded there was severe beach and dune erosion [29]. They also found that
 high and continuous dunes served as a solid barrier to coastal inundation [29].
      The Saffir-Simpson scale is the industry standard to classify tropical cyclones formed in the
Atlantic and northern Pacific (East of the International Date Line). A form of this scale has been used for
 a half a century since Saffir aimed to provide a similar estimation to the Richter earthquake magnitude
 scale for hurricane property damage [30]. Simpson enhanced this concept with storm surge estimates,
which resulted in the Saffir-Simpson Hurricane Scale (SSHS) [31]. Despite its pervasive use, the SSHS
 has received substantial criticisms, including saturation at its higher end and issues related to the
‘hard transitions’ between categories, which then have substantial impacts on decision-makers and/or
 evacuation orders [32]. Following Hurricane Katrina (2005), many have proposed alternatives to the
 SSHS that consider adding maximum storm wind velocity, storm size, storm surge, and/or offshore
 bathymetry [32–34]. In response, the original SSHS that considered barometric pressure, storm surge,
 and maximum sustained wind velocity for 1 min was revised in 2010. The new scale, coined the
 Saffir-Simpson Hurricane Wind Scale (SSHWS), only considers a 1–5 categorical designation of the
 hurricane, based on the maximum 1 min sustained wind velocity. Unfortunately, the aforementioned
‘hard transition’ issue between the categories was not rectified. However, the SSHWS is used as an
 indicator to predict coastal geomorphic change [6].
      Scant research has acknowledged that variability of coastal morphologic change is related to
 and/or explained by SSHWS or its predecessor [16], and additional research is needed. However,
 it has been demonstrated that the interactions between the shoreline, storm, and subsequent coastal
 response are complex, and that site-specific studies are needed (e.g., [34]). Therefore, this study reports
 field-based geomorphic assessments of two dune systems on Isle of Palms, SC, USA, before and
 after Hurricanes Irma (2017) and Florence (2018). These data are used to determine the storm-based
volumetric changes. We also compare these changes to the characteristics of the two tropical storms
 upon impact with Isle of Palms.

2. Study Area
     Isle of Palms (IOP, Figure 1) is a barrier island located 15.5 km northeast of Charleston, SC,
USA, and is bordered by Dewees Inlet to the northeast and Breach Inlet to the southwest. It is a
drumstick barrier island and a mixed energy coast [35]. The tides are semidiurnal, with an average
range of 1.5 m and an average spring tidal range of 2.5 m [36]. Onshore wave heights average 0.6 m,
and fine-grained quartz sand transports alongshore from northeast to southwest at average rates of
120,000 m3 /yr [37]. The island’s beaches have been altered by humans since the 1970s [38]. Most
notably, there were substantial nourishments to the NE portion of the island towards Dewees Inlet (NE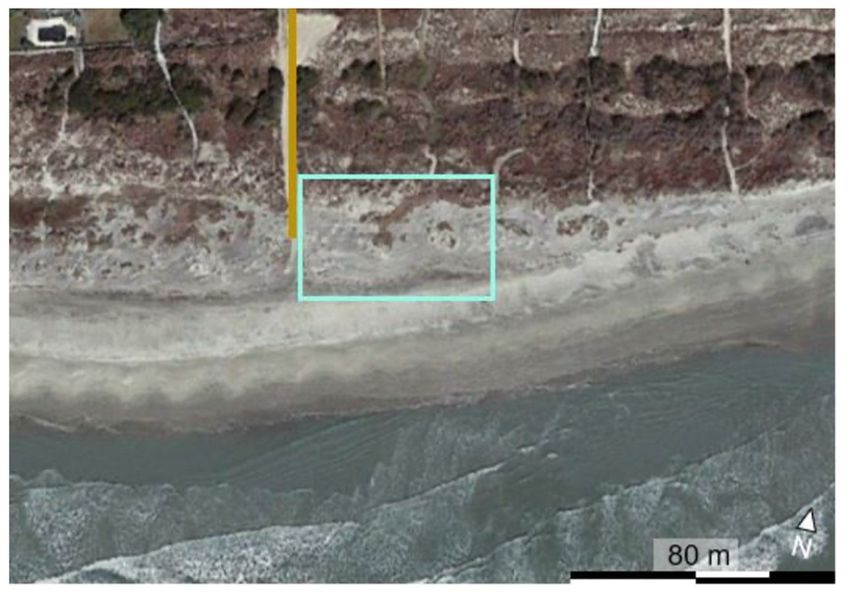
J. Mar. Sci. Eng. 2020, 8, 670 3 of 15
J. Mar. Sci. Eng. 2020, 8, x FOR PEER REVIEW 3 of 15
of 53rd
were Avenue, Figure
substantial 1) in 2010
nourishments to and
the 2018 [38]. The
NE portion of 2018 nourishment
the island towardscost $13.5 Inlet
Dewees million,
(NEspanned
of 53rd
~3.8 km, and comprised 1.282 million m 3 of sand [38]. Following hurricanes, it is common on this
Avenue, Figure 1) in 2010 and 2018 [38]. The 2018 nourishment cost $13.5 million, spanned ~3.8 km,
island
and to scrape1.282
comprised the beach, which
million m3 ofis sand
moving[38].sand from the
Following foreshore it
hurricanes, toisthe pre-storm
common on foredune
this islandline
to
(c.f., [39]).
scrape the beach, which is moving sand from the foreshore to the pre-storm foredune line (c.f., [39]).
De
we
es
In
let
km)
(15.5
ton
rles
Cha
s
a lm
of P
Isle Site B
NORTH
e A
t Sit
Inle
ach
Bre
4000 m
Figure 1.
1. Study
Studyarea
arealocated
locatedonon
IsleIsle of Palms,
of Palms, SC, USA.
SC, USA. The and
The blue bluered
and redindicate
dots dots indicate
Site A atSite A at
Pavilion
Pavilion
Drive andDrive
Site Band Site Avenue,
at 53rd B at 53rdrespectively.
Avenue, respectively. Theshows
The inset map inset the
maplocation
shows of
theIsle
location of within
of Palms Isle of
Palms
SC (redwithin SC (red
box). Base box). Base
imagery imagery
obtained fromobtained from from
Google Earth Google Earth from
September September 2018.
2018.
Historically, the
Historically, the dunes on the SW end of the island had heights that nearly doubled those found
in the NE, at approximately 1.5 and 0.7 m, respectively [35]. The NE end end of
of the
the island
island waswas historically
historically
described as unstable and erosional, while the SW end was accretional [40]. Accretion in this area was
reinforced by
reinforced byalongshore
alongshoresediment
sedimenttransport
transport patterns
patterns [35] and
[35] average
and averagelowlow
wave energy
wave conditions
energy [41].
conditions
However, more recently, the island’s SW portion (especially southwest of
[41]. However, more recently, the island’s SW portion (especially southwest of Site A at PavilionSite A at Pavilion Drive,
Figure 1)
Drive, is highly
Figure 1) iserosional (personal(personal
highly erosional observation). There have
observation). beenhave
There highbeen
energy events
high impacting
energy events
South Carolina
impacting Southannually
Carolinafrom 2015–2020.
annually Furthermore,
from 2015–2020. the influence
Furthermore, the of king tides
influence is increasing
of king tides is
(c.f., [39]). (c.f., [39]).
increasing
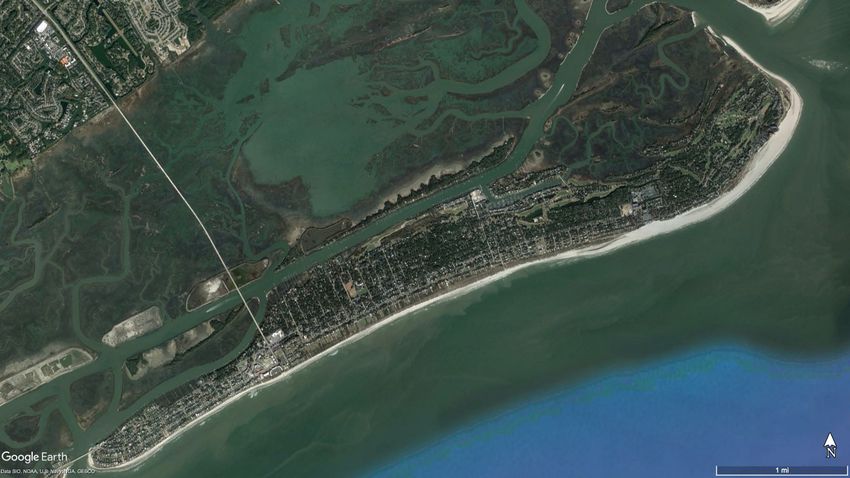
Two dune systems along IOP were investigated. The selected locations are part of a longitudinal
study that has been in place since Hurricane Matthew (2016) (c.f., [42]). Both sites are located adjacent
to public beach access points, one at Pavilion Drive along Front Beach (Site A; Figure 2a) and a second
at 53rd Avenue (Site B; Figure 2b). Site A has higher relative pedestrian foot traffic, with 50–150 m of
beach in in front
frontofofthe
thecurrent
currentsetback
setback line, depending
line, depending on on
thethe
tidal stage
tidal [43].[43].
stage SiteSite
B is aB wider beach-dune
is a wider beach-
systemsystem
dune with 125–190 m of beach-dune
with 125–190 complexcomplex
m of beach-dune between between
the setbacktheline and waterline
setback line and[43], depending
waterline [43],
on the tidal on
depending stage.
the This
tidalsite receives
stage. This minimal impact
site receives from beachgoers
minimal impact from because of its proximity
beachgoers because oftoitsa
private,
proximity gated
to acommunity
private, gatedthatcommunity
is located justthatNE
is of the study
located site of
just NE andtheextends
study to sitethe
andend of the island.
extends to the
Additional detailsAdditional
end of the island. about the dune characteristics
details about the dune are characteristics
discussed later.are discussed later.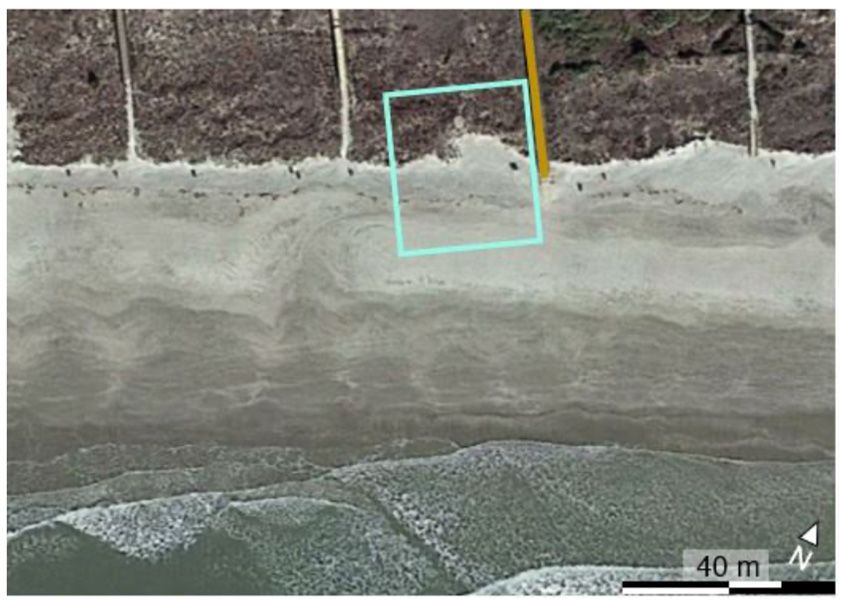
J. Mar. Sci. Eng.
Eng. 2020,
2020, 8,
8, x670
FOR PEER REVIEW 44of
of 15
(a) (b)
Figure
Figure 2.
2. Aerial
Aerial images
images of
of (a)
(a) Sites
Sites AA and
and (b)
(b) B.
B. The
The yellow
yellow colored
colored lines
lines show
show the
the location
location of
of the
the
pedestrian
pedestrian boardwalk
boardwalkatat(a)(a)and thethe
and 53rd Avenue
53rd Avenue beach access
beach (b). Google
access Earth imagery
(b). Google from March
Earth imagery from
2018.
March 2018.
3. Hurricanes
3. Irma and
Hurricanes Irma Florence
and Florence
This study
This study considers
considers Hurricanes Irma and
Hurricanes Irma Florence (Figure
and Florence (Figure 3). At peak
3). At peak intensity, Irma was
intensity, Irma was aa
Category 5 [44] using the SSHWS. Irma first made landfall on U.S. soil at Cudjoe
Category 5 [44] using the SSHWS. Irma first made landfall on U.S. soil at Cudjoe Key, Florida as Key, Florida as aa
Category 3 storm. It traveled up the Florida peninsula and dissipated over Missouri.
Category 3 storm. It traveled up the Florida peninsula and dissipated over Missouri. Florence was a Florence was
a Category
Category 4 4hurricane
hurricaneatatitsitspeak
peakintensity
intensityaccording
accordingto tothe
the SSHWS
SSHWS [45]. Florence made
[45]. Florence made landfall
landfall at
at
Wrightsville Beach, North Carolina, approximately 240 km from IOP, as a Category
Wrightsville Beach, North Carolina, approximately 240 km from IOP, as a Category 1 hurricane, 1 hurricane, using
the SSHWS.
using Tropical
the SSHWS. storm conditions
Tropical were measured
storm conditions in SouthinCarolina
were measured during Irma
South Carolina during Florence,
andIrma and
despite Irma’s
Florence, despiteeye not traveling
Irma’s into the state
eye not traveling into [44,45].
the state [44,45].
South
South Carolina
Carolina Isle
Isle of
of Palms
Palms
Figure
Figure 3.
3. Hurricanes
Hurricanes Irma
Irma and
and Florence
Florence path
path [46,47].
[46,47].
Wind and andwave
wave
data data were obtained
were obtained from the
from the National National
Oceanic Oceanic and
and Atmospheric Atmospheric
Administration’s
Administration’s
(NOAA) National(NOAA) Data BuoyNational
Center Data
(NDBC)Buoy Center
(Station (NDBC)
41004) (Station 41004)
to temporally to temporally
encompass the South
encompass the South
Carolina-issued Carolina-issued
hurricane hurricane
watches for Irma watches
and Florence forthe
and Irma and
field Florence
surveys and the field
conducted surveys
for this study.
conducted for this
The hurricane study.
watches The 30
were hurricane
August watches were
2017 to 12 30 August
September 2017
2017 fortoIrma,
12 September 2017 for
and 30 August Irma,
2018 to
and 30 August2018
18 September 2018for
to Florence.
18 September 2018survey
The field for Florence. The are
protocols field survey protocols
described in Sectionare
3. described
This NOAA in
Section 3. This NOAA NDBC station is located 73 km southeast of Breach Inlet (Figure 1) and is the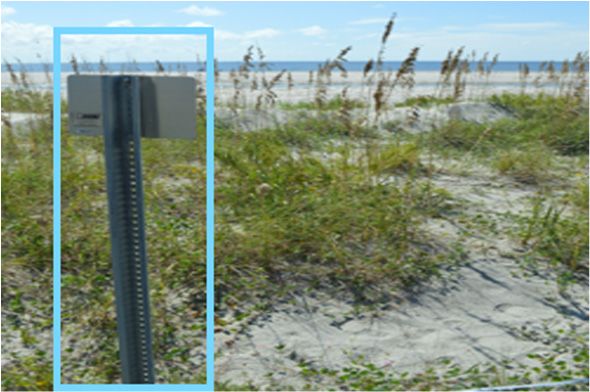
J. Mar. Sci. Eng. 2020, 8, 670 5 of 15
J. Mar. Sci. Eng. 2020, 8, x FOR PEER REVIEW 5 of 15
NDBC station is located 73 km southeast of Breach Inlet (Figure 1) and is the closest instrument suite
closest instrument suite that simultaneously measures wind and waves. NOAA reports a 20 min
that simultaneously measures wind and waves. NOAA reports a 20 min average significant wave
average significant wave height every hour. Maximum and average 8 s wind gust speeds, measured
height every hour. Maximum and average 8 s wind gust speeds, measured during 2 min periods, are
during 2 min periods, are reported every 10 min from an anemometer 4.1 m above the surface. The
reported every 10 min from an anemometer 4.1 m above the surface. The maximum wind gust is from
maximum wind gust is from the 10 min time interval. All wind and wave data obtained from the
the 10 min time interval. All wind and wave data obtained from the NOAA station are averaged to
NOAA station are averaged to 3 h time blocks for data presentation purposes. Wind and wave data
3 h time blocks for data presentation purposes. Wind and wave data were used to identify possible
were used to identify possible forcing events, herein defined as >2σ of the hurricane watch temporal
forcing events, herein defined as >2σ of the hurricane watch temporal duration. The >2σ threshold
duration. The >2σ threshold has been used by other researchers, including those studying dunes at
has been used by other researchers, including those studying dunes at IOP [39,48,49]. Figure 4 shows
IOP [39,48,49]. Figure 4 shows the NOAA Station 41004 data where the 2σ threshold significant wave
the NOAA Station 41004 data where the 2σ threshold significant wave heights, wind speeds, and wind
heights, wind speeds, and wind gusts during the hurricane watch are denoted by arrows. The
gusts during the hurricane watch are denoted by arrows. The temporal duration of the hurricane
temporal duration of the hurricane watch and the date of storm impact on IOP are also noted.
watch and the date of storm impact on IOP are also noted.
(a) (b)
Figure4.4.Significant
Figure Significantwave
waveheights,
heights,wave
wavespeeds,
speeds,and
andwind
windgusts
gustsduring
duringthe
the(a)
(a)Irma
Irmaand
and(b)
(b)Florence
Florence
study periods.
study periods.
Irmaweakened
Irma weakenedtotoaatropical
tropicalstorm
stormas asititapproached
approachedthetheU.S.
U.S.Southeast.
Southeast.ItItdiddidnot
notmake
makelandfall
landfall
onthe
on thecoast
coast of
of South
South Carolina, but impacted
impacted IOP IOPonon1111September
September2017.
2017.MeanMean wind
wind speeds were
speeds 7.3
were
m/sm/s
7.3 andandbidirectional,
bidirectional,with peak
with peakwind
windgusts
gustsofof30.1
30.1m/s
m/s from
from the NENE (Table
(Table1).1). The
TheCharleston
Charleston
CommunityCollaborative
Community Collaborative Rain,
Rain, Hail
Hail &&Snow
SnowNetwork
Network(CoCoRaHS)
(CoCoRaHS) sitessitesrecorded
recordedan anaverage
averageofof
184.25mm
184.25 mmrainfall
rainfallduring
duringthe
thestorm
storm[44].
[44].The
Thepeak
peakstorm
stormsurge
surge(storm
(stormtide
tideminus
minusthe theastronomical
astronomical
tide)atatthe
tide) theCharleston
CharlestonNOAA
NOAANational
NationalOcean
OceanService
Servicegauge
gaugewas
was1.28
1.28mmMHHW
MHHW[44]. [44].The
Thepeak
peakstorm
storm
tideobserved
tide observedat at Charleston
Charleston Harbor
Harbor was was the third-highest
the third-highest on record
on record at that
at that time, time,
as the as the
storm storm
impacted
impacted
IOP IOP approximately
approximately at high tideat[50].
high tide 1[50].
Table Tablea1summary
provides provides of
a summary of stormfor
storm conditions conditions for
Hurricanes
Hurricanes
Irma Irma and
and Florence, Florence,
as they as to
pertain they pertain to
conditions conditions
on, or neareston, or nearest
available available to, IOP.
to, IOP.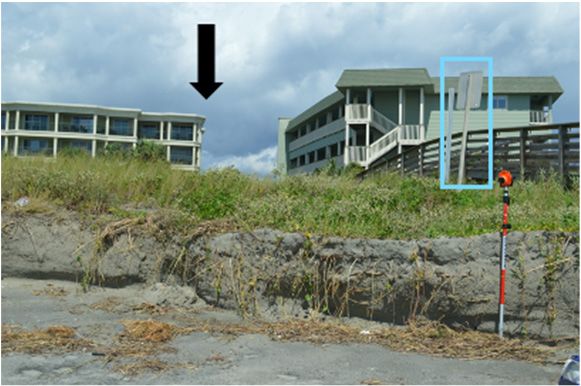
J. Mar. Sci. Eng. 2020, 8, 670                                                                            6 of 15

      Table 1. Summary storm conditions during Irma and Florence obtained from the closest instrument(s)
      to Isle of Palms.

                                                                              Irma          Florence
                             SSHWS                                      Tropical storm   Tropical Storm
                                                       Average               7.3 *             6.0 *
                       Wind Speed (m/s)
                                                         2σ                  8.9 *             7.2 *
                                                       Average               9.4 *             7.6 *
                        Wind Gust (m/s)                  2σ                 11.5 *             9.0 *
                                                      Maximum               30.1 *            23.6 *
              Dominant Storm Wind Direction                                 NE *             SSW *
                                                       Average               1.8 *             3.1 *
                 Significant Wave Height (m)
                                                         2σ                  1.3 *             1.4 *
                  Storm Surge (m) MHHW                                      1.28 ◦            0.45 #
               Storm Precipitation Total (mm)                              184.25 ◦          31.75 #
                                          * NOAA Station 41004; ◦ [44]; # [45].

     Similarly to Irma, Florence weakened from a hurricane to a tropical storm before impacting IOP on
15 September 2018 when the tides were low. Mean wind speeds were 6.0 m/s (predominantly from the
SSW), with peak wind gusts measured at 23.6 m/s that were predominantly from the SSW (NOAA
Station 41004; Table 1). Florence was a slow, forward-moving storm along its path. This resulted in
large precipitation totals and devastating floods, which were evident in north South Carolina and
North Carolina [45]. However, closer to the IOP study site (at the Charleston airport), less rain was
measured (31.75 mm) during the storm [45]. The peak storm surge at the NOAA’s National Ocean
Service Charleston gauge was 0.45 m MHHW [45].

4. Assessing Dune Change
     Field data collection was executed prior to and after each storm at Sites A and B. Pre- and post-Irma
data collection was conducted on 7 and 14 September 2017. The pre-hurricane Florence survey took
place on 10 September 2018, and the post-Florence survey was conducted on 23 September 2018.
     Topographic data were obtained using a Sokkia Series 30R Total Station, which has an instrument
accuracy of +/−2 mm. Points were recorded approximately every meter and at geomorphic breaks
along shore-perpendicular transects. At Site A, eight transects were spaced 6.5 m apart over a shore
parallel length of 44.5 m (Figure 2a). At Site B, ten transects were spaced 5.5 m apart over a shore
parallel length of 55 m (Figure 2b). There was an average of 165 points at Site A and an average of 265
points at Site B recorded during each survey. Site B is a wider beach-dune system in the cross-shore and
alongshore directions. Benchmarks and the total station locations were established using an X90-OPUS
Static GPS receiver that has a +/−5 mm instrument accuracy.
     This study focuses on the dunes, however, measurements were also obtained (and presented) for
the beach to understand the erosion and accretion of both systems. The onshore extents of Sites A and
B are landward of the pre-Hurricane Matthew primary foredune, and are the same baselines that were
used by others at the same field sites [42]. The offshore extents of the dunes are defined according to
the dune toes, which are dynamic and defined as where there is a distinct change in slope between the
dune and backshore. The offshore extents of the beaches are static. The intervening space between
the dune toes and the offshore beach lines comprise a narrow zone of the upper backshore that is not
inundated by tides. It is recognized that the beach definition used in this paper is not traditional, and it
is not the same that is used by others [14,51]. However, there is precedent when studying the same
IOP system for using these same beach and dune definitions [42].
     The survey points were used to create digital elevation models (DEMs) and DEM-based change
maps to estimate beach and dune volumetric change using the above-mentioned beach and dune
definitions. DEMs were generated using the ordinary kriging method, with cell and lag sizes of 0.2 m.
The semivariogram model was spherical. The average RMSEs for Sites A and B were 0.03 m and 0.02 m,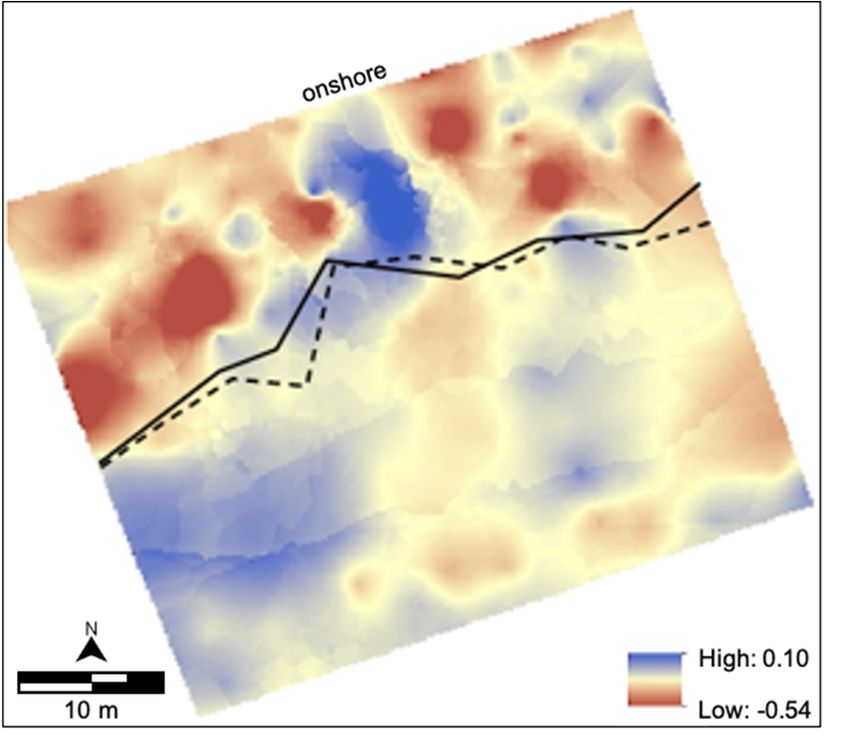
J. Mar. Sci. Eng. 2020, 8, 670                                                                           7 of 15

respectively. These averages do not include the Site A post-Irma survey because changing the backsite
resulted in an RMSE of 0.15 m. The DEM plane height was −1.0 m for both sites. Normalized DEM
volumes were calculated by dividing the post-storm by pre-storm volumes. DEM change maps are
valuable to identify regions of erosion and accretion over time, which in this case is pre- to post-storm
conditions. However, exact survey points and field notes were used to identify the dune toe line.

5. Results

5.1. Site A Beach-Dune System
     Before Hurricane Irma at Site A, the dune system was generally characterized as a foredune that
was recovering following Hurricane Matthew (2016) (c.f., [42]). It was a rounded dune ridge with no
defined scarp. Vegetation was abundant onshore of the dune crest and portions of the offshore dune
slope (Figure 5a–c). Hurricane Irma scarped the dune resulting in a near-vertical slope with exposed
roots (Figure 5d–f). The storm deposited beach wrack offshore of the post-storm dune toe (Figure 5d–f).
The DEM change map (Figure 6a) shows almost consistent spatial volumetric gain onshore of the
post-storm dune toe line. Substantial volumetric loss was observed directly onshore of the pre-storm
dune toe line. The lateral onshore dune toe erosion from Irma ranged from 2.0 to 8.5 m. The total range
of change from Irma, using a DEM change map was 2.51 m (−1.19 to 1.32 m).
     The pre-Florence photographs show that the Irma storm scarp is still present and that slumping
occurred during the last year (Figure 5g–i). The details of the intervening time between Irma and
Florence are beyond the scope of this paper, but addressed elsewhere (c.f., [42]). Pioneering stabilizing
species, such as Hydrocotyle bonariensis, were present along the pre-storm dune toe. The most noticeable
geomorphic change post-Hurricane Florence was the depositional lobe at the scarp base (Figure 5j–l).
This depositional lobe is best illustrated in Figure 5i,l that compare the pre- and post-storm conditions
and show the post-storm vegetation burial. The Florence DEM change map reveals a complex pattern
of erosion and deposition ranging from 0.44 to −0.59 m. The post-storm depositional lobe on the NE
side of the site (noted above) is captured by the DEM change map (Figure 6b, green box). The DEM
change map also reveals erosion along the SW portion of the site. From a quantitative perspective,
Site A had a greater loss in dune volume following Irma (28%), compared to the volume loss following
Florence that was statistically negligible (Table 2). There was minimal lateral dune toe change when
comparing pre- and post-storm conditions, the maximum retreat approximated 0.5 m.

      Table 2. Dune volumes (m3 and normalized volumes (nv)) for pre- and post-Irma and Florence for Sites
      A and B.

                                                        Irma               Florence
                                                 Pre-          Post-    Pre-     Post-
                                   SITE A
                                 Volume (m3 )   1762.2     1437.1      1488.9   1482.1
                                     nv          1.00       0.82        1.00     1.00
                                   SITE B
                                 Volume (m3 )   4934.6     2017.3      2953.5   2772.7
                                     nv          1.00       0.41        1.00     0.94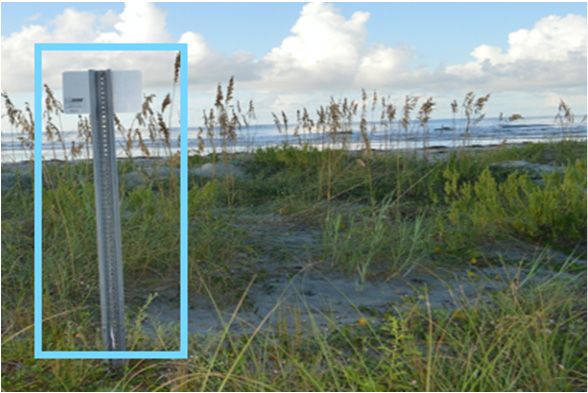
J.J. Mar.
     Mar. Sci.
          Sci. Eng.
               Eng. 2020, 8, x670
                    2020, 8,   FOR PEER REVIEW                                                                    88of
                                                                                                                     of 15
                                                                                                                        15

                   (a)                                     (b)                                     (c)

                   (d)                                     (e)                                     (f)

                   (g)                                     (h)                                     (i)

                   (j)                                     (k)                                     (l)
      Figure  5. Site
      Figure 5.       A field
                 Site A  fieldphotographs
                               photographsshowing
                                             showingconditions
                                                      conditions (a,b,c)
                                                               (a–c)     pre-Irma,
                                                                     pre-Irma, (d–f)(d,e,f) post-Irma,
                                                                                     post-Irma,         (g,h,i) pre-
                                                                                                 (g–i) pre-Florence,
      Florence, and   (j,k,l) post-Florence. Symbology  denotes  anthropogenic    or  natural  locations
      and (j–l) post-Florence. Symbology denotes anthropogenic or natural locations that are consistent    that are
                                                                                                                  to
      consistent  to more   than
      more than one photograph.  one  photograph.

     The pre-Florence photographs show that the Irma storm scarp is still present and that slumping
occurred during the last year (Figure 5g–i). The details of the intervening time between Irma and
Florence are beyond the scope of this paper, but addressed elsewhere (c.f., [42]). Pioneering stabilizing
species, such as Hydrocotyle bonariensis, were present along the pre-storm dune toe. The most
noticeable geomorphic change post-Hurricane Florence was the depositional lobe at the scarp base
(Figure 5j–l). This depositional lobe is best illustrated in Figures 5i,l that compare the pre- and post-
storm conditions and show the post-storm vegetation burial. The Florence DEM change map reveals
a complex pattern of erosion and deposition ranging from 0.44 to −0.59 m. The post-storm
depositional lobe on the NE side of the site (noted above) is captured by the DEM change map (Figure
6b, green box). The DEM change map also reveals erosion along the SW portion of the site. From a
quantitative perspective, Site A had a greater loss in dune volume following Irma (28%), compared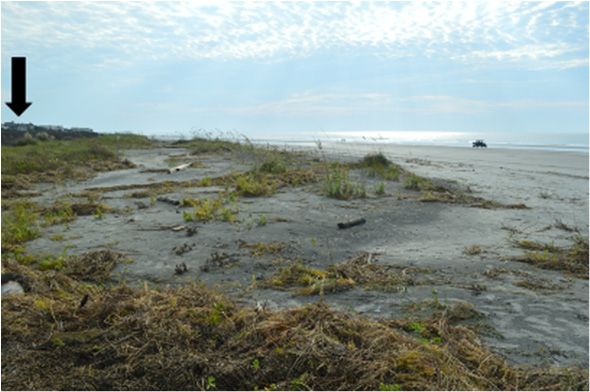
J. Mar. Sci. Eng. 2020, 8, x FOR PEER REVIEW 9 of 15
to the volume loss following Florence that was statistically negligible (Table 2). There was minimal
lateral dune toe change when comparing pre- and post-storm conditions, the maximum retreat
approximated
J. 0.58,m.
Mar. Sci. Eng. 2020, 670 9 of 15
e
hor
e hor
ons ons
High: 1.32 High: 0.44
Low: -1.19 Low: -0.59
(a) (b)
Figure 6. Site
Site A
A digital
digital elevation
elevation models
models (DEM)
(DEM) change
change maps
maps for
for Hurricanes
Hurricanes (a)(a) Irma
Irma and
and (b)
(b) Florence.
Florence.
pre- and
The dashed and solid lines show the pre- and post-storm
post-storm dune
dune toe
toe lines,
lines, respectively.
respectively.
5.2. Site B Beach-Dune
Table System
2. Dune volumes (m3 and normalized volumes (nv)) for pre- and post-Irma and Florence for Sites
A and B.Hurricane Irma at Site B, there was an incipient dune field with new-growth vegetation
Before
(Figure 7a,b). Hurricane Irma eroded the offshore Irmaportion of the incipient
Florence dune field, leaving behind
storm wrack (Figure 7c,d). The DEM change Pre-map (Figure
Post- 8a) confirms
Pre- the substantial dune erosion.
Post-
Four shore-parallel incipient foredunes
SITE A were eliminated, resulting in a maximum of 1.41 m of erosion
(Figure 8a, green box). Volume (m ) portion
The onshore 3 1762.2of the1437.1
study site1488.9
experienced 1482.1
accretion (up to 0.40 m),
nv
with that sand concentrated around 1.00
a few mounds 0.82 the NE
toward 1.00 1.00
and SE extremes (Figure 8a). Table 2
SITE B
shows that the normalized volume decreased substantially from 1.00 to 0.41 from the pre- to post-Irma
Volume (m3) 4934.6 2017.3 2953.5 2772.7
surveys. The onshore, lateral dune retreat from Irma ranged from 12.0 to 20.0 m.
nv 1.00 0.41 1.00 0.94
Prior to Florence, the incipient foredune system was visually similar to the pre-Irma condition,
with new-growth vegetation present (Figure 7e,f). Field observations and the corresponding
5.2. Site B Beach-Dune System
photographs (Figure 7g,h) suggested that the site was minimally impacted by Florence. The solitary
Beforepatch
vegetation Hurricane
visibleIrma at Site
before andB, there
after thewas
storman (Figure
incipient dune
7e,g) field with
remained new-growth
intact. However,vegetation
the DEM
change map (Figure 8b) reveals a complex spatial pattern of volumetric gains and losses. leaving
(Figure 7a,b). Hurricane Irma eroded the offshore portion of the incipient dune field, behind
The magnitude
storm
of wrack
change (Figure
ranges from 7c,d).
0.10 The DEMm,change
to –0.54 whichmap (Figure 8a) smaller
is substantially confirms the substantial
compared dune location
to the other erosion.
Four shore-parallel incipient foredunes were eliminated, resulting in a maximum
and scenarios considered. Table 2 codifies this low magnitude change; the normalized volume of 1.41 m of erosion
was
(Figure
0.94. The8a, green box).
onshore dune The onshore
toe retreat portion
from of the
Florence wasstudy site with
minimal, experienced accretion
an average onshore (up to 0.40 m),
regression of
with that sand concentrated
approximately around a few
1.0 m. The normalized moundsvolume
post-storm toward changes
the NE and SE extremes
at this site were (Figure
0.41 for8a).
IrmaTable
and
2 shows
0.94 that the normalized volume decreased substantially from 1.00 to 0.41 from the pre- to post-
for Florence.
Irma surveys. The onshore, lateral dune retreat from Irma ranged from 12.0 to 20.0 m.
Prior to Florence, the incipient foredune system was visually similar to the pre-Irma condition,
with new-growth vegetation present (Figure 7e,f). Field observations and the corresponding
photographs (Figure 7g,h) suggested that the site was minimally impacted by Florence. The solitary
vegetation patch visible before and after the storm (Figure 7e,g) remained intact. However, the DEM
change map (Figure 8b) reveals a complex spatial pattern of volumetric gains and losses. The
magnitude of change ranges from 0.10 to –0.54 m, which is substantially smaller compared to the
other location and scenarios considered. Table 2 codifies this low magnitude change; the normalized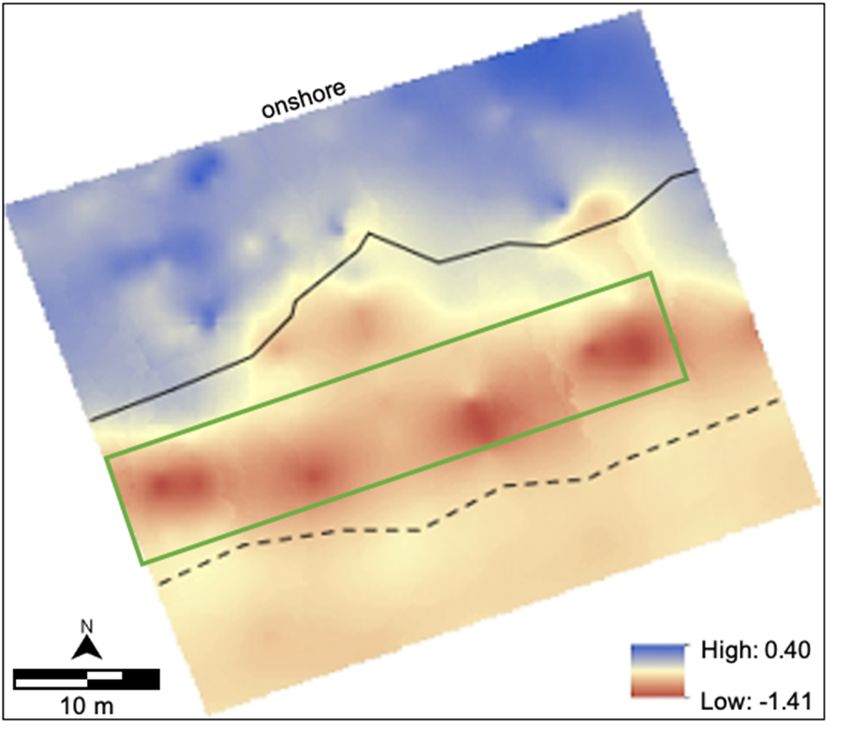
J. Mar. Sci. Eng. 2020, 8, x FOR PEER REVIEW                                                                                10 of 15

volume was 0.94. The onshore dune toe retreat from Florence was minimal, with an average onshore
regression of approximately 1.0 m. The normalized post-storm volume changes at this site were 0.41
for Irma and
         J. Mar. 0.94  for2020,
                 Sci. Eng.  Florence.
                                8, 670                                              10 of 15

                                         (a)                                           (b)

                                         (c)                                           (d)

                                         (e)                                           (f)

                                        (g)                                            (h)
     Figure 7.Figure     Site B
               Site B7.field    field photographs
                              photographs         showing
                                              showing     conditions (a,b)
                                                        conditions   (a,b)pre-Irma,
                                                                           pre-Irma,(c,d) post-Irma,
                                                                                        (c,d)        (e,f) pre-Florence,
                                                                                              post-Irma,    (e,f) pre-Florence,
              and (g,h)  post-Florence. Symbology   denotes anthropogenic  or natural locations that are
     and (g,h) post-Florence. Symbology denotes anthropogenic or natural locations that are consistent    consistent to     to
              more than one photograph.
     more than one photograph.
J. Mar. Sci.
J. Mar. Eng.
Sci. 2020,
Eng. 8,8,
2020, 670
x FOR PEER REVIEW 11 of
11 of 15
15
(a) (b)
Figure
Figure 8. 8.Site
SiteBBDEM
DEMchange
changemaps
mapsfor
forHurricanes
Hurricanes(a)
(a)Irma
Irmaand
and(b)
(b)Florence.
Florence. The
The dashed
dashed and
and solid
solid lines
lines
show the pre- and post-storm dune toe lines, respectively.
show the pre- and post-storm dune toe lines, respectively.
6. 6.Discussion
Discussion
HurricanesIrma
Hurricanes Irmaand andFlorence
Florenceimpacted
impactedthe theIOP
IOPdunes
dunesas astropical
tropicalstorms
storms with
with similar
similar intensities
based
based ononSSHWS.
SSHWS. However,
However, analysis
analysis of the storm
of the stormcharacteristics
characteristics (Table 1 and
(Table Figure
1 and 4) suggests
Figure 4) suggests thatthat
the
overall systemsystem
the overall energetics were substantially
energetics less for Florence
were substantially less for compared to Irma, except
Florence compared to Irma, for significant
except for
wave height wave
significant (despite the (despite
height closer geographic proximity of
the closer geographic Florence of
proximity to Florence
the fieldtosite). For site).
the field example, For
example,
during Irma,during Irma, the maximum
the maximum and average and average
wind gust wind
was 28%gustandwas24% 28%higher,
and 24% higher, respectively
respectively (Table 1).
In(Table
addition,1). In
theaddition, the precipitation
precipitation and storm and surgestorm
was surge
574% was and 574%
284% andhigher284% higher
during during
Irma (Table Irma
1).
(Table4 strongly
Figure 1). Figuresuggests
4 strongly thatsuggests
the storm that the stormwere
energetics energetics
limitedwereto thelimited
durationto the duration
of Irma of Irma
and Florence
andand Florence
that and that geomorphic
no substantial no substantial geomorphic
changes changes
were likely werethe
outside likely outside
temporal the temporal
duration of eitherduration
storm.
of either
These data storm. These data
also exemplify thealso exemplify
variability the variability
of conditions of conditions
observed observed
in situ, even withininthesitu, even within
‘tropical storm’
the ‘tropical storm’
classification. classification.
Accordingly, Accordingly,
even though even though
both systems both systems
impacted the IOPimpacted
dunes asthe IOP dunes
tropical storms as
tropical storms (i.e., the same SSHWS designation), Irma and Florence resulted
(i.e., the same SSHWS designation), Irma and Florence resulted in different geomorphic responses. in different geomorphic
responses.
This suggestsThis thatsuggests that the changes
the geomorphic geomorphic changes
resulting from resulting
Irma arefrom mostIrma are most
indicative of indicative
water-based of
water-based
processes processes and
and geomorphic geomorphic
changes changes
from Florence arefrom Florence
largely related are
tolargely relatedortoaeolian
wind-driven, wind-driven,
processes. or
aeolian processes. The following paragraphs justify this statement
The following paragraphs justify this statement and discuss each storm to highlight the different and discuss each storm to
highlight the different responses with an emphasis on the relationships
responses with an emphasis on the relationships between the geomorphic change and the dominant between the geomorphic
change
forcing and the dominant forcing factor(s).
factor(s).
Hurricane
Hurricane Irma Irmaimpacted
impacted IOP IOP atat approximately
approximatelyhigh hightide.
tide.A substantial
A substantial amount
amount of rain fell (184
of rain fell
mm, Table 1), which prohibited aeolian transport, despite the high
(184 mm, Table 1), which prohibited aeolian transport, despite the high wind speeds (c.f., [52]wind speeds (c.f., [52] for reviewfor
on the negative impact of moisture on aeolian transport potential).
review on the negative impact of moisture on aeolian transport potential). Both sites experienced Both sites experienced dune
erosion
dune and and
erosion volumetric
volumetric loss loss
(averaging
(averaging39%),39%),
withwith
patterns suggestive
patterns of rising
suggestive water
of rising levels
water and
levels
associated storm surge. However, the geomorphic response was different
and associated storm surge. However, the geomorphic response was different at Site A compared at Site A compared to Site
B. The scarping at Site A was likely caused by rising water levels, as evidenced by the high angled
to Site B. The scarping at Site A was likely caused by rising water levels, as evidenced by the high
slopes (Figure 5d–f). At this site, there was extensive dune scarping (up to 8.5 m); this erosion is the
angled slopes (Figure 5d–f). At this site, there was extensive dune scarping (up to 8.5 m); this erosion
main contributor to the minimum DEM value of −1.2 m and a volumetric loss of 18%. At Site B, Irma
is the main contributor to the minimum DEM value of −1.2 m and a volumetric loss of 18%. At Site B,
substantially decreased the total volume of sediment (pre–and post–storm normalized values of 1.00
Irma substantially decreased the total volume of sediment (pre–and post–storm normalized values of
and 0.41, respectively). The storm-induced erosion was concentrated on four incipient foredunes that
1.00 and 0.41, respectively). The storm-induced erosion was concentrated on four incipient foredunes
decreased in elevation by approximately 1.4 m, from what we believe was the storm surge. The dune
that decreased in elevation by approximately 1.4 m, from what we believe was the storm surge.
toe regressed by up to 20 m. The deposition on the onshore portion of the site was distributed (with
The dune toe regressed by up to 20 m. The deposition on the onshore portion of the site was distributed
a maximum of 0.40 m elevation change) and concentrated to previously low-lying areas. Based on
(with a maximum of 0.40 m elevation change) and concentrated to previously low-lying areas. Based
our observations and the associated data analyses, we surmise that during Irma, the IOP dunes were
on our observations and the associated data analyses, we surmise that during Irma, the IOP dunesJ. Mar. Sci. Eng. 2020, 8, 670 12 of 15
were most strongly influenced by storm-associated water damage, which was a combination of high
tides, storm surge, and precipitation.
When Hurricane Florence impacted IOP, the tide was low with obliquely onshore winds (SSW
dominant and gusts peaking at 23.6 m/s), and precipitation was limited to ~32 mm (Table 1).
The post-storm geomorphic response showed that the dune toe line minimally changed at both
sites. At Site A, an accumulation of dry sand was observed offshore of the post-storm dune toe
(Figure 6b (grey box)), suggesting that aeolian processes were paramount. A visible gap between the
scarp and this accumulation of sand (visible on Figure 5l) strongly suggests that the sand source was
offshore of the scarp. However, the NE side of the dune scarp (the right side of the DEM) showed
evidence of post-storm deposition, which is consistent with onshore winds. Holistic analysis of this
site reveals no net volumetric change when comparing pre- and post-storm conditions (normalized
volume change of 1.00). Hurricane Florence had minimal impact on Site B. A majority of the post-storm
deposition was observed onshore of the dune toe line (within the incipient foredunes), which suggests
aeolian transport. We therefore surmise that resulting from Florence, the IOP dunes were most strongly
influenced by aeolian transport, which also explains the minimal net geomorphic change.
The immediate morphologic response dunes of IOP, following Irma and Florence, can be compared
to other dune systems following hurricanes. At Site B (Irma) the incipient foredunes were devastated,
which is similar to the response of the incipient foredunes along the Florida coast after Ivan [26]. Similar
to Ivan, we surmise that the Irma damage is largely from water [27]. Hugo is considered the ‘benchmark’
storm of the South Carolina coast because of its devastation to IOP and the entire South Carolina
coast [28,29]. A previous study [28] reported beach-dune volumetric changes for ~250 m transects
(~10x longer than those in this study). Net erosion and accretion were found along the transects closest
to our study sites [28]. The dune volumetric loss reported here was 39% for Irma and 3% for Florence.
7. Conclusions
General assumptions are made about tropical storm intensities and the associated, potential
dune damage. For example, the United States Geologic Survey (USGS) Coastal Change Hazards
Portal [53] predicts dune damage according to SSHWS. The pre- and post-storm morphologic data
(Table 2, Figures 5–8) from two dune sites on Isle of Palms, SC related to two tropical storms (Irma
and Florence) suggest that the general assumptions are misguided because dramatically different
geomorphic responses were measured, and these were the same storm category. Our findings are
similar to previous research that concluded that stronger tropical cyclones do not equate with greater
morphologic coastal change [16].
The findings from this study reveal that the precipitation-dominant Irma (as observed on IOP),
which also had relatively high significant wave heights, and impacted the Island during high tide,
resulted in an average 39% volumetric loss of the IOP dunes. During Florence, a storm where
precipitation and the tides were low, winds were moderate, and aeolian transport geomorphically
impacted the dunes, the net volumetric change was inconsequential (average of 3% volumetric loss).
We therefore attest that not only is the magnitude of the tropical storm important, which is summarized
by SSHWS, but also the characteristics of the storm, such as wave height, storm surge, wind speed,
and precipitation. The latter are not components of SSHWS, but should be in future iterations. In the
meantime, the SSHWS should be applied with caution when predicting or characterizing morphologic
change of beach-dune systems.
This research emphasizes the importance of not overlooking site-specific geomorphic and
meteorological measurements. Florence, because of its slow-forward moving speed, resulted in
catastrophic flooding over parts of North and South Carolina (c.f., [54]). However, IOP was spared from
this devastation. Interestingly, Irma produced more precipitation on the island in comparison, affirming
the need for the site-specific meteorological measurements. We attest that site-specific measurements of
coastal topography, wind characteristics, waves, storm surge, and precipitation should be ascertained.J. Mar. Sci. Eng. 2020, 8, 670 13 of 15
The research presented herein exhibits that when investigating dune morphology immediately
prior to, and following storms, generalizations based on the application of the SSHWS classification are
over-simplified. Specifically, during Irma, the IOP dunes were most strongly influenced by high tides,
storm surge, and precipitation. During Florence, the IOP dunes were most strongly influenced by aeolian
transport, which was possible due to adequate wind speeds and minimal precipitation. This research
demonstrated that two tropical storms impacting Isle of Palms, SC resulted in systematically different
geomorphic impacts to the coastal dune system (Irma = –39%; Florence = –3%). We aspire that future
studies will reconsider the application of SSHWS and will include site-specific geomorphic and
meteorological measurements, all of which will not only benefit academic research, but also will
support and improve coastal management decisions.
Author Contributions: Conceptualization, J.T.E.; methodology, J.T.E., M.A.R.-R.; formal analysis, J.T.E., M.E.H.;
field-based data collection, J.T.E., M.A.R.-R., S.P.M., M.E.H., P.A.T., J.B.F; data curation, M.E.H., M.A.R.-R.;
writing—original draft preparation, J.T.E.; writing—review and editing, J.T.E.; M.E.H.; M.A.R.-R.; P.A.T.; J.B.F.;
S.P.M.; visualization, M.E.H.; J.T.E.; J.B.F.; supervision and project administration, J.T.E. All authors have read and
agreed to the published version of the manuscript.
Funding: This research was partially supported by the Department of Geography at the University of South
Carolina and HVRI.
Acknowledgments: J.T.E would like to thank IOP Fire Chief Ann Graham, IOP Mayor Jimmy Carroll, and Linda
Tucker for their cooperation and support of this research. The research team appreciates the many that helped us
in the field: Erika Chin, Holly Gould, April Hiscox, and Alexandria McCombs. J.T.E. and M.E.H. thank ALE and
PPC for their unconditional support during this study.
Conflicts of Interest: The authors declare no conflict of interest. The funders had no role in the design of the
study; in the collection, analyses, or interpretation of data; in the writing of the manuscript, or in the decision to
publish the results.
References
1. The Coastal Population Explosion. Available online: http://oceanservice.noaa.gov/websites/retiredsites/
natdia_pdf/3hinrichsen.pdf (accessed on 8 September 2018).
2. Nicholls, R.J. Planning for the impacts of sea level rise. Oceanography 2011, 24, 144–157. [CrossRef]
3. Harley, M.D.; Ciavola, P. Managing local coastal inundation risk using real-time forecasts and artificial dune
placements. Coast. Eng. 2013, 77, 77–90. [CrossRef]
4. Hall, M.J.; Halsey, S.D. Comparison of overwash penetration from Hurricane Hugo and pre-storm erosion
rates for Myrtle Beach and North Myrtle Beach, South Carolina, USA. J. Coast. Res. 1991, SI8, 229–235.
5. Claudino-Sales, V.; Wang, P.; Horwitz, M.H. Factors controlling the survival of coastal dunes during multiple
hurricane impacts in 2004 and 2005: Santa Rosa Barrier Island, Florida. Geomorphology 2008, 95, 295–315.
[CrossRef]
6. Plant, N.G.; Stockdon, H.F. Probabilistic prediction of barrier-island response to hurricanes. J. Geophys. Res.
Earth Surf. 2012, 117. [CrossRef]
7. Houser, C.; Wernette, P.; Rentschlar, E.; Jones, H.; Hammond, B.; Trimble, S. Post-storm beach and dune
recovery: Implications for barrier island resilience. Geomorphology 2015, 234, 54–63. [CrossRef]
8. Coco, G.; Senechal, N.; Rejas, A.; Bryan, K.R.; Capo, S.; Parisot, J.P.; Brown, J.A.; MacMahan, J.H.M. Beach
response to a sequence of extreme storms. Geomorphology 2014, 204, 493–501. [CrossRef]
9. Karunarathna, H.; Pender, D.; Ranasinghe, R.; Short, A.D.; Reeve, D.E. The effects of storm clustering on
beach profile variability. Mar. Geol. 2014, 348, 103–112. [CrossRef]
10. Dissanayake, P.; Brown, J.; Wisse, P.; Karunarathna, H. Effect of storm clustering on beach / dune erosion.
J. Geol. 2015, 370, 63–75.
11. Angnuureng, D.B.; Almar, R.; Senechal, N.; Castelle, B.; Addo, K.A.; Marieu, V.; Ranasinghe, R. Shoreline
resilience to individual storms and storm clusters on a meso-macrotidal barred beach. Geomorphology 2017,
290, 265–276. [CrossRef]
12. Everard, M.; Jones, J.; Watts, B. Have we neglected the societal importance of sand dunes? An ecosystem
services perspective. Aquat. Conserv. 2010, 20, 476–487. [CrossRef]J. Mar. Sci. Eng. 2020, 8, 670 14 of 15
13. Webster, P.J.; Holland, G.J.; Curry, J.A.; Chang, H.R. Changes in tropical cyclone number, duration,
and intensity in a warming environment. Science 2005, 5742, 1844–1846. [CrossRef]
14. Houser, C.; Ellis, J. Morphodynamic systems: Beach and dune interaction. In Treatise on Geomorphology;
Schroder, J., Sherman, D.J., Eds.; Academic Press: San Diego, CA, USA, 2013; pp. 267–288.
15. Román-Rivera, M.A. Innovative Approaches Using Multispectral Imagery to Detect Nearshore Bars and
Elucidate Beach System Dynamics. Ph.D. Thesis, University of South Carolina, Columbia, SC, USA, 2019.
16. Sallenger, A.H. Storm impact scale for barrier islands. J. Coast. Res. 2000, 16, 890–895. [CrossRef]
17. Hesp, P. Foredunes and blowouts: Initiation, geomorphology and dynamics. Geomorphology 2002, 48, 245–268.
[CrossRef]
18. Thieler, E.R.; Young, R.S. Quantitative evaluation of coastal geomorphological changes in South Carolina
after Hurricane Hugo. J. Coast. Res. Spec. Issue 1991, 8, 187–200. [CrossRef]
19. Houser, C.; Hapke, C.; Hamilton, S. Controls on coastal dune morphology, shoreline erosion and barrier
island response to extreme storms. Geomorphology 2008, 100, 223–240. [CrossRef]
20. Leatherman, S.P. Barrier island dynamics: Overwash processes and eolian transport. In Coastal Engineering
1976, Proceedings of the 15th International Conference; American Society of Civil Engineers: Reston, VA, USA,
1976; pp. 1958–1974.
21. Leatherman, S.P. Barrier dune systems: A reassessment. Sediment. Geol. 1979, 24, 1–16. [CrossRef]
22. Armon, J.W. Dune erosion and recovery on a northern barrier. In Coastal Zone ’80, Proceedings of the 2nd
Symposium on Coastal and Ocean Management; American Society of Civil Engineers: Reston, VA, USA, 1980;
pp. 1233–1250.
23. Psuty, N.P. Spatial variation in coastal foredune development. In Coastal Dunes: Geomorphology, Ecology
and Management for Conservation; Carter, R.W.G., Curtis, T.G.F., Sheehy-Skeffington, M.J., Eds.; Balkema:
Rotterdam, The Netherlands, 1992; pp. 3–13.
24. Morton, R.A. Factors controlling storm impacts on coastal barriers and beaches—A preliminary basis for
near real-time forecasting. J. Coast. Res. 2002, 18, 486–501.
25. Priestas, A.M.; Fagherazzi, S. Morphological barrier island changes and recovery of dunes after Hurricane
Dennis, St. George Island, Florida. Geomorphology 2010, 114, 614–626. [CrossRef]
26. Claudino-Sales, V.; Wang, P.; Horwitz, M.H. Effect of Hurricane Ivan on coastal dunes of Santa Rosa Barrier
Island, Florida: Characterized on the basis of pre- and poststorm LIDAR surveys. J. Coast. Res. 2010, 26,
470–484. [CrossRef]
27. Wang, P.; Kirby, J.H.; Haber, J.D.; Horwitz, M.H.; Knorr, P.O.; Krock, J.R. Morphological and sedimentological
impacts of Hurricane Ivan and immediate poststorm beach Recovery along the Northwestern Florida
barrier-island coasts. J. Coast. Res. 2006, 226, 1382–1402. [CrossRef]
28. Katuna, M.P. The effect of Hurricane Hugo on the Isle of Palms, South Carolina: From destruction to recovery.
J. Coast. Res. Spec. Issue 1991, 8, 263–273.
29. Coch, N.K.; Wolff, M.P. Effects of Hurricane Hugo storm surge in coastal South Carolina. J. Coast. Res. 1991,
SI, 201–226.
30. Saffir, H.S. Hurricane wind and storm surge. Military Eng. 1973, 423, 4–5.
31. Simpson, R.H. The hurricane disaster-potential scale. Weatherwise 1974, 27, 169–186.
32. Kantha, L. Time to replace the Saffir-Simpson Hurricane Scale? Eos Trans. Am. Geophys. Union 2006, 87, 3–6.
[CrossRef]
33. Powell, M.D.; Reinhold, T.A. Tropical cyclone destructive potential by integrated kinetic energy. Bull. Am.
Meteorol. Soc. 2007, 88, 513–526. [CrossRef]
34. Anthony, E.J. Geomorphology storms, shoreface morphodynamics, sand supply, and the accretion and
erosion of coastal dune barriers in the southern North Sea. Geomorphology 2013, 199. [CrossRef]
35. Hayes, M.O.; Moslow, T.F.; Hubbard, D.K. Beach Erosion in South Carolina; Coastal Research Division,
Department of Geology, University of South Carolina: Colombia, SC, USA, 1978; p. 99.
36. Tides & Currents: Isle of Palms Pier, SC–Station ID 8665494. Available online: https://tidesandcurrents.noaa.
gov/stationhome.html?id=8665494 (accessed on 24 July 2020).
37. Kana, T.W. Beach erosion during minor storms. J. Waterway Port Coast. Ocean Division 1977, 103, 505–518.
38. CSC (Coastal Science & Engineering). Final Report 2018 Beach Restoration Project City of Isle of Palms; Technical
Report #CSE–2453FR; CSE: Columbia, SC, USA, 2018; p. 57.J. Mar. Sci. Eng. 2020, 8, 670 15 of 15
39. Ellis, J.T.; Román-Rivera, M.A. Assessing natural and mechanical dune performance in a post-hurricane
environment. J. Mar. Sci. Eng. 2019, 7, 126. [CrossRef]
40. Stephen, M.F.; Brown, P.J.; Fitzgerald, D.M.; Hubbard, M.K.; Hayes, M.O. Beach Erosion Inventory of Charleston
County, South Carolina: A Preliminary Report; Technical Report No. 4; S.C.; Sea Grant: Charleston, SC, USA,
1975; p. 79.
41. Fico, C. Influence of Wave Refraction on Coastal Geomorphology - Bull Island to Isle of Palms, South Carolina.
Master’s Thesis, Coastal Research Division, Department of Geology, University of South Carolina, Columbia,
SC, USA, 1978; p. 190.
42. Ellis, J.T.; Román-Rivera, M.A.; Harris, M.E.; Tereszkiewicz, P.A. Two years and two hurricanes later: Did the
dunes recover? Shore & Beach 2020. (in print).
43. South Carolina Department of Health and Environmental Control-Ocean & Coastal Management
(SCDHEC-OCRM). SC Beachfront Jurisdictional Lines. Available online: https://gis.dhec.sc.gov/shoreline/
(accessed on 5 May 2020).
44. Cangialosi, J.P.; Latto, A.S.; Berg, R. National Hurricane Center Tropical Cyclone Report: Hurricane Florence
(AL112017). National Hurricane Center. 30 June 2018. p. 111. Available online: https://www.nhc.noaa.gov/
data/tcr/AL112017_Irma.pdf (accessed on 21 December 2019).
45. Stewart, S.R.; Berg, R. National Hurricane Center Tropical Cyclone Report: Hurricane Florence (AL062018).
National Hurricane Center. 30 May 2019. 2019; p. 98. Available online: https://www.nhc.noaa.gov/data/tcr/
AL062018_Florence.pdf (accessed on 21 December 2019).
46. National Hurricane Center and Central Pacific Hurricane Venter. NHC GIS Archive – Tropical Cyclone Best
Track for AL 11207. Available online: https://www.nhc.noaa.gov/gis/archive_besttrack_results.php?id=al11&
year=2017&name=Hurricane%20IRMA (accessed on 1 July 2020).
47. National Hurricane Center and Central Pacific Hurricane Venter. NHC GIS Archive – Tropical Cyclone Best
Track for AL 062018. Available online: https://www.nhc.noaa.gov/gis/archive_besttrack_results.php?id=
al06&year=2018&name=Hurricane%20FLORENCE (accessed on 1 July 2020).
48. Harris, M.E.; Ellis, J.T.; Barrineau, C.P. Evaluating the geomorphic response from sand fences on dunes
impacted by hurricanes. Ocean Coast. Manage 2020. (in print). [CrossRef]
49. Zhang, K.; Douglas, B.; Leatherman, S.; The, S.; July, N.; Zhang, K.; Douglas, B.; Leatherman, S. Do storms
cause long-term beach erosion along the U.S. east barrier coast? J. Geol. 2002, 110, 493–502. [CrossRef]
50. National Weather Service (NWS). Tropical Storm Irma–September 10-11, 2017. Available online: https:
//www.weather.gov/chs/TropicalStormIrma-Sep2017f (accessed on 9 March 2020).
51. Masselink, G.; Hughes, M.G. Introduction to Coastal Geomorphology and Processes; Arnold: London, UK, 2003;
p. 354.
52. Ellis, J.T.; Sherman, D.J. Fundamentals of aeolian sediment transport: Wind blown sand. In Treatise on
Geomorphology; Schroder, J., Lancaster, N., Sherman, D.J., Baas, A.C.W., Eds.; Academic Press: San Diego, CA,
USA, 2013; Volume 11, pp. 85–108.
53. USGS Coastal Change Hazards. Available online: https://marine.usgs.gov/coastalchangehazardsportal/
(accessed on 9 March 2020).
54. Griffen, M.; Malsick, M.; Mizzell, H.; Moore, L. Historic rainfall and record-breaking flooding from Hurricane
Florence in the Pee Dee Watershed. J. South Carolina Water Res. 2019, 6, 28–35. [CrossRef]
© 2020 by the authors. Licensee MDPI, Basel, Switzerland. This article is an open access
article distributed under the terms and conditions of the Creative Commons Attribution
(CC BY) license (http://creativecommons.org/licenses/by/4.0/).You can also read