APPROACHES TO COMBINE TECHNOLOGIES FOR WEATHER OBSERVATION, STORAGE AND ANALYSIS APPROACHES TO COMBINE TECHNOLOGIES FOR WEATHER OBSERVATION ...
←
→
Page content transcription
If your browser does not render page correctly, please read the page content below
APPROACHES TO COMBINE TECHNOLOGIES FOR
 WEATHER OBSERVATION, STORAGE AND ANALYSIS

 APPROACHES TO COMBINE TECHNOLOGIES FOR
WEATHER OBSERVATION, STORAGE AND ANALYSIS

                September 2018
USAID Contract No: AID-OAAA-A-16-0056
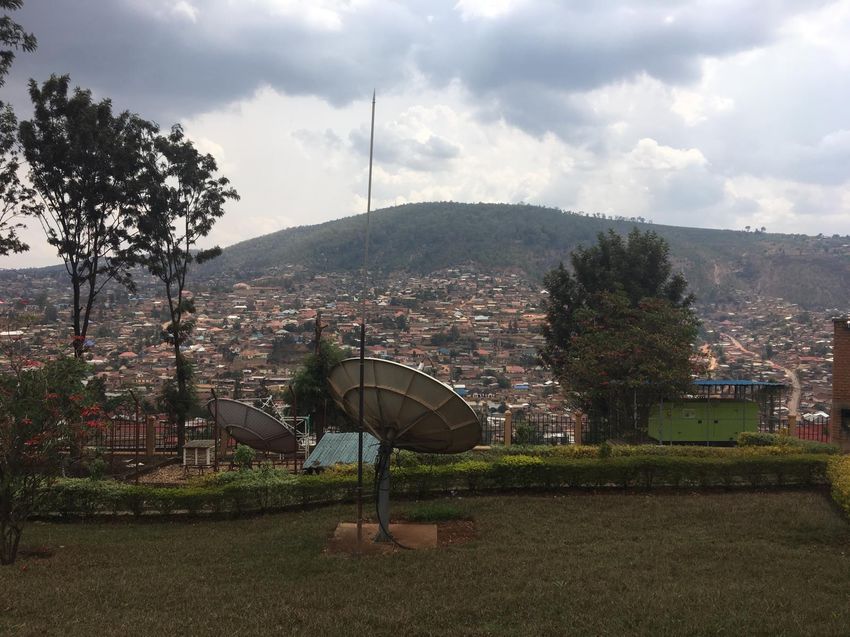
Cover Photo: Satellite dish, Meteo Rwanda Credit: Asher Siebert
Report Authors: Asher Siebert (Postdoctoral Research Scientist, IRI), Tufa Dinku
(Research Scientist, IRI), and Ashley Curtis
Suggested Citation: Siebert, A. Dinku T. and Curtis A. 2018. Approaches to Combine
Technologies for Weather Observation, Storage and Analysis.
USAID-supported Assessing Sustainability and Effectiveness of
Climate Information Services in Africa project. Washington, DC,
USA.
Prepared by: International Research Institute for Climate and Society (IRI), 61
Route 9W, Palisades, NY 10960 USA
Principal Contacts: Asher Siebert, Postdoctoral Research Scientist, IRI
asiebert@iri.columbia.edu
Tufa Dink, Research Scientist, IRI
tufa@iri.columbia.edu
DISCLAIMER
This report is made possible by the generous support of the American people through the United
States Agency for International Development (USAID). The contents of this report are the sole
responsibility of Winrock International, IRI, WMO, CSAG, and AGRHYMET and do not
necessarily reflect the views of USAID or the United States government.
ii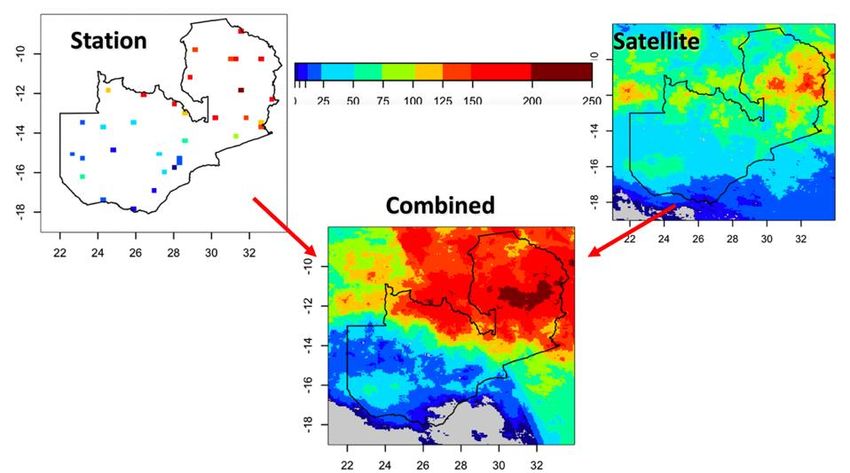
CONTENTS
ACRONYMS AND ABBREVIATIONS ........................................................................... IV

EXECUTIVE SUMMARY ............................................................................................... VI
     Key recommendations ................................................................................................................................................. vi

1.       INTRODUCTION...................................................................................................... 1
1.1.          Background ........................................................................................................................................................... 1
1.2.          Assessing Sustainability and Effectiveness of Climate Information Services in Africa Project .............. 2
1.3.          Report objectives and methodology ................................................................................................................. 2

2.       TECHNOLOGIES FOR WEATHER OBSERVATION .............................................. 3
2.1.          Introduction .......................................................................................................................................................... 3
2.2. Surface Weather Stations............................................................................................................................................ 4
     2.2.1.       Conceptual Overview ..................................................................................................................................... 5
     2.2.2.       Design challenges ............................................................................................................................................ 5
     2.2.3.       Overview of Automatic Weather Stations (AWS) ..................................................................................... 6
2.3.          Upper Air Observations ..................................................................................................................................... 8
2.4.          The Use of Remote Sensing in Observations ................................................................................................. 8
     2.4.1.       Introduction ..................................................................................................................................................... 8
     2.4.2.       Surface-based platform .................................................................................................................................. 9
     2.4.3.       Aircraft-based platforms .............................................................................................................................. 12
     2.4.4.       Space-based platforms.................................................................................................................................. 13
2.5.          Approaches to Reduce Costs ........................................................................................................................... 14
     2.5.1.       Combining Data from Different Sources ................................................................................................. 14
     2.5.2.       Public-Private Partnerships ......................................................................................................................... 16

3.       TECHNOLOGIES FOR CLIMATE DATA MANAGEMENT ................................... 17

4.       TECHNOLOGIES FOR DATA ANALYSIS ............................................................ 19
4.1.          Introduction ........................................................................................................................................................ 19
4.2.          Strengths and Weaknesses ................................................................................................................................ 21
4.3.          Summary.............................................................................................................................................................. 21

5. SUMMARY AND RECOMMENDATIONS ................................................................. 22
     Key Recommendations ............................................................................................................................................... 22

REFERENCES .............................................................................................................. 24

                                                                                                                                                                                   iii
ACRONYMS AND ABBREVIATIONS
ACLE         African Center for Lightning and Electronics
AGRHYMET     Agriculture, Hydrology and Meteorology Research Center of West Africa
             (Niamey, Niger)
AWS          Automated Weather Station
CCA          Canonical Correlation Analysis (a statistical forecasting technique)
CCAFS        Climate Change and Food Security (an initiative supported by USAID)
CDT          Climate Data Tools (an R based software for data merging and quality
             control)
CHIRPS       Climate Hazards group InfraRed Precipitation with Stations
CIRDA        Climate Information for Resilient Development in Africa
CIS          Climate Information Services
CMORPH       Climate Predictability Center Morphing Technique
CPT          Climate Predictability Tool
CRAFT        CCAFS Regional Agricultural Forecasting Toolbox
CSAG         Climate System Analysis Group (based at the University of Cape Town)
ECMWF        European Center for Medium Range Weather Forecasting
ECONET       Lesotho based telecom company
ENACTS       Enhancing National Climate Services
EUMETSAT     European Meteorological Satellite
FEWSNET      Famine Early Warning System Network
GCM          Global Climate Model
GCOSCM       Global Climate Observing System Cooperation
GEOCLIM      Geospatial Climate Analysis Tool
GEOCOF       Geospatial Climate Outlook Forecasting Tool
GEOWRSI      Geospatial Water Requirement Satisfaction Index
GFCS         Global Framework for Climate Services
GIS          Geographic Information System
GLOBE        Global Learning and Observations to Benefit the Environment (international
             science and education program)
GOS          Global Observing System
GUI          Graphical User Interface
ICPAC        IGAD Climate Prediction and Application Center
IRI          International Research Institute for Climate and Society
IRIDL        IRI Data Library
MLR          Multiple Linear Regression
LSI-LASTEM   Italian manufacturer of high quality meteorological sensors and station
             components
NMHS         National Meteorological and Hydrological Services
NOAA         National Oceanic and Atmospheric Administration (USA)
PCA          Principal Component Regression
PREPARED     Planning for Resilience in East Africa through Policy, Adaptation, Research
             and Economic Development (a USAID project)
QGIS         Quantum GIS (freeware open-source version of GIS)

                                                                                      iv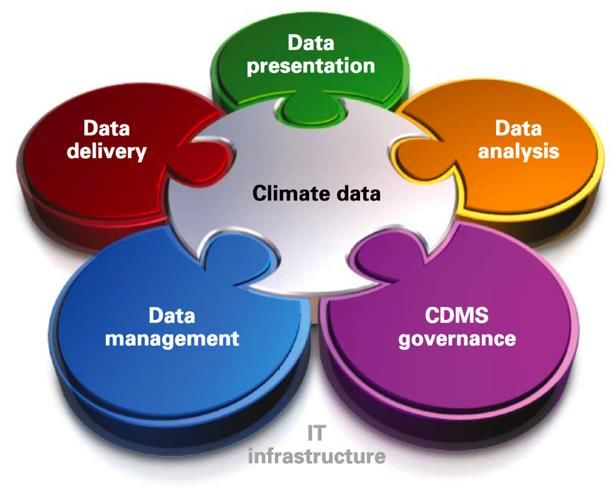
RMA        Rwanda Meteorological Agency
SAS        Statistical Analysis System (a mathematical software)
SASSCAL    Southern Africa Science Service Center for Climate Change and Adaptive
           Land Management
SPSS       Statistical Package for the Social Sciences, a statistical software
SUMO       Small, Unmanned Meteorological Observer
TAMDAR     Tropospheric Aircraft Meteorological Data Reports
UCAR       University Corporation for Atmospheric Research
UNDP GEF   United Nations Development Programme Global Environmental Facility
USAID      United States Agency for International Development
WHYCOS     World Hydrological Cycle Observing System
WICOS      WMO Integrated Climate Observing System
WMO        World Meteorological Organization

                                                                                    v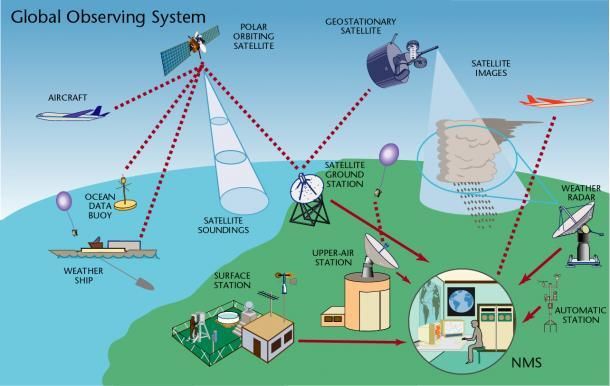
EXECUTIVE SUMMARY

The Global Framework for Climate Services lists meteorological observation as a key pillar in the
overall framework, citing observation, data storage and data analysis as integral for serving public
needs. In Africa, countries are exposed to a range of significant climate risks, including variability in
water resources, environmentally sensitive diseases and dependence on rain-fed agriculture and
therefore have a critical need for robust climate monitoring and seasonal and sub-seasonal
forecasting to help inform decision-making across multiple sectors.

Over a range of time scales, there is a need to better understand climate variability, from multi-
decadal forecasts to near-term impacts of climate change. Reliable evaluations are data intensive and
require an appropriate array of meteorological station, atmospheric profiling and satellite
observational data. Additionally, long-term planning and effective service provision by the national
meteorological and hydrological services and regional climate research centers requires well
maintained physical infrastructure, electronic databases, and capacity for sophisticated and
appropriately tailored data analyses. Thus, building and maintaining appropriate observational
networks for weather and climate observation is of critical importance.

Yet many African countries struggle to meet these needs due to financial constraints, logistical
challenges, conflicts, and host of other challenges. This has resulted in decline observation network
across Africa. To meet the challenges of a changing climate and growing population highly
vulnerable to climate risks, it is imperative that investment in hydrometeorological observations and
Climate Information Services (CIS) in Africa. Given the financial constraints, these investments
need to reduce costs as much as possible.

This report explores the optimum use of different technologies and associated issues pertaining to
meteorological observation, data management, and data analyses for CIS in sub-Saharan Africa. Key
types of meteorological observation, including ground weather stations, atmospheric profilers,
lightning detectors, weather radar, and satellite observations are reviewed and case studies are
presented that showcase initiatives and innovative technologies. Tools and approaches to data
management and data analysis are also discussed. Though a detailed analysis of the cost-effectiveness
of different technologies is not offered due to insufficient data, the report offers low-cost
approaches to address the challenge of sparse station networks and climate data scarcity.

Key recommendations

    •   When purchasing meteorological instruments, NMHS and donors should consider both the
        cost of the unit and installation as well as maintenance costs. For instance, the use of
        automatic weather stations has been rising steadily over many parts of Africa yet the cost of
        maintenance and spare parts (which have to be imported) have introduced considerable
        logistical and financial challenges.
    •   Projects purchasing observing equipment shall seek to ensure that observational data
        generated by such equipment be made available for international exchange in accordance
        with applicable WMO Congress Resolutions (Res. 40, 25 and 60) and WMO Regulatory
        Material, in particular WMO Publication 1160 (Manual on the WMO Integrated Global
        Observing System). Donors may consider technologies such as 3-D printing of automatic

                                                                                                        vi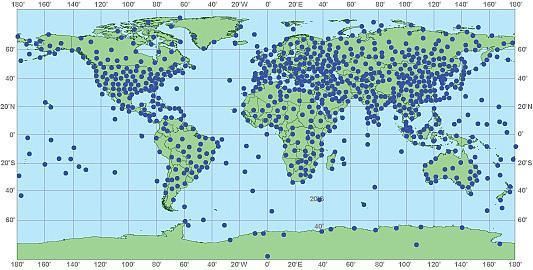
weather stations and recoverable rawinsonde technologies to expand observational networks
    at lower costs, however, it is critical that the installation of these systems involve the local
    NMHS and provide a balanced investment of the real cost of operating and maintaining the
    system (human resources and capacity).
•   Relatively poor status of Climate Data Management Systems (CDMS), particularly in Africa,
    prevents many NMHSs from efficiently (1) integrating AWS data and rescued data as well as
    (2) exchanging data, which also heavily impacted by restrictive national data policies.
    Investing in powerful CDMSs managed by highly-skilled personnel is of utmost importance
    as it will support efficient weather and climate services delivery. It is recommended that
    donors fund open source CDMS and ensure continuation of existing functional CDMS and
    not proposing new systems.
•   When evaluating options for filling data gaps or lowering costs, NMHS should consider
    combining observations from different sources. For instance, optimal combinations of
    station rainfall measurements with satellite rainfall estimates can reduce the number rain
    gauges needed. Furthermore, leveraging satellite data may be particularly useful where there
    are gaps in historical data.
•   Governments should consider public-private partnerships and multilateral donor-supported
    arrangements to enhance and support the capacity and sustainability of individual NMHS.
•   NMHS may need to review data sharing policies in the context of a broader discussion on
    the benefits of climate services for national development. NMHS may contribute more to
    the national economy if climate data serve the public good rather than seeking to sell basic
    climate and weather data. Accordingly, governments need to support their NMHS to reduce
    their dependence on revenue from selling data. Revenue should only be derived from
    providing specialized data analysis and services.
•   As this research shows, there are number of tools and technologies that could be useful to
    bridge gaps in data collection, analysis’s, storage, and dissemination. Emphasis should be
    placed on vetting these, recommending those that meet to WMO requirements and
    guidelines. As the next step, the approved tools and methodologies can be brought under a
    centralized hub, such as WMO Climate Services Toolkit (CST) that facilitates access to
    guidance, data, software tools, and training. Subsequently, attention will also need to be
    focused on developing relevant user capacities as procedural and human resources-related
    gaps on the user end constitute the biggest stumbling block in efficient use of tools and
    technologies.

                                                                                                 vii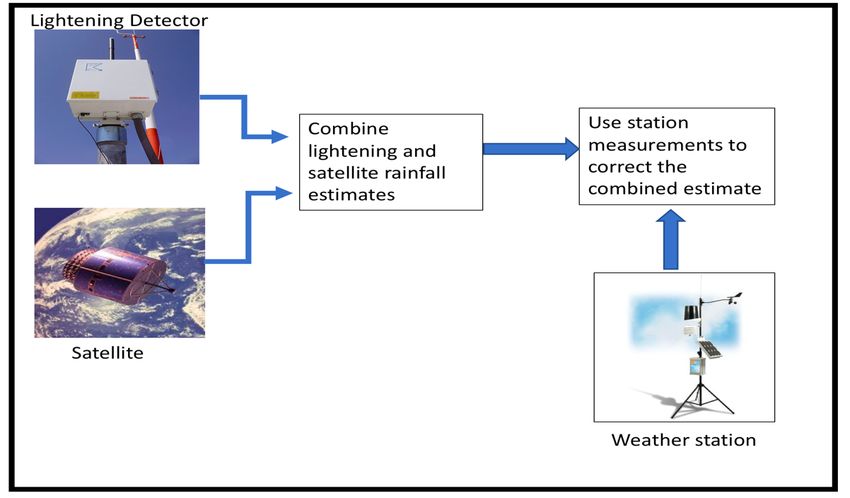
1.     INTRODUCTION

1.1. Background
The Intergovernmental Panel on Climate Change (IPCC, 2014) has identified Africa as one of the
most vulnerable continents to climate change due to its high exposure to climate stress and low
adaptive capacity (i.e., poor infrastructure, limited access to markets, high illiteracy and poverty
rates). The impacts from a changing climate are projected to be both far-reaching and spatially
variable in Sub-Saharan Africa (SSA). During the last half of the 20th century, most of southern
Africa has experienced upward trends in annual mean, maximum, and minimum temperature, with
the most significant warming occurring during the last two decades (Cervigni et al., 2015). This
changing weather patterns pose a particularly critical threat to African populations given that rain-
fed agriculture contributes a significant portion of the national GDP of most countries in the region
and provides livelihoods for a large percentage of rural populations -- up to 95 percent in some areas
of SSA (Alexandratos and Bruinsma, 2012). . Further, rainfed agriculture tends to be especially
important to the extreme poor – who are disproportionally women - and for whom even small
changes in inter- or intra-annual rainfall distribution can have devastating impacts. Over the coming
decades the situation is likely to be further exacerbated by continuing rapid population growth
(United Nations, 2017) and climate change, increasing the need for significant investment in CIS
data and services. Failure to adequately address the impacts (and causes of) climate change, especially
changes in rainfall patterns, could jeopardize decades of development investments and
improvements in livelihood conditions. There is a growing interest in using CIS to strengthen the
adaptive capacity of rural communities to reduce their vulnerability to climate change and variability.

CIS encapsulates both the provision of climate and weather information and related advisory
services at temporal and spatial scales relevant to a range of stakeholders, including decision-makers
at a national (even regional) level and down to smallholder farmers. Successful CIS provide accurate,
spatially resolved, daily, ten-day, monthly, and seasonal forecasts and advisories in a timely and
accessible manner, as well as historical trends and monitoring products. CIS are important because
they address the immediate needs of agricultural communities (e.g., what will happen tomorrow and
what will this rainy season be like), while also building the foundation of national and regional
information systems to support adaptation to longer-term and larger-magnitude climate shifts. CIS is
also essential for insurance products tailored to the needs of small farmers which pay based on
defined weather events (e.g., lack of rainfall). Insurance can facilitate access to credit allowing
farmers to invest in measures that may improve productivity.

The development of effective CIS requires access to reliable climate and weather information, in
most cases involving National Meteorological and Hydrological Services (NMHS) as key
stakeholders. NMHS commonly serve a national mandate to observe, forecast, and issue warnings
for pending weather, climate and water threats. Accurate forecasting depends on a network of
global, regional, and national remote and in situ observations of the atmosphere, oceans, and land
that are conducted by NMHS with multiple partners. Climate and weather observations are also
often made by other agencies (e.g., agriculture, aviation, water, and energy power) and increasingly
the private sector, but and these efforts are not often effectively coordinated. In many African

countries, this results in an absence of timely and reliable local weather forecasts. Yet there has been
limited research evaluating and synthesizing knowledge that can lead to sustainable CIS models and
systems.

1.2. Assessing Sustainability and Effectiveness of Climate
     Information Services in Africa Project
In light of the needs for reliable, timely, and accurate CIS in Africa, the USAID-funded “Assessing
Sustainability and Effectiveness of Climate Information Services (CIS) in Africa” (Sustainable CIS
project) program has been designed to conduct research to better understand how to design and
implement sustainable CIS models within and alongside NMHS. The project is being implemented
by a consortium led by Winrock International,with the International Research Institute for Climate
and Society (IRI), the Climate System Analysis Group (CSAG), the AGRHYMET Regional Center,
and the Global Framework for Climate Services (GFCS)1 as partners. The project objective is to
develop models and options for the sustainable delivery of CIS in SSA, and to consolidate and
extend knowledge on existing CIS in SSA. These project outputs are geared toward identifying and
improving existing CIS programs provided by the public and private sectors, as well as to design and
assess potential new CIS not yet implemented, but are promising options relevant to local contexts.

The project has three work streams:
   1.) Sustainability assessment. This includes the development of metrics to assess effectiveness
       and sustainability of NMHS to deliver CIS, with a baseline assessment of select NMHS, and
       advice on how to bridge existing gaps.
   2.) Identification of options to improve the sustainability of CIS. This includes an assessment of
       the market for CIS in SSA, private sector models that participate in CIS, and development of
       sustainable financial models for CIS delivery in SSA.
   3.) Partnership building, synthesis, sharing and uptake of knowledge and lessons learned.

This report is part of the second work stream to identify options to improve sustainability of CIS. It
includes some global data and examples but focuses primarily on SSA.

1.3. Report objectives and methodology
This report explores different technologies (or combinations of technologies) for weather
observation, climate database management, and climate data analyses. The main objective is to
identify combinations of technologies and tools that can help reduce costs for NMHS, presenting
the strengths and weakness of the different technologies. This report was produced through a desk
study of peer reviewed and grey literature, as well as interviews and solicitation of expert opinions
from project staff who offer many years of combined experience in these topic areas.

1 GFCS is a global partnership of the World Meteorological Organization (WMO) with the UN International Strategy
for Disaster Reduction, the World Health Organization, the World Food Programme, the Food and Agriculture
Organization of the UN, and others.

                                                                                                                   2
2. TECHNOLOGIES FOR WEATHER OBSERVATION
2.1. Introduction
Building and maintaining appropriate observational networks for weather and climate observation is
of critical importance for seasonal forecasting as well as a host of weather-dependent sectoral
applications. Budgetary constraints, logistical challenges and historical and current realities must be
carefully considered, and where possible, observational networks should strive to be compliant with
the guidelines established by the World Meteorological Organization (WMO Instrument Guide,
2014).
From the perspective of weather observation, the ideal set-up is a network of spatially dense ground-
based weather stations equipped with multiple sensors to monitor different meteorological fields,
with stations staffed by well-trained technicians capable of regular maintenance and timely repair as
needed. Additionally, this system should be complemented by a series of surface-, air-, and spaced-
based observation platforms.
Such a system exists at the global level, and is called the “Global Observation System” (GOS),
which monitors the state of the Earth’s atmosphere from the surface of the earth, upper air, and
outer space(Figure 1). It is operated by multiple agencies including national or international satellite
agencies across the globe. The GOS focuses on cost-effectiveness, long-term sustainability, and new
collaborative arrangements among WMO members. This system, considered to be WMO’s most
important program for observing, recording and reporting on the weather, climate and the related
natural environment, has two main objectives:
1.) To improve and optimize global systems for observing the state of the atmosphere and the
ocean surface to meet the requirements, in the most effective and efficient manner, for the
preparation of increasingly accurate weather analyses, forecasts and warnings, and for climate
and environmental monitoring activities carried out under programs of WMO and other
relevant international organizations;
2.) To provide the necessary standardization of observing techniques and practices, including
the planning of networks on a regional basis to meet the requirements of the users with
respect to quality, spatial and temporal resolution and long-term stability.
Although the space-based component of GOS is run by NMHS and other actors in the developed
world, most of the data could be accessed and fused by NMHS in Africa.
3Figure 1: WMO’s Global Observing System 2(Global Observing System, 2016)
Different components of the GOS have specific strengths and weakness and serve various purposes.
The optimal use of such a system requires complementing the weakness of one component with the
strength of the other. For instance, tradeoffs must be made between station density and/or location,
sophistication, number of sensors offered by ground instrumentation, and observations from space-
based platforms. Factors such as quality, spatial and temporal resolution, as well as accessibility to
products from the spaced-based systems all must be weighed. Furthermore, factors such as the cost
and frequency of maintenance operation, as well as the spatial coherence of the climate itself, should
be part of the decision-making framework to formulate national meteorological and hydrologic
services.
To this end, this report will explore various types of station-based, upper air and space-based
weather observations and will present important concepts, considerations and tradeoffs to support
NMHS in Africa to overcome observation challenges cost-effectively.
2.2. Surface Weather Stations
Measurements collected by weather stations around the world serve as the primary source of
climate. The main strength of station observations is that they represent the “true” measurements of
the climate variable of interest. However, in many parts of the world data scarcity persists and
coverage is thin and/or declining (i.e. oceans, remote regions, and economically poorer regions). In
addition, station measurements represent mainly the weather conditions close to the stations (as
opposed to a wider area), and because they are often reliant on human observers, are prone to
human and other measurement errors.
42.2.1. Conceptual Overview
Broadly speaking, “complete” weather stations that constantly monitor and report a large suite of
measurements may be “agricultural” or “synoptic”. Agricultural weather stations generally have
sensors for wind speed/direction (anemometer), air pressure (barometer), temperature
(thermometer), relative humidity (hygrometer and/or psychrometer), precipitation (rain gauge), solar
radiation (actinometer), soil moisture (soil moisture sensor), soil temperature, and evaporation
(either pan evaporation or by lysimeter).
Synoptic weather stations typically have more sensors, and in addition to most of the sensors
included in agricultural stations, they monitor atmospheric visibility and sometimes cloud ceiling
(which are critical metrics for aviation applications). Consequently, many airports have synoptic
weather stations situated onsite.
Additionally, “climatological stations” may be used to complement stations with a more active
recording mandate. Informing a region’s climatology may require a smaller suite of observations or a
less frequent interval of recording than “operational” meteorological stations. Typically,
climatological stations include measurements of temperature, wind, relative humidity, lightning and
rainfall. Furthermore, in many contexts in Africa, rainfall is considered the most important climatic
variable and there are many rain gauges that are not accompanied by sensors for the other
atmospheric variables.
Generally, the higher the spatial density of observation stations and the higher the temporal
frequency of observations, the more complete the picture of a nation’s or region’s climate can be.
However, tradeoffs between station density, purchase and installation costs and maintenance, and
data processing costs need to be properly managed. Furthermore, in nations with complex
topography and different climatological/ecological zones in close spatial proximity, there is greater
need for a high density of spatial observation. In regions with less dramatic spatial climatic contrasts,
the need for station density may be less.
Further, to enhance cost effectiveness, station density should be focused more on building weather
observation capacity and accuracy near population centers and across distinct climate regions more
than installing observation stations according to a regular grid. For example, much of Algeria south
of the Atlas Mountains is uninhabited desert, so while a few stations in the desert are necessary,
building a dense array of ground observations in this part of the country would likely be infeasible,
prohibitively expensive, and perhaps unnecessary. By contrast, maintaining a dense array of ground
observations in the northern part of the country where the majority of the population lives and there
is a sharper gradient of topography and climatic type is of critical importance.
2.2.2. Design challenges
There are several weather station design challenges that are differentiated between tropical
developing world contexts and mid-latitude developed world contexts. In tropical humid
environments, humidity-induced mold can undermine electronics, while in tropical arid locations
dust and sand can cause mechanical corrosion to components. Further, sealed electronics enclosures
can reach very high temperatures when faced with intense sunshine of the tropics. In addition,
occasionally insects and/or other small animals can gain access to station equipment and
compromise function. As such, there is a need for more durable design for AWS in the tropics that
require minimal maintenance yet WMO guidelines generally tend to reflect a mid-latitude bias (Snow
2013, Snow et al. 2016).
52.2.3. Overview of Automatic Weather Stations (AWS)
Costs associated with purchase, installation, and maintenance are typically lower for manual
instrumentation than Automatic Weather Stations (AWS). As such, manual stations are the most
widely used for weather observations over Africa. However, there are additional costs and
complications associated with training observing staff and ensuring continuity of observational
protocols so many NMHS in Africa are deploying AWS.
Potential vendors who have operated around the world, including in East Africa, include (but are
not limited to) Technosky, Vaisala, Lambrecht and Microsure. While personalized multi-sensor
weather stations can often sell for under $1,000, most quality, WMO-compliant weather stations for
procurement by NMHS can cost in excess of $25,000, but not all need to be as expensive as those
listed in the Case Study presented below for Rwanda. Vaisala provides several WMO-compliant
automatic weather observing systems and the French company Cimel advertises the durability of
their products in harsh weather conditions. Clearly, procurement costs must also be weighed against
maintenance and integration costs.
Case study of current practices (Rwanda)
Rwanda is one of the geographically smaller nations on the African continent at 26,000 sq
km, and has 36 agricultural stations and 5 synoptic stations (one each at each of the
nation’s five airports). Additionally, there are many climatological stations and automated
rain gauges. The Rwanda Meteorological Agency (RMA) manages Rwanda’s stations and
the AWS were manufactured by the Italian manufacturing company LSI-LASTEM.
The total purchase cost outlay to RMA for the agricultural and synoptic stations is on the
order of $750,000, with costs breaking down to approximately 22,000 Euro ($24,500) for
each synoptic station, 15,000 Euro ($16,700) for each agricultural station, 3,750 Euro
($4000) for each climatological station, and $1,800 for each automatic rain gauge. Note
that these costs do not include costs associated with installation, maintenance, or staffing
(personal discussions with RMA staff member Francois Habineza and LSI representative
Jean Francois Gakwaya).
6Case study of technological innovation: 3-D printed weather stations
Scientists at University Corporation for Atmospheric Research (UCAR) in the United
States have developed an innovative and potentially considerably lower cost approach to
ground-based weather observation. Using 3D printing to manufacture automatic weather
stations, the estimated cost for the parts and materials for one of these stations can be as
low as $300 (for a “complete” multi-sensor AWS). Labor costs associated with
manufacture, costs of using the 3D printer, maintenance, and installation are additional to
this figure, but it is nevertheless an approach that has the potential to significantly reduce
costs in the resource-constrained environment in which many African meteorological
services operate (Kucera and Steinson, 2016).
Two initial pilot projects using this approach are now underway in Zambia and Kenya. The
project in Kenya has been implemented in collaboration with the GLOBE program and has
installed weather stations at various schools throughout the country. After training,
partners have built five weather stations using 3D printing, with more expected. In Zambia,
there have been challenges associated with resources, such as maintaining air time on
SIM cards to enable data transmission. Nevertheless, the two lead scientists for this
initiative, Paul Kucera and Martin Steinson, will be launching a broader Southern Africa
regional initiative soon (Martin Steinson, personal communication).
While fairly new and perhaps not fully vetted or tested, this cutting-edge technological
approach offers the potential to dramatically reduce costs for surface atmospheric
observation, which will be a significant benefit to many NMHS in Africa. More complete
exploration and vetting of this technology and other available technologies and methods mentioned
in this report, such as CHIRPS, ARC, RFE, is encouraged.
Figure 2. Photo of 3D-PAWS location at the Bio-Med College at the Salvation Army Mission,
Zambia https://www.iepas.ucar.edu/core-programs/3dpaws/
72.3. Upper Air Observations
A key component of atmospheric observation is the study of variables at different levels of the
atmosphere. Thus, upper-air observations are an integral component of the Global Observing
System. Historically, this has most often been accomplished by use of sensors mounted in
radiosondes or rawinsondes on weather balloons. Radiosonde/rawinsonde observations typically
provide measurements of altitude, pressure, temperature, relative humidity, wind speed, and
direction during the course of the weather balloon’s flight, and may also measure some components
of atmospheric chemistry. Currently there are around 1300 radiosonde launch sites globally
connected to the World Meteorological Organization’s coordinated efforts. The map of the global
distribution is shown below (Figure 3). While many African nations have at least one radiosonde
launch site, the spatial density of radiosonde launch sites over Africa is very sparse. Further, many of
the available sites are not fully operational.
Figure 3. map of the global distribution of radiosonde launch sites (“Radiosondes” National
Weather Service, National Oceanic and Atmospheric Administration)
2.4. The Use of Remote Sensing in Observations
2.4.1. Introduction
As described above, conventional surface and upper air stations collect observations of
meteorological variables every day at thousands of meteorological stations around the world.
However, there are many parts of the world that conventional stations do not cover, such as remote
areas like deserts, mountainous regions, and oceans. Further, even areas that are not considered
remote have sparse coverage in parts of Africa.
Remote sensing, which is the process of acquiring information about the Earth’s surface, subsurface
and atmosphere remotely from sensors, has been used to supplement conventions observations.
Different sensors, such optical, infrared, radio- and microwave, have revolutionized climate
observations by providing better spatial and temporal coverage. Different climate variables such as
precipitation; cloud amount; radiation fluxes; radiation budget; sea surface temperature; wind vectors
8and speed; atmospheric temperature; and humidity and wind profiles can now be measured or
estimated using remotely sensing. This has significantly improved access to climate data over areas
with limited number of meteorological stations or areas not covered by conventional stations.
While remotely sensed weather data are of particular importance to Africa given the sparse
conventional station network over the continent, they may fall short of the required accuracy and
homogeneity measurements offered by data collected from conventional stations. Thus, remote
sensing observations can be used to complement conventional observations, but not as a substitute.
There are three main categories of remote sensing platforms: i. Surface-based platforms such
weather radars; ii. Aircraft-based based platforms such as aircrafts with automatic recording systems,
and iii. Space-based platforms such satellite sensors. The next section will further discuss these and
provide examples.
2.4.2. Surface-based platform
There are different surface-based remote techniques, the most common being weather radar.
Others include lightening-detecting networks as well as the use of mobile phone towers. These three
different techniques are presented below.
Weather Radars
Weather radar detects precipitation and other atmospheric features (such as clouds) and are typically
situated on the ground, though there are also lasso space-based weather radars on satellites. This
discussion focuses on ground-based radars. The radar technique works by sending short pulses of
high-power microwave energy to a target and then measuring energy scattered back by the target
precipitation. The location of the precipitation can be determined from the azimuth and elevation of
the antenna and the time between transmitting and receiving the reflected energy. The amount of
the received energy provides information about the nature of the precipitation.
There are different types of radars and the primary technical distinction is the wavelength range or
specifications of the emitted pulse. In general, longer wavelength radar pulses are better at picking
out larger features (hail, large raindrops) and can generally penetrate longer distances. Shorter
wavelength radar pulses are more adept at detecting smaller features (the small droplets in fog), but
generally experience attenuation and scattering effects at shorter distances, so cannot be used to
detect features further away. Common wavelengths in practice are the S band (10cm) and C band (5
cm). X band (3 cm) radars are generally used just for shorter ranges and Ka band (1 cm) radars are
generally just used to study small droplet phenomenon like drizzle and fog. Most modern weather
radars in practice are Doppler radars, meaning that they operate on the principle of emitting pulses
of microwave energy at specific wavelengths at specific time intervals and interpret the amount of
energy as well as the shifts in in frequency (Doppler shift). The Doppler shift is a phenomenon by
which a frequency (or wavelength) of a reflected wave is modulated by the velocity of the reflecting
object with respect to the receiving object. This information is used to estimate speed of the target
(e.g., a cloud formation) and its direction of motion.
Weather radar data are used widely for weather monitoring, aviation, research, in television weather
forecasts and by national weather services across the world. Radar data can also be incorporated into
numerical weather prediction models to improve forecasts.
9Strengths
Radars can cover a relatively large area (up to 300km radius) and can provide information every
minute. This makes them ideal for monitoring fast moving rainfall system over a wide area. As a
result, weather radar technology has been extremely valuable to national and local weather services
around the world for critical operational near-term weather forecasting activities. Without reliable
networks of weather radar data and imagery, accurately forecasting evolving storms would be
exceptionally challenging. In addition to giving indications of the intensity, location, and movement
of storms, modern weather radars may also be able to pick out certain dynamic features of the most
dangerous types of storms, such as the “hook echo” of tornados where the intensity of microbursts
and derechos and the timing of the arrival of rain bands or an eyewall associated with a tropical
cyclone. As a result, radars are indispensable for applications such as aviation safety.
Weaknesses
There are different technical challenges with of weather radars. However, the main concerns are
their operational weakness, including the following:
● Radars do not measure rainfall. Rather, it is estimated from the measured energy and therefore
there may be errors associated with radar data or the estimate derived from it;
● Depending on the size of the country, several radars may be needed to cover the whole country;
● Physical barriers such as mountains can block radars signals, making its use over mountainous
regions a challenge;
● In the context of SSA, radars are prohibitively expensive to purchase, install, and maintain
(millions of U.S. dollars) and maintenance costs are often overlooked, leading to operational
challenges;
● Requires specific expertise to maintain and use, which may not be available in many NMHS in
SSA
Summary
Weather radar is a critically important technology for real-time weather monitoring and forecasting.
They can provide information over relatively large area at short time intervals. On the other hand,
the costs associated with obtaining, running, and maintaining weather radars has to be realistically
considered, particularly in the context of SSA.
Lightning Detectors
Lightning sensors scan a range of electromagnetic frequencies to detect electrical discharges inside
clouds, between clouds, or between clouds and the ground. There are three basic types of lightning
detectors: ground-based systems, mobile systems and space-based systems. Ground-based and
mobile systems use radio direction finding techniques to calculate the proximity and severity of
lightning activity. Accurate detection of the location of lightning events requires more than one
lighting sensor as these ground-based systems use triangulation from multiple sensors to identify the
location of a lightning strike. The accuracy and efficiency of a lightning-detector network drops
progressively toward its outer boundaries.
Strengths
A network of lightning detectors can be used to obtain data over a large area and it is possible to use
data from outside one’s country, enabling wider area coverage and accuracy. Data from ground-
10based lightning detectors and mobile systems can generally be quickly integrated into operational
response and forecast operations and are generally cheaper than using radars to cover the same area.
Weaknesses
There are many technical and operational challenges associated with using lightning detectors,
including the following:
● Though cheaper than radars, the installation, maintenance and use of lightening sensors can be
considerable (the cost one sensor is up to hundreds to thousands of USD);
● Ground-based lightning detectors can only properly locate a lightning event if at least three
detectors to triangulate the signals, increasing costs of installation, maintenance and use;
● Lightning sensors detect electrical activity in clouds, which may or may not be related to rainfall
amount;
● Lightning detectors only estimate precipitation coming from the kind of clouds that produce
lightning (convective clouds) and thus miss rainfall from other cloud types.
Integration with Weather Radar for Aviation applications
To provide the best services, lightning detection systems should be (and often are) integrated with
weather radar to offer the most complete picture of evolving intense convective systems. Many
modern aircraft use both plane-mounted radar and plane-mounted lightning detection systems to
avoid or minimize the risks of flying in strongly convective, lightning prone environments.
Case study (Uganda)
In 2013, a detailed review of Uganda’s meteorological services was carried out and recommendations
were made by the US Trade and Development Agency. The report found that the Uganda National
Meteorological Agency was underfunded, and while staff were generally trained and willing undertake
improvements, there were a number of key deficiencies. Recommendations for expanding and
improving the coverage of observations were made and acted upon (funded largely by multinational
consortia and international financial institutions) in the years following.
Thus far the estimated return on investment is between five and ten-fold (Snow et al., 2016). To
address a lack of lightning detection (not just in Uganda, but across much of the continent) a new
institution, based in Kampala, Uganda, called the African Centre for Lightning and Electromagnetics
(ACLE) was created which established networks of lightning sensors in most of the East African
member states. It is difficult to quantify the impacts in terms of lives saved or property damage
avoided to date, but this development is clearly a step in the direction of helping to offer protection
against severe weather events.
Rainfall Detection from Cellular Communication Networks
Cellular communication-based rainfall monitoring is made possible by the fact that rain droplets
absorb and scatter, or attenuate, the signal sent from one telephone tower to another. By measuring
the decrease in the signal during rainy weather and knowing the signal level during dry weather, one
can estimate the average rainfall intensity between telephone tower antennae. As there are large
number of microwave telecommunications links many SSA countries, cellular rainfall monitoring
could help supplement ground-based measurements. The data also may be obtained for free, since
cell phone companies collect the data to monitor the loss of signal strength between their cell phone
towers to assess reliability. Thus, investment in this system is limited to obtaining and analyzing
data.
11WMO explores development of new standards for estimating rainfall based on cell phone signal
attenuation: (i) standard for deriving rainfall estimate from signal attenuation information with
WMO Commission on Instruments & Methods of Observations (CIMO) and (ii) standard for
exchange of signal attenuation information between cell phone operators and national
meteorological services with International Telecommunication Union (ITU). Further steps towards
quality assessment and standardization will be presented at the WMO Commission for Instruments
and Methods of Observations (CIMO) Technical Conference in October 2018.
Strengths
In regions with sparse rainfall gauge but ample cell phone coverage, this approach offers a cost
effective and promising means to fill gaps, so long as the number, density and location of cell
phones can be accurately estimated and the attenuating effect of rainfall can be properly estimated
and calibrated.
Weaknesses
There are several potential limitations/challenges to this approach:
● Mobile phone usage and coverage varies considerably among countries so the degree of
refinement in estimating the rainfall-induced attenuation may vary;
● In regions with weak cell phone signal strength and/or limited cell phone usage, the efficacy of
this approach may be limited;
● Rain droplets of different sizes, precipitation types, and levels of intensity may have different
attenuation effects which may be difficult to differentiate, so in practice it may be challenging to
assess the details of a storm by this type of extrapolation;
● The approach relies on mobile phone companies’ cooperation and provision of data.
Summary
The development of the ability to assess extrapolated rainfall location and intensity by the
attenuation of cell phone signals is an important advancement and should be explored further in the
context of climate information services for Africa. However, there are technical and logistical
challenges that should not be overlooked and this technology should be viewed as complementary
to the need for expanding and maintaining a reliable network of weather stations.
2.4.3. Aircraft-based platforms
As the name indicates, this approach involves installing sensors onboard aircrafts. One of these
types of systems is SUMO (Small, Unmanned Meteorological Observer), where various
meteorological sensors are mounted on a lightweight remotely controllable airplane that takes
measurements of the atmospheric boundary layer up to an altitude of around 3500m (Reuder et al.,
2009). An approach related to SUMO, but with a somewhat improved range, uses “glidersondes”
where telemetry sensors and instruments are mounted on a glider that is sent up with a weather
balloon. When the balloon pops, the parachute is attached to the glider and when the glider
(mounted with sensors) reaches a specified altitude, it is “guided” back to the launch site via GPS
navigation (Lafon et al., 2014).
Another approach makes use of commercial airlines. Long-distance aircraft are fitted with automatic
recording systems that report temperature and wind, and in some cases humidity along their flight
path. The collected data are automatically fed to the aircraft communication system for transmission
12to the ground, or alternatively, a dedicated processing package can be used on the aircraft to access
raw data from the aircraft systems and derive the meteorological variables independently. The
TAMDAR (Tropospheric Aircraft Meteorological Data Reports) is one such example. This
approach is used in the United States where atmospheric sensors are placed on commercial airplanes
and record observations when the flights are below 500 hPa. This helps fill spatial gaps in regions
where radiosonde density is low at minimal additional cost and the sensors can be reused if properly
designed and maintained (Moninger et al., 2010).
Strengths
Costs associated with traditional weather balloon/radiosonde launches have historically been
presented as “non-recoverable”, in that new weather balloons with new instrumentation must be
constructed for each launch. In a budget-constrained environment, this (often multi-hundred
dollars/day) cost clearly represents a significant challenge and drain on resources. Yet many of the
aircraft-based sensors have addressed this problem. Further, installation of sensors onboard
commercial airlines is an approach to profile the atmosphere at a relatively low cost.
Weaknesses
The main weakness may include the following:
● The use specialized aircrafts would be expensive for most countries in Africa;
● As commercial aircrafts fly mostly at constant altitude, the can only take measurements of the
atmosphere along their routes (no vertical profiling);
● There are potentially a large number of error sources contributing to aircraft measurement
errors.
2.4.4. Space-based platforms
The most common spaced-based remote sensing is the use of sensors onboard satellites orbiting the
Earth. Satellites provide wide geographical coverage, especially over areas with sparse or completely
missing ground observations and satellites sensors can be used to estimate climate variables such as
rainfall, temperature, wind, cloud type and properties and atmospheric water vapor. Rainfall is the
most widely used climate variable derived from satellite measurements.
Rainfall estimates from satellite sensors go back over three decades and there are a large variety of
satellite rainfall products freely available from different centers including the Global Precipitation
Climatology Project (GPCP, Adler et al., 2003), African Rainfall Climatology version 2 (ARC2,
Novella and Thiaw, 2013), and the Tropical Applications of Meteorology using SATellite and
ground-based observations (TAMSAT) rainfall estimate (Maidment et al. 2014), the Climate Hazards
group InfraRed Precipitation with Stations(CHIRPS, Funk et al. 2015), and Climate Prediction
Center Morphing Technique( CMORPH, Joyce et al. 2004). The ARC and TAMSAT products are
available only over Africa.
13Strengths
The main strengths of satellite estimates include global coverage, improved temporal and spatial
resolution, and the fact that many satellite rainfall products are freely available from different
centers. As a result, satellite rainfall estimates are used widely by NMHS and other organization in
SSA.
Weaknesses
Satellite proxies suffer from several shortcomings including accuracy, short time series, coarse spatial
resolutions for some products and variables, temporal heterogeneity, and limited climate variables.
Summary
In addition to ground instrumentation, it is critical for African NMHS to make use of a broad suite
of satellite measurements and blended satellite-station products to complement their networks of
ground stations and atmospheric profile measurements. However, careful attention should be paid
not only to issues of spatial resolution and/or temporal resolution and completeness of data, but
also to verification and consistency of the satellite data with ground-based observations.
2.5. Approaches to Reduce Costs
2.5.1. Combining Data from Different Sources
It would be ideal to have a dense rain gauge network for monitoring rainfall over a given country.
However, this is very expensive and practically impossible where there are remote and inhabited
areas and station security issues. Installing weather radars may help to overcome these challenges,
however, radars are prohibitively expensive to install and maintain, particularly for large countries
that need many radars to achieve proper coverage. A network of lightning detectors could be used
to obtain data over a large area at a relatively cheaper cost compared to weather radars yet they only
detect specific cloud types that produce lightning, therefore potentially leaving other types of clouds
and associated rainfall undetected. Satellite rainfall estimates can cover most of the globe and are
available at no cost to the African NMHS yet suffer from estimation errors.
When balancing technology and cost options, combining data from different sources (station, radar,
satellite, etc.) may offer a way for NMHS to fill gaps cost-effectively. For instance, station
measurements form a sparse ground network could be combined with estimates from lightning
detectors and satellite rainfall estimates. As shown in Figure 4, rainfall estimates from lightning
detectors can be used to improve satellite rainfall estimates, because lightning detectors capture
convective rain reasonably well. Then, the combined product can be further improved through a
correction process using station rainfall measurements. This approach combines the strengths of
these different products and technologies and could be cheaper than installing a dense rain gauge
station network or using radar. This cost reduction comes mainly from the fact that the satellite
rainfall product can be obtained free of charge.
Satellite products may not be as good as station observations yet station measurements have limited
coverage. Thus, it would make sense to combine the spatial coverage by satellite estimates with the
accuracy of the station measurements. If used wisely, this would reduce the number of rain gauges
14needed to cover a country and hence reduce costs. This approach has also been used by researchers
to overcome data sparsity. For example, Wilby and Yu (2013) combined surface meteorological
observations, remotely sensed data, physiographic indices, and regression techniques to produce
gridded maps of annual mean precipitation and temperature for Yemen. Most global satellite rainfall
estimation methods do blend satellite rainfall data with station measurements yet many global
centers have limited access to station data from NMHS in Africa and as a result, the improvements
offered by existing blended products are limited.
Combined products may not be as accurate as station measurements but nevertheless offer
advantages. In addition to better coverage, they typically better represent rainfall over a large area, as
opposed to rain gauges which represent only the area in close vicinity of the station. Yet an
important shortcoming is that the combined satellite and ground observation data approach may not
be applied to all climate variables. For instance, there are no reliable estimates of temperature from
satellite measurements. However, climate model reanalysis model products have been used for
temperature (e.g., Dinku et al., 2017)
Figure 4: A schematic example of combining rainfall data from different sources.
Most satellite rainfall estimation methods do blend satellite rainfall data with station measurements
and these include the Climate Hazards Group Infrared Precipitation with Station (CHIRPS), the
African Rainfall Estimate (RFE), the African Rainfall Climatology (ARC), among others. However,
many global centers can only access limited number of station data from NMHS in Africa, making
these improvements in blended products more limited for the region. CHIRPS could be the
exception, in that it was able to access many more stations relative to other similar products, yet the
number of stations used in CHIRPS has been declining steadily over many parts of Africa.
The ENACTS (Enhancing National Climate Services) is a unique effort that strives to overcome
availability of climate data in Africa (Dinku et al. 2014, 2016, 2017). The main strength of ENACTS
15You can also read