Approaches to Understand Historical Changes of Mercury in Tree Rings of Japanese Cypress in Industrial Areas
←
→
Page content transcription
If your browser does not render page correctly, please read the page content below
Article
Approaches to Understand Historical Changes of
Mercury in Tree Rings of Japanese Cypress in
Industrial Areas
Young Sang Ahn 1, * , Raae Jung 1,2 and Jae-Hyun Moon 1
 1    Department of Forest Resources, Chonnam National University, Gwangju 61186, Korea;
      forest-rachel@fowi.or.kr (R.J.); mjh132577@naver.com (J.-H.M.)
 2    Department of Forest Therapy, Korea Forest Welfare Institute, National Center for Forest Activities,
      Jangseong 57202, Korea
 *    Correspondence: ysahn@jnu.ac.kr; Tel.: +82-62-530-2081

 Received: 6 July 2020; Accepted: 23 July 2020; Published: 25 July 2020

 Abstract: Historical changes of mercury (Hg) concentrations in tree rings of Japanese cypress
 (Chamaecyparis obtusa) and the role of dendrochemistry over the last 50 years in Yeosu and Gwangyang
 National Industrial Complexes of South Korea were evaluated. Mercury uptake in trees were found
 to be bidirectional and variable depending on atmospheric Hg conditions. With low atmospheric Hg
 concentrations, Hg concentrations in tree rings were significantly influenced by soil Hg concentrations
 via roots. With high atmospheric Hg concentrations, Hg concentrations in tree rings were dominated
 by atmospheric Hg uptake via foliage. Patterns of Hg concentration in sampling sites were divided
 into: (1) a linear increase in low concentration of Hg originated from soils via roots during 1967–1977
 and (2) an elevated and constant concentration with spatial variation of Hg concentration due to foliar
 uptake from atmosphere during 1978–2014. Between 1967 and 1977, when shrubs and vegetation
 senesced each year, there was an annual source of Hg in soils due to continued deposition of Hg
 to soil via litterfall and debris. Thus, Hg concentration was increased over time. During these
 periods, Hg concentrations in tree rings reflected uptakes of Hg through roots under young forest
 and low atmosphere Hg conditions. Whether tree rings can serve as reliable proxies for atmosphere
 Hg concentrations remain unclear due to Hg uptakes from soils and limits from atmosphere
 under low atmospheric Hg conditions. Intensified chemical plants and steel mills have continued
 throughout Yeosu and Gwangyang industrial areas since late 1970s, resulting in high Hg emissions.
 Hg concentrations in tree rings during 1978–2014 showed elevated and constant levels. In addition,
 tree ring Hg concentrations at study sites were increased gradually with decreasing distance from
 industrial areas, with a high concentration of 11.15 ng/g at the Yeosu site located the nearest to
 industrial areas and a low concentration of 4.34 ng/g at the Suncheon site which was the farthest away
 from industrial areas.

 Keywords: mercury; industrial activity; litterfall; dendrochemistry; tree ring; Japanese cypress

1. Introduction
     The behavior and fate of mercury (Hg) in the environment are currently receiving increasing
attention because of growing evidence that Hg is a potential threat to ecosystems and human health [1,2].
Mercury is input into the atmosphere by anthropogenic and natural processes. Natural sources of Hg
to the atmosphere include soils, water bodies, vegetation, and wildfires [3,4]. Mercury is also emitted
by anthropogenic sources including combustion of fossil fuel, petrochemical processes, fertilizer
production, iron and steel mills, waste incineration, and metal ore treatment [5–14]. In particular,
the iron and steel industry is one predominant anthropogenic sources of atmospheric Hg emissions

Forests 2020, 11, 800; doi:10.3390/f11080800                                         www.mdpi.com/journal/forests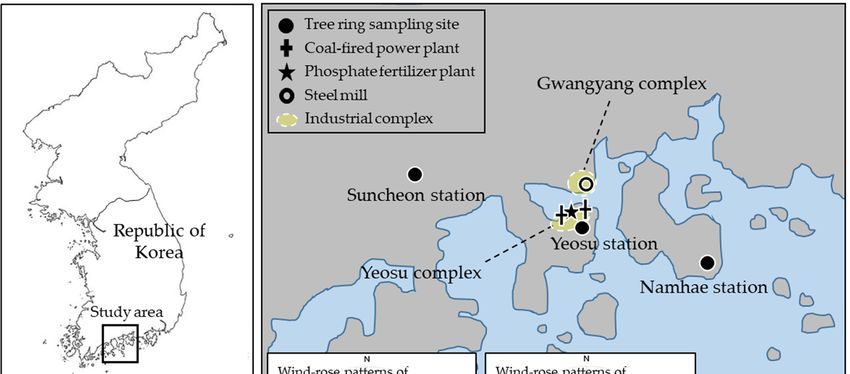
Forests 2020, 11, 800                                                                               2 of 10

worldwide [11]. In complex manufacturing processes of iron and steel, Hg is released by a variety of
raw materials at different stages. It is emitted by dozens of stacks. Mercury emissions from sintering
machines and coal gas-burning are significant [11]. Mercury is also emitted into the atmosphere from
coal combustion by thermoelectric power plants [8]. Mercury is also present in coal [6,8]. Manufacture
of phosphate fertilizers is also a source of environmental Hg contamination [5,9,12]. Mercury released
from phosphate ores is attributed to the high heating temperature.
      Abiotic and biotic passive samplers have been used to measure air concentrations of Hg and
understand its spatial and temporal trends through observations [15]. Mercury in tree rings is closely
associated with atmospheric Hg since atmospheric Hg is the predominant form of Hg absorbed by
foliage [10,12,16]. However, limited work on reliable proxies for atmospheric Hg concentrations has
been published regarding records of Hg in tree rings [17]. Plants can uptake Hg from soils via roots and
from the atmosphere via leaves [4,18–21]. With low atmospheric Hg concentrations, Hg concentrations
in tree rings are significantly influenced by soil Hg concentrations via roots. With high atmospheric
Hg concentrations, Hg concentrations in tree rings are dominated by atmospheric Hg uptake via
foliage [4,18,19]. Many studies have found that significant Hg contributions are from forest soils via
throughfall and litterfall [4,20] and plant uptakes of Hg via roots [19,21].
      Since the 1970s, the country’s leading industrial complex that consists of chemical industry,
steel mills, and thermoelectric power plants has existed primarily in the Yeosu and Gwangyang areas
located in southern Korea (Figure 1). It represents Korean industrial area [22]. In the early 1970s,
the demand for electricity began to increase to promote urban and industrial development in the
Yeosu industrial areas. Two coal-fired power plants were installed in Yeosu industrial areas during
1973–1975 [23,24]. Furthermore, a food project was promoted due to rapidly growing population
in the mid-1970s. A fertilizer plant was also installed in Yeosu industrial areas to increase rice
production [14]. This plant is the largest agricultural fertilizer plant in Korea. In addition, a steel
mill was operated in 1987 to support the development of automobile and shipbuilding industries in
Gwangyang industrial areas [25]. The mill is the largest steel mill in the world. Its average production
capacity is approximately 18 million tons per year [25]. Industrial activities in Korea occur primarily in
the Yeosu and Gwangyang areas. These areas are used as a proxy for regional production. Industrial
activities were increased steadily from the 1980s. They have since remained elevated. Industrial areas
are exposed to severe environmental contamination known to be human health hazard due to the
release of a number of air pollutants into the atmosphere caused by intense industrial activities in the
area [2,12,26,27]. To date, few studies have evaluated historical Hg exposure in these regions, despite
potentially high atmospheric deposition from coal-fired power plants, petrochemical and agricultural
plants, and a steel mill that has been active since the 1970s [12].
      Studies analyzing past Hg pollution recorded in tree rings are rare in Korea [12]. A previous
study has focused on the record of historical Hg emissions in Yeosu industrial areas of Korea, a region
known for phosphate fertilizer production since the late 1970s [12]. However, in that study by Jung and
Ahn (2017) [12], the distinction between phosphate fertilizer production and the impact of coal-fired
power plants and steel mills on Hg emissions was limited. In particular, Hg concentrations in tree
rings showed a gradually increasing patten of low Hg levels during 1960s–1970s when there was no
industrial activity. Jung and Ahn (2017) [12] did not address whether these low concentrations of
Hg in tree rings were uptakes from the soil in the 1960s–1970s. In the present study, we measured
Hg concentrations in tree rings of Japanese cypress (Chamaecyparis obtusa), and examined historical
changes of Hg concentrations in Yeosu and Gwangyang industrial areas of Korea. In addition, this
study examined changes from soil versus atmospheric uptake as the primary source of Hg in tree rings
of Japanese cypress.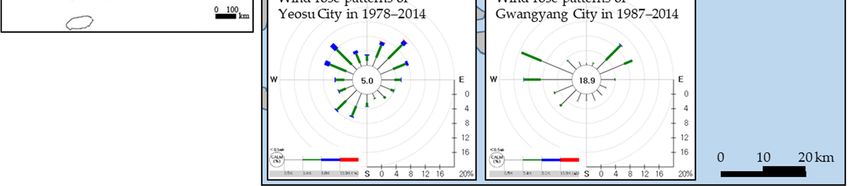
been published regarding records of Hg in tree rings [17]. Plants can uptake Hg from soils via roots
and from the atmosphere via leaves [4,18–21]. With low atmospheric Hg concentrations, Hg
concentrations in tree rings are significantly influenced by soil Hg concentrations via roots. With high
atmospheric Hg concentrations, Hg concentrations in tree rings are dominated by atmospheric Hg
uptake
Forests via11,
2020, foliage
800 [4,18,19]. Many studies have found that significant Hg contributions are from forest
3 of 10
soils via throughfall and litterfall [4,20] and plant uptakes of Hg via roots [19,21].
Figure 1.
Figure 1. Map
Map of
of tree
tree ring
ring sampling
sampling sites
sites at
at Yeosu,
Yeosu, Namhae,
Namhae, and
and Suncheon
Suncheon stations
stations and
and locations
locations of
of
main industrial
main industrial activities
activities at
at Yeosu
Yeosu and
and Gwangyang
Gwangyang National
National Industrial
Industrial Complexes
Complexes inin southern
southern Korea.
Korea.
Wind-rose patterns
Wind-rose patterns represent
represent Hg
Hg levels
levels in
in Yeosu
Yeosu City
City from
from 1978
1978 to
to 2014
2014 and
and Gwangyang
Gwangyang CityCity from
from
1987 to
1987 to 2014.
2014.
2. Materials
Since theand Methods
1970s, the country’s leading industrial complex that consists of chemical industry, steel
mills, and thermoelectric power plants has existed primarily in the Yeosu and Gwangyang areas
2.1. Study Area Description
located in southern Korea (Figure 1). It represents Korean industrial area [22]. In the early 1970s, the
demandYeosu
forand Gwangyang
electricity beganindustrial
to increaseareas are characterized
to promote urban and byindustrial
flat reliefsdevelopment
with a ridge of
inlow
the dunes
Yeosu
and reclaimed
industrial areas.lands
Two along the ocean
coal-fired power coastline
plants weresurrounded byYeosu
installed in Gwangyang, Yeosu,
industrial areas and Namhae
during 1973–
areas (Figure Furthermore,
1975 [23,24]. 1). Soils of the peninsula
a food projectarewas
composed
promotedof fine-grained
due to rapidly sand. Average
growing temperatures
population in the
in the past approximately
mid-1970s. A fertilizer plant50was
years at installed
also Yeosu, Namhae,
in Yeosu and Suncheon
industrial areasareas rice◦production
were 14.2
to increase C, 14.1 ◦ C,
and ◦
[14].12.6
This C, respectively
plant (Figureagricultural
is the largest 2a) [28]. In fertilizer
the periodplant
of 1965–2015,
in Korea.average precipitation
In addition, a steel amounts
mill was
at Yeosu, in
operated Namhae,
1987 toand Suncheon
support the areas were 1471
development of mm, 1825 mm,
automobile and and 1541 mm, industries
shipbuilding respectivelyin
(Figure 2b). Precipitation in the Namhae area was 284 mm or 354 mm higher than that in Yeosu or
Suncheon site, respectively. The wind in Yeosu City varied (Figure 1) [28]. It was predominated by
northwestern, southwestern, and northeastern directions. The wind in Gwangyang City flowed mainly
in northwestern, western, and northeastern directions.
The population in Yeosu and Gwangyang areas in 2015 was 414,974 persons, an increase of
59,363 persons compared to the 1960s (Figure 2c) [29]. On the other hand, the population in Namhae
areas has continued to decrease since the 1960s. It was 42,696 persons recently. The population in
Suncheon areas was 208,033 persons in the 1960s and 268,033 persons in 2015 [29].well as after every cutting. These disks were air-dried for 7 days and polished with progressively
finer sandpaper up to 600 grit to expose ring boundaries for identification. Each sample disk was
scanned. Growth rings were marked with a CooRecorder program (version 7.8; Cybis Elektronik &
Data AB, Saltsjobaden, SE). Individual disks were cut into 1-year segments using a stainless steel
knife and 11,
Forests 2020, air-dried.
800 These segments were shattered using an MM 400 ball-mill grinder (Retsch
4 of 10
GmbH, Haan, DE) [12].
Figure 2.
2. Historical
Historicalchanges of of
changes average temperature
average (a), (a),
temperature precipitation (b), and
precipitation (b), population (c) at study
and population (c) at
areas.
study areas.
2.2. Sampling and Sample
Table 1. Distances Preparation
from industrial areas to study sites and average Hg concentrations in tree rings at
Yeosu,
In JulyNamhae, and February
2013 and Suncheon sites
2014,between 1967 and
tree rings 2014.
were sampled at three study sites (Figure 1).
Yeosu sampling site was located near Yeosu industrial areas, approximately 12 km from
Hg Concentration (ng/g)the steel mill in
Distance from the Industry Area (km)
Gwangyang industrial areas. Namhae and Suncheon sampling sites were used as references. They were
Site 1967–1977 1978–2014
located in forests far from industrial and resident areas (Table 1). Namhae and Suncheon sites were
Yeosu Gwangyang Average ± SD (Median) Average ± SD (Median)
located approximately 26–33 km and 38–40 km from Yeosu/Gwangyang industrial area, respectively.
Yeoau 4 12 - 11.15 ± 1.21 (11.10) a
Namhae 26 from industrial areas
Table 1. Distances 33 to study sites and
2.51 ± 0.59 (2.47)
average 6.54in± tree
Hg concentrations 1.32rings
(6.57)atb
Yeosu, Namhae,
Suncheon 40and Suncheon sites 38
between 1967 and 2014.
2.15 ± 0.84 (2.27) 4.34 ± 0.66 (4.23) c
Note: Different letters indicate significant differences among three
Hgsites at p < 0.017 after
Concentration (ng/g)Bonferroni correction.
Distance from the
Site Industry Area (km) 1967–1977 1978–2014
2.3. Mercury Analysis
Yeosu Gwangyang Average ± SD (Median) Average ± SD (Median)
Tree ring Hg concentrations were determined at Korea Basic Science Institute using the Direct
Yeoau 4 12 - 11.15 ± 1.21 (11.10) a
MercuryNamhae
Analyzer (DMA)-80 26
(Milestone
33
Srl, Rome, Italy). The analyzer uses
2.51 ± 0.59 (2.47)
thermal decomposition,
6.54 ± 1.32 (6.57) b
gold amalgamation,
Suncheon and
40 atomic absorption
38 spectrometry. The
2.15 ± 0.84 (2.27) Hg detection limit(4.23)
4.34 ± 0.66 wasc 0.005 ng.
Operation conditions for the DMA-80 were based on Environmental Protection Agency Method 7473
Note: Different letters indicate significant differences among three sites at p < 0.017 after Bonferroni correction.
protocol [30]. A calibration curve was generated using a reference material obtained from the
National Research cypress
The Japanese Councilas ofaCanada
sampleInstitute for National
tree thrives in southernMeasurement
parts of Korea. Standards
Namhae MESS-3 (marine
and Suncheon
sediment,
sites were certified
afforestedvaluein the= 1960s.
90 ± 9 ng/g HgT (dry
The forest fromweight))
the Yeosuwith
siteRwas
2 > 0.999. Measurement
afforested in the 1990s.standard
Thus,
the tree age at the Yeosu site was less (24 years) than those at other sites. One disk in each sampling
site was collected from the stump at a height of 1 m. These disks were collected using a stainless steel
saw. To reduce chemical contamination of samples, latex gloves were worn at all time. The stainless
steel saw was wiped down with a new Kimwipe wetted with methanol before cutting into the tree
as well as after every cutting. These disks were air-dried for 7 days and polished with progressively
finer sandpaper up to 600 grit to expose ring boundaries for identification. Each sample disk was
scanned. Growth rings were marked with a CooRecorder program (version 7.8; Cybis Elektronik &Forests 2020, 11, 800 5 of 10
Data AB, Saltsjobaden, SE). Individual disks were cut into 1-year segments using a stainless steel knife
and air-dried. These segments were shattered using an MM 400 ball-mill grinder (Retsch GmbH, Haan,
DE) [12].
2.3. Mercury Analysis
Tree ring Hg concentrations were determined at Korea Basic Science Institute using the Direct
Mercury Analyzer (DMA)-80 (Milestone Srl, Rome, Italy). The analyzer uses thermal decomposition,
gold amalgamation, and atomic absorption spectrometry. The Hg detection limit was 0.005 ng.
Operation conditions for the DMA-80 were based on Environmental Protection Agency Method 7473
protocol [30]. A calibration curve was generated using a reference material obtained from the National
Research Council of Canada Institute for National Measurement Standards MESS-3 (marine sediment,
certified value = 90 ± 9 ng/g HgT (dry weight)) with R2 > 0.999. Measurement standard MESS-3 was
used to calculate the accuracy and precision. Recovery ranged from 97% to 102%. Machine blanks and
reference samples were included every 5–20 samples.
2.4. Statistical Analysis
The t-test was used to determine differences of Hg concentration in tree rings between Namhae and
Suncheon sites during 1967–1977 (Table 1). Samples at the Yeosu site before 1991 did not exist because
trees were younger than established industrial factories. Differences in tree ring Hg concentration
at sampling sites during 1978–2014 were determined using the Kruskal–Wallis test followed by the
Mann–Whitney U-test for pairwise comparisons with p adjusted < 0.017 after Bonferroni correction.
All statistical tests were performed using SPSS statistics program (version 21; IBM SPSS Statistics,
Chicago, IL, USA) at a significance level of p < 0.05.
3. Results
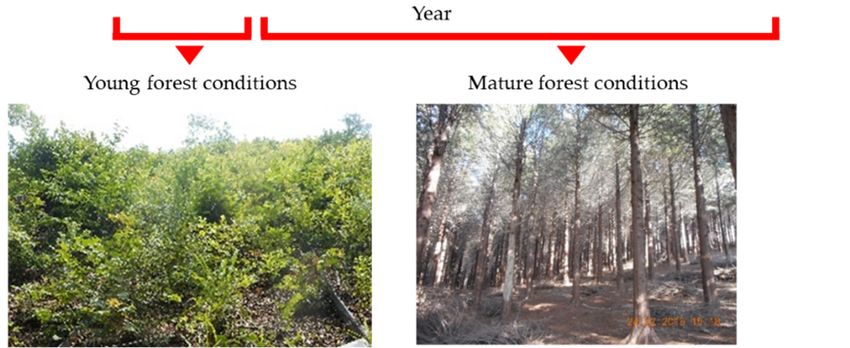
Age of sampled Japanese cypress trees varied by study site (Figure 3b). Trees at Suncheon and
Namhae sites dated back to 1967 and 1968, respectively. Trees at the Yeosu site were the youngest,
with the earliest rings occurring between 1991 and 2014. Industrial development has progressed, and
surrounding forests have been depleted in the Yeosu and Gwangyang areas since 1970s–1980s.
Tree cores during 1967–1977 showed linear increases for low Hg concentrations at Namhae and
Suncheon sites (Figure 3b). However, Hg concentrations in tree rings during 1978–2014 at study sites
were elevated with a constant distribution. Mercury concentrations in tree rings were compared over
the two periods (1967–1977 and 1978–2014) of the last 50 years and between sampling sites located
away from Yeosu and Gwangyang industrial areas (Table 1). Hg concentrations in tree rings between
1967 and 1977 were relatively low. They were 2.51 ng/g and 2.15 ng/g at Namhae and Suncheon sites,
respectively, showing no significant difference (p > 0.05).
Since the late 1970s, industrial activities including coal-fired power plants, chemical plants, and steel
mill continued near Yeosu and Gwangyang industrial areas (Figure 3). Average Hg concentrations
in tree rings at Yeosu, Namhae, and Suncheon sites during 1978–2014 were 11.15 ng/g, 6.54 ng/g,
and 4.34 ng/g, respectively (Table 1). Average Hg concentrations in tree rings between 1978 and 2014
appeared to be relatively higher than those prior to that period (1967–1977). There were significant
differences among these three sampling sites (p < 0.017). The Yeosu site located nearest to the Yeosu and
Gwangyang industrial areas showed the highest Hg concentrations in tree rings after 1977. In contrast,
the Suncheon site, which was the farthest away from Yeosu and Gwangyang industrial areas, had the
lowest concentrations of Hg in tree rings. In addition, Hg concentrations in tree rings at the Suncheon
site after 1987, when the largest steelworks in Gwangyang industrial area was started, did not show
increase. Instead, they had a constant distribution. However, Hg concentrations in tree rings at Namhae
site were abruptly elevated, coinciding with the operation of steelworks in 1987.3. Results
Age of sampled Japanese cypress trees varied by study site (Figure 3b). Trees at Suncheon and
Namhae sites dated back to 1967 and 1968, respectively. Trees at the Yeosu site were the youngest,
with the earliest rings occurring between 1991 and 2014. Industrial development has progressed,
Forests 2020, 11, 800
and
6 of 10
surrounding forests have been depleted in the Yeosu and Gwangyang areas since 1970s–1980s.
Figure 3.3. Relationship
Figure Relationship between
between industrial
industrial activities
activities at
at Yeosu
Yeosu and
and Gwangyang
Gwangyang industrial
industrial areas
areas (a),
(a),
historical distribution of Hg concentrations in Japanese cypress trees at Yeosu, Namhae,
historical distribution of Hg concentrations in Japanese cypress trees at Yeosu, Namhae, and Suncheon and
Suncheon
sites sitesto
according according to forest (b).
forest conditions conditions (b).
4. Discussion
4.1. Historical Hg Recorded in Tree Rings
In the Namhae and Suncheon areas between 1967 and 1972, low Hg concentrations in tree rings
showed linear increases, although there was limited Hg inflow from industrial activities (Figure 3b).
Many factories needed electricity to operate. Therefore, coal-fired power plants were installed in
Yeosu areas in 1973 which was the beginning of industrial development in Yeosu areas [23]. Previous
studies [16] have reported that high temperature promotes the growth of trees, resulting in increases of
Hg uptake from atmosphere. Although the average temperature at Namhae area was approximately
1.5 ◦ C higher than that at Suncheon area, tree ring Hg concentration at Namhae site was similar to that
at Suncheon site (Figures 2a and 3b). In this study, it was thought that tree ring Hg concentration was
not influenced by temperature variation. In addition, residential heating could cause Hg emissions
into the atmosphere [13,14]. Population at Namhae areas had a significant decrease after the 1960s,
whereas the population in the Suncheon areas was gradually increased over time (Figure 2c). However,
tree ring Hg concentrations at Namhae and Suncheon sites showed similar trends during 1967–1972.Forests 2020, 11, 800 7 of 10
No evidence showed a relation between factors affecting Hg uptake associated with temperature and
population and corresponding Hg concentration in tree rings during 1967–1972. Data reported by
Becnel et al. (2004) [31] showed a correlation between Hg concentrations in lichens and tree cores in a
large area of Louisiana. They suggested similar patterns of uptake for both trees and lichens known to
absorb atmospheric pollutants. However, lichens were not distributed on the bark of trees collected in
this study (Figure 3b). Therefore, it was thought that tree ring Hg concentration did not reflect Hg
uptake from the atmosphere at the Namhae and Suncheon sites prior to 1972.
Limited work has been published regarding levels of Hg in tree rings due to uncertainty about
whether tree rings could serve as reliable proxies for atmospheric Hg concentrations given that its
atmosphere concentrations were low. In addition, there was uncertainty regarding the mechanism of
Hg uptake into vegetation [4,18,19]. Plants can take up Hg from soils via roots and from the atmosphere
via leaves [4,18,19]. According to many studies [4,18,19], under a low air Hg concentration condition,
soil Hg concentration has a significant effect on foliar Hg concentration, whereas under a high air
Hg concentration condition, foliar Hg concentrations are dominated by atmospheric uptake. Foliar
uptakes are bidirectional and variable depending on air Hg conditions. The pattern of Hg concentration
across dated tree rings could help distinguish the importance of atmospheric versus soil source of Hg
to wood. If soil is the source of Hg to wood tissues, tree ring Hg concentrations should be relatively
increasing over time due to continued Hg accretion in soils from throughfall and litterfall [32–34].
The residence time of Hg in soil is quite long. Thus, we anticipate limited loss of Hg from soil pools [35].
Although there are no data on past mercury emissions from the Yeosu and Gwangyang industrial
areas, high Hg concentrations are expected to be emitted consistently as coal-fired plants, chemical
plants, and steelworks continue industrial activities since the late 1970s. If atmospheric deposition to
foliage is the source of Hg in tree tissues, radial Hg in the bole would show elevated and constant
concentrations since late 1970s in formed tree rings.
Tree ring Hg concentrations in this study can be divided into two patterns: (1) linear increase of
low Hg levels during 1967–1977 and (2) elevated and constant Hg concentrations during 1978–2014
(Figure 3b). Before 1977, Hg concentrations in tree rings were influenced by root uptakes under young
forest and low atmosphere Hg conditions. No evident relationship was found between annual growth
and corresponding Hg concentrations in trees [16]. Under young forest condition before 1977, Japanese
cypress seedlings were covered lushly by shrubs and vegetation known to accumulate Hg (Figure 3b).
Since shrubs and vegetation senesce each year, they could become an annual source of Hg to soils.
In addition, atmospheric Hg may be deposited into soil by wet processes [3]. Although the average
precipitation in the Namhae area was approximately 350 mm higher than that in the Suncheon area
(Figure 2b), tree ring Hg concentrations were similar between Namhae and Suncheon sites (Figure 3b).
There was no relation between precipitation and tree rings Hg concentration in this study. Previous
studies have found significant Hg contributions to forest soils via throughfall and litterfall, with the
contribution of litterfall being the greatest [3,20]. A soil source would be expected to result in increased
Hg concentration over time due to continued deposition of Hg to soil via litterfall [32–34]. Godbold
and Hutterman (1988) [36] have found that regardless of external Hg concentration, Hg concentration
in roots exceeded that in foliage. It remains unclear whether tree rings can serve as reliable proxies for
atmosphere Hg concentrations due to Hg uptakes from soils and limits from atmosphere under low
atmospheric Hg conditions.
Chemical plants and steel mill in Yeosu and Gwangyang areas have shown intensified activities.
They represent a proxy for regional production since late 1970s (Figure 3a). This might have led to a
large amount of Hg emissions to the atmosphere [5–12]. Frescholtz et al. (2003) [4] have noted that at a
high atmospheric Hg concentration, foliar Hg concentrations are dominated by atmospheric uptake.
An atmosphere source would be expected to result in elevated and constant Hg concentrations over time
due to the continued emission of Hg to the atmosphere via industrial activities. We observed elevated
and consistent concentrations since late 1970s in formed tree rings (Figure 3b). The radial pattern of
elevated Hg concentrations in tree rings since late 1970s supports the possibility of an atmosphericForests 2020, 11, 800 8 of 10
source. Results of this study indicate that tree rings in 1978–2014 could serve as an appropriate record
of Hg deposition in Yeosu and Gwangyang areas affected by intensified industrial activities.
4.2. Spatial Distribution of Hg Concentrations in Tree Rings
Between 1967 and 1977, Hg concentrations in tree rings did not vary among study sites (p > 0.05)
due to Hg uptake from soils (Table 1). Industrial activities in Yeosu and Gwangyang industrial areas
were intensified and continued since late 1970s (Figure 3a). In general, atmospheric Hg levels are
influenced by wind flow [37]. Mercury is highly volatile. It might be transported through a long
distance [10,12]. Hg concentrations of tree rings during 1978–2014 at study sites were elevated and
constant. Spatial distributions of Hg concentrations were associated with decreased distance from
industrial areas (p < 0.017) (Table 1). During 1978–2014, the highest concentration of Hg in tree
rings was found at the Yeosu site near Yeosu and Gwangyang industrial areas. However, the lowest
concentration of Hg in tree rings during 1978–2014 was found at the Suncheon site, which was far
away from Yeosu and Gwangyang industrial areas. Especially, Hg concentrations in tree rings at
Suncheon site after 1987 did not increase. They showed a constant concentration distribution despite
the operation of the largest steelworks in Gwangyang industrial area in 1987. Wind in Gwangyang
industrial area was predominantly in northwestern, western, and northeastern directions during
1987–2014 (Figure 1). The site of Suncheon located to the west of Gwangyang industrial areas was
relatively less affected by wind transmission of Hg from the steel mill in Gwangyang industrial area.
Tree ring Hg concentration at the Suncheon site was mainly influenced by the Yeosu industrial area.
However, the abruptly elevated Hg concentration in tree rings at the Namhae site coincided with
the operation of steelworks in 1987. Although Namhae sites are located far in the east of Yeosu
and Gwangyang industrial areas, Hg might have input from two sources in Yeosu and Gwangyang
industrial areas due to wind directions.
Temperature and residential heating of population seem to affect Hg concentrations in tree
rings [13,14,16]. Higher temperature seems to stimulate Hg uptake from the atmosphere [14].
Temperatures in Yeosu and Namhae areas were higher than those in Suncheon (Figure 2a). We observed
that Hg concentrations in trees at Yeosu and Namhae sites were higher than those at the Suncheon site
during 1978–2014 (Figure 3b). The Yeosu site, which was located near Yeosu and Gwangyang industrial
areas, had the highest Hg concentration in tree rings. In addition, residential heating of the population
can cause Hg emissions into the atmosphere [13,14]. The population has the largest number in Yeosu
and Gwangyang industrial areas (Figure 2c). Thus, Hg concentrations in tree rings at Yeosu site were
the highest during 1978–2014 compared to those at Namhae and Suncheon sampling sites (Figure 3b).
The Suncheon site, which was the farthest from Yeosu and Gwangyang industrial areas with limited
influence from wind direction, had a population 6.3-fold higher than the Namhae area, although Hg
concentrations in tree rings during 1978–2014 were lower than those at Nimhae site. In 1992, at the
Suncheon site, Hg concentrations in tree rings were abruptly increased, reaching the maximum value.
This was thought to be the result of Hg emission from residential heating in association with the largest
population in the Suncheon area in the early 1990s (Figure 2c). The distribution of Hg concentrations
in tree rings during 1978–2014 might have been influenced by temperature and population. However,
spatial distribution of Hg concentrations was found to be more affected by wind direction and distance
from Yeosu and Gwangyang industrial areas. These results suggest that tree ring could be used as a
valuable proxy to understand changing regional air Hg conditions under intensified industrial activities.
5. Conclusions
Collectively, our dendrochronological record showed that linear increases of low Hg concentrations
in tree rings before 1977 could not serve as a proxy for atmospheric Hg concentrations in areas with
nonindustrial and initial industrial activities. These Hg trends reflected the pathway of tree rings
before 1977 caused by Hg uptakes from soils via roots under low atmospheric Hg conditions. A soil
source of Hg would be expected to result in increased Hg concentrations over time due to the continuedForests 2020, 11, 800 9 of 10
deposition of Hg to soil via litterfall. However, tree ring Hg concentrations during 1978–2014 were
indicative of regional trends associated with industrial activities. These elevated and constant Hg
trends were consistent with anthropogenic emissions following intensified industrial activities known
to continue to release high Hg levels. Mercury levels decreased with increasing distance from industrial
areas. Wind direction also influenced the spatial distribution of tree ring Hg concentrations.
Author Contributions: Conceptualization, Y.S.A.; methodology, Y.S.A. and R.J.; data collection and formal analysis,
R.J. and J.-H.M.; data curation, R.J. and J.-H.M.; writing—original draft preparation, Y.S.A.; writing—review and
editing, Y.S.A.; supervision, Y.S.A.; funding acquisition, Y.S.A. All authors have read and agreed to final version of
the manuscript.
Funding: This study was supported by the R&D Program for Forest Science Technology (Project No.
2020183C10-2022-AA02) funded by Korea Forestry Promotion Institute.
Acknowledgments: The authors are grateful to Young Ju Lee of Korea Basic Science Institute for assistance with
mercury analysis.
Conflicts of Interest: The authors have no conflict of interest to disclose.
References
1. Clarkson, T.W. Human toxicology of mercury. J. Trace Elem. Med. 1998, 11, 303–317. [CrossRef]
2. Park, H.; Lee, K.; Moon, C.S.; Woo, K.; Kang, T.S.; Chung, E.K.; Son, B.S. Simultaneous exposure to heavy
metals among residents in the industrial complex: Korean national cohort study. Int. J. Environ. Res.
Public Health 2015, 12, 5905–5917. [CrossRef]
3. Frescholtz, T.E.; Gustin, M.S.; Schorran, D.E.; Fernandez, G.C. Assessing the source of mercury in foliar
tissue of quaking aspen. Environ. Toxicol. Chem. 2003, 22, 2114–2119. [CrossRef]
4. Schroeder, W.H.; Munthe, J. Atmospheric mercury—An overview. Atmos. Environ. 1998, 32, 809–822. [CrossRef]
5. Mortvedt, J.J. Heavy metal contaminants in inorganic and organic fertilizers. Fertil. Res. 1996, 43, 55–61.
[CrossRef]
6. Galbreath, K.C.; Zygarlicke, C.J. Mercury transformations in coal combustion flue gas. Fuel Process. Technol.
2000, 65, 289–310. [CrossRef]
7. Wilhelm, S.M. Estimate of mercury emissions to the atmosphere from petroleum. Environ. Sci. Technol. 2001,
35, 4704–4710. [CrossRef] [PubMed]
8. Nóvoa-Muñoz, J.C.; Pontevedra-Pombal, X.; Martínez-Cortizas, A.; Gayoso, E.G.-R. Mercury accumulation
in upland acid forest ecosystems nearby a coal-fired power-plant in Southwest Europe (Galicia, NW Spain).
Sci. Total Environ. 2008, 394, 303–312. [CrossRef] [PubMed]
9. Mirlean, N.; Baisch, P.; Machado, I.; Shumilin, E. Mercury contamination of soil as the result of long-term
phosphate fertilizer production. Bull. Environ. Contam. Toxicol. 2008, 8, 305–308. [CrossRef]
10. Hojdová, M.; Navrátil, T.; Rohovec, J.; Žák, K.; Vaněk, A.; Chrastný, V.; Svoboda, M. Changes in mercury
deposition in a mining and smelting region as recorded in tree rings. Water Air Soil Pollut. 2011, 216, 73–82.
[CrossRef]
11. Wang, F.; Wang, S.; Zhang, L.; Yang, H.; Gao, W.; Wu, Q.; Hao, J. Mercury mass flow in iron and steel
production process and its implications for mercury emission control. J. Environ. Sci. 2016, 43, 293–301.
[CrossRef] [PubMed]
12. Jung, R.; Ahn, Y.S. Distribution of mercury concentrations in tree rings and surface soils adjacent to a phosphate
fertilizer plant in southern Korea. Bull. Environ. Contam. Toxicol. 2017, 99, 253–257. [CrossRef] [PubMed]
13. Zhou, H.; Zhou, C.; Hopke, P.K.; Holsen, T.M. Mercury wet deposition and speciated mercury air
concentrations at rural and urban sites across New York state: Temporal patterns, sources and scavenging
coefficients. Sci. Total Environ. 2018, 637, 943–953. [CrossRef] [PubMed]
14. Dziok, T.; Grzywacz, P.; Bochenek, P. Assessment of mercury emissions into the atmosphere from the
combustion of hard coal in a home heating boiler. Environ. Sci. Pollut. Res. 2019, 26, 22254–22263. [CrossRef]
15. Huang, J.; Lyman, S.; Stamenkovic Hartman, J.; Gustin, M.S. A review of Passive sampling systems for
ambient air mercury measurements. Environ. Sci. Process. Impacts 2014, 16, 374–392. [CrossRef] [PubMed]
16. Zhang, L.; Qian, J.; Planas, D. Mercury concentration in tree rings of black spruce (Picea mariana Mill. B.S.P.)
in boreal Quebec, Canada. Water Air Soil Pollut. 1995, 81, 81–163. [CrossRef]Forests 2020, 11, 800 10 of 10
17. Wright, G.; Gustin, M.S.; Weiss-Penzias, P.; Miller, M.B. Investigation of mercury deposition and potential sources
at six sites from the Pacific Coast to the Great Basin, USA. Sci. Total Environ. 2014, 470, 1099–1113. [CrossRef]
18. Hanson, P.J.; Lindberg, S.E.; Tabberer, T.A.; Owens, J.G.; Kim, K.H. Foliar exchange of mercury vapor:
Evidence for a compensation point. Water Air Soil Pollut. 1995, 80, 373–382. [CrossRef]
19. Fay, L.; Gustin, M. Assessing the influence of different atmospheric and soil mercury concentrations on foliar
mercury concentrations in a controlled environment. Water Air Soil Pollut. 2007, 181, 373–384. [CrossRef]
20. Rea, A.W.; Keeler, G.J.; Scherbatskoy, T. The deposition of mercury in throughfall and litterfall in the Lake
Champlain watershed: A short term study. Atmos. Environ. 1996, 30, 3257–3263. [CrossRef]
21. Greger, M.; Wang, Y.; Neuschutz, C. Absence of Hg transpiration by shoot after Hg uptake by roots of six
terrestrial plant species. Environ. Pollut. 2005, 134, 201–208. [CrossRef] [PubMed]
22. Moon, I.; Cho, J.H. The chemical industry of South Korea: Progress and challenges. Chem. Eng. Prog. 2011,
107, 40–45.
23. Wikipedia. Honam Coal-Fired Power Plant. Available online: https://ko.wikipedia.org/wiki/%ED%98%B8%
EB%82%A8%ED%99%94%EB%A0%A5%EB%B0%9C%EC%A0%84%EC%86%8C (accessed on 1 June 2020).
24. Naver encyclopedia. Yeosu Coal-Fired Power Plant. Available online: https://terms.naver.com/entry.nhn?
docId=581178&cid=46631&categoryId=46631 (accessed on 1 June 2020).
25. Wikipedia. Gwangyang Steel Works. Available online: https://en.wikipedia.org/wiki/Gwangyang#:
~{}:text=Gwangyang%20Steel%20Works,-The%20Steel%20Works&text=It%20presently%20produces%
20coil%20used,people%20from%20around%20the%20globe (accessed on 1 June 2020).
26. Kim, J.S.; Kim, T.W. A study on the changes in forest community by air pollution at Yocheon district. J. Korean
Soc. Atmos. Environ. 1986, 2, 1–10. (In Korean)
27. Woo, S.Y.; Kim, D.G.; Lee, D.S. Effects of air pollution on physiological characteristics of Styrax japonica in
Yeochon industrial complex. J. Korean Soc. Atmos. Environ. 2000, 16, 121–128. (In Korean)
28. Korea Meteorological Administration. Weather Information. Available online: https://web.kma.go.kr/
weather/main.jsp (accessed on 1 June 2020). (In Korean)
29. Korean Statistical Information Service. Statistical Database with Population. Available online: http:
//kosis.kr/eng/index/index.do (accessed on 1 June 2020).
30. Environmental Protection Agency (EPA). Method 7473: Mercury in Solids and Solutions by Thermal
Decomposition, Amalgamation, and Atomic Absorption Spectrophotometry, Part of Test Methods for
Evaluating Solid Waste, Physical/Chemical Methods. Available online: https://www.epa.gov/hw-sw846/sw-
846-test-method-7473-mercury-solids-and-solutions-thermal-decomposition-amalgamation-and (accessed
on 1 March 2020).
31. Becnel, J.; Falgeust, C.; Cavalier, T.; Gauthreaux, K.; Landry, F.; Blanchard, M.; Beck, M.J.; Beck, J.N. Correlation
of mercury concentrations in tree core and lichen samples in southeastern Louisiana. Microchem. J. 2004, 78,
205–210. [CrossRef]
32. Risch, M.R.; DeWild, J.F.; Krabbenhoft, D.P.; Kolka, R.K.; Zhang, L. Litterfall mercury dry deposition in the
eastern USA. Environ. Pollut. 2012, 161, 284–290. [CrossRef]
33. Risch, M.R.; DeWild, J.F.; Gay, D.A.; Zhang, L.; Boyer, E.W.; Krabbenhoft, D.P. Atmospheric mercury
deposition to forests in the eastern USA. Environ. Pollut. 2017, 228, 8–18. [CrossRef]
34. Wang, X.; Bao, Z.; Lin, C.J.; Yuan, W.; Feng, X. Assessment of global mercury deposition through litterfall.
Environ. Sci. Technol. 2016, 50, 8548–8557. [CrossRef]
35. Yu, X.; Driscoll, C.T.; Warby, R.A.; Montesdeoca, M.; Johnson, C.E. Soil mercury and its response to atmospheric
mercury deposition across the northeastern United States. Ecol. Appl. 2014, 24, 812–822. [CrossRef]
36. Godbold, D.L.; Hutterman, A. Inhibition of photosynthesis and transpiration in relation to mercury-induced
root damage in spruce seedlings. Physiol. Plant. 1988, 74, 270–275. [CrossRef]
37. Wängberg, I.; Munthe, J.; Pirrone, N.; Iverfeldt, Å.; Bahlman, E.; Costa, P.; Ebinghaus, R.; Feng, X.; Ferrara, R.;
Gardfeldt, K.; et al. Atmospheric mercury distribution in Northern Europe and in the Mediterranean region.
Atmos. Environ. 2001, 35, 3019–3025. [CrossRef]
© 2020 by the authors. Licensee MDPI, Basel, Switzerland. This article is an open access
article distributed under the terms and conditions of the Creative Commons Attribution
(CC BY) license (http://creativecommons.org/licenses/by/4.0/).You can also read