Are millennialS truly ruling? - SMC Global
←
→
Page content transcription
If your browser does not render page correctly, please read the page content below

A Weekly Update from SMC
2019: Issue 714, Week: 16th - 20th December                                   (For private circulation only)

              are millennialS truly ruling?
                      Now that the youngest Millennials are adults, the economy is
                      truly social and marketeers need to employ new engagement
                                            business models.

                                                                                                        Brand smc 498
www.smcfinance.com

                                                               At SMC Finance, We make it easy for you to get a loan.

                FOCUS ON                                       Whether you are expanding your business, upgrading
                                                               new equipments or for working capital. We are here to
                YOUR BUSINESS,                                 help you grow fast.

                NOT FINANCE                                    Professional and Transparent approach

                Get easy business loans                        Quick loan approval & disbursal
                with SMC Finance                               Hassle-free documentation process
                                                               Attractive Rate of Interest

                                                               Call Toll-Free     1800 11 8818
                                                               E-mail nbfccare@smcfinance.com

Medical Equipment Finance | Personal Loan | Loan Against Property | Loan Against Shares/Mutual Funds/Bonds |
MSME/SME Financing | Lease Rental Discounting | Promoter Financing | Debtors Financing | Structured Financing           |
Affordable Housing Application Financing | IPO/ NCD Financing | Business Loan
Moneywise Financial Services Pvt. Ltd. (A wholly owned subsidiary of SMC Global Securities Ltd.)
An RBI Registered NBFC
Regd. Off.: 11/6-B, 2nd Floor, Shanti Chamber, Pusa Road, New Delhi - 110005, Tel. +91-11-30111000, CIN No.: U51996PTC353582
SMC GROUP PRESENCE:
DELHI     |    MUMBAI      |    KOLKATA       |    AHEMDABAD        |    LUCKNOW        |    CHANDIGARH        |    DUBAI
From The Desk Of Editor
    Contents

                                                                                                     I
    Equity                                                                         4-7                   n the week gone by, market moved higher after the Fed left interest rates
    Derivatives                                                                    8-9                   unchanged on Wednesday while expressing optimism about U.S. economic health.
    Commodity                                                                   10-13                    Even the European Central Bank decided to keep its main deposit rate at negative
    Currency                                                                        14               0.5%, while maintaining its rate of asset purchases at €20 billion a month in the recent
                                                                                                     meeting. The ECB meeting was the first presided over by new President Christine
    IPO                                                                             15
                                                                                                     Lagarde. Moreover, optimism that the Trump administration will clinch a deal with
    FD Monitor                                                                      16
                                                                                                     China on trade and avert fresh tariffs boosted the sentiments of the investors.
    Mutual Fund                                                                 17-18
                                                                                                     Actually, this news has fueled hopes that the trade spat between the world's two
                                                                                                     largest economies may finally come to an end. British Prime Minister Boris Johnson has
    SMC GLOBAL SECURITIES LTD.                                                                       won the historic UK General Election marking a victory for his "Get Brexit Done"
    REGISTERED OFFICES:                                                                              message and setting the UK on course to leave the EU in the New Year. Meanwhile,
    11 / 6B, Shanti Chamber, Pusa Road, New Delhi 110005.                                            business confidence at big Japanese manufacturers worsened in the three months to
    Tel: 91-11-30111000, Fax: 91-11-25754365
                                                                                                     December to its lowest level more than six years. According to the central bank's
    MUMBAI OFFICE:
                                                                                                     "tankan" survey the prolonged U.S.-China trade war and global slowdown has weighed
    Lotus Corporate Park, A Wing 401 / 402 , 4th Floor ,
                                                                                                     on the export-led economy.
    Graham Firth Steel Compound, Off Western Express Highway,

    Jay Coach Signal, Goreagon (East) Mumbai - 400063                                                Back at home, domestic markets moved higher led by global euphoria over progress in
    Tel: 91-22-67341600, Fax: 91-22-67341697                                                         US-China trade and government's measures to ease rules for shadow banks. However,
    KOLKATA OFFICE:                                                                                  a rising inflation and falling factory output, capped gains. India's retail inflation for
    18, Rabindra Sarani, Poddar Court, Gate No-4,5th Floor, Kolkata-700001
                                                                                                     November climbed to a more than three-year high of 5.54 per cent while industrial
    Tel.: 033 6612 7000/033 4058 7000, Fax: 033 6612 7004/033 4058 7004
                                                                                                     production shrank for the third consecutive month in October by 3.8 per cent. On the
    AHMEDABAD OFFICE :
    10/A, 4th Floor, Kalapurnam Building, Near Municipal Market,                                     currency front, the Indian rupee appreciated against the US dollar as gains in domestic
    C G Road, Ahmedabad-380009, Gujarat                                                              equity market and positive developments on the US-China trade talk front
    Tel : 91-79-26424801 - 05, 40049801 - 03
                                                                                                     strengthened investor sentiments. According to Nomura, India's economy is expected
    CHENNAI OFFICE:
                                                                                                     to grow at 4.3% in the fourth quarter of this fiscal amid concerns over crisis in the NBFC
    Salzburg Square, Flat No.1, III rd Floor, Door No.107, Harrington Road,
    Chetpet, Chennai - 600031.
                                                                                                     sector. Going further market will continue to track the global as well as the domestic
    Tel: 044-39109100, Fax -044- 39109111
                                                                                                     factors to get the further direction.
    SECUNDERABAD OFFICE:
                                                                                                     On the commodity market front, bullion counter may trade with mixed bias as US
    315, 4th Floor Above CMR Exclusive, BhuvanaTower,
                                                                                                     China trade war is expected to guide its sentiments. Recently fresh comments by US
    S D Road, Secunderabad, Telangana-500003
                                                                                                     President Trump stated that US was very close to nailing down a deal with
    Tel : 040-30031007/8/9
                                                                                                     China, making the riskier assets more attractive putting pressure on the safe
    DUBAI OFFICE:
    2404, 1 Lake Plaza Tower, Cluster T, Jumeriah Lake Towers,                                       have asset. Crude oil prices may remain on upside path as the United States and China
    PO Box 117210, Dubai, UAE                                                                        moved closer to a resolution to the 18-month trade war between the world’s two
    Tel: 97145139780 Fax : 97145139781                                                               biggest economies that have raised big questions about global demand for crude.
    Email ID : pankaj@smccomex.com
                                                                                                     Copper may take support near 430 levels and recover towards 450 levels as declining
                smcdmcc@gmail.com
                                                                                                     stocks on the LME were supporting copper prices. Natural gas prices can witness
                                                                                                     recovery after demand will increase this week as cooling returns across many regions
    Printed and Published on behalf of
    Mr. Saurabh Jain @ Publication Address
                                                                                                     of the US, coldest across the Midwest and Northeast. This week US GDP, retail sales,
    11/6B, Shanti Chamber, Pusa Road, New Delhi-110005                                               industrial production, housing starts, building permits, Jolt job opening, US jobless
    Website: www.smcindiaonline.com                                                                  claim existing home sales, Michigan consumer sentiment and China retail sales and
    Investor Grievance : igc@smcindiaonline.com
                                                                                                     industrial production are some very important triggers for this week.
    Printed at: S&S MARKETING

    102, Mahavirji Complex LSC-3, Rishabh Vihar, New Delhi - 110092 (India)

    Ph.: +91-11- 43035012, 43035014, Email: ss@sandsmarketing.in
                                                                                                                                                                                                       (Saurabh Jain)

SMC Global Securities Ltd. (hereinafter referred to as “SMC”) is a registered Member of National Stock Exchange of India Limited, Bombay Stock Exchange Limited and its associate is member of MCX stock Exchange Limited. It is also
registered as a Depository Participant with CDSL and NSDL. Its associates merchant banker and Portfolio Manager are registered with SEBI and NBFC registered with RBI. It also has registration with AMFI as a Mutual Fund Distributor.
SMC is a SEBI registered Research Analyst having registration number INH100001849. SMC or its associates has not been debarred/ suspended by SEBI or any other regulatory authority for accessing /dealing in securities market.
SMC or its associates including its relatives/analyst do not hold any financial interest/beneficial ownership of more than 1% in the company covered by Analyst. SMC or its associates and relatives does not have any material conflict of
interest. SMC or its associates/analyst has not received any compensation from the company covered by Analyst during the past twelve months. The subject company has not been a client of SMC during the past twelve months. SMC or
its associates has not received any compensation or other benefits from the company covered by analyst or third party in connection with the research report. The Analyst has not served as an officer, director or employee of company
covered by Analyst and SMC has not been engaged in market making activity of the company covered by Analyst.
The views expressed are based solely on information available publicly available/internal data/ other reliable sources believed to be true.
SMC does not represent/ provide any warranty express or implied to the accuracy, contents or views expressed herein and investors are advised to independently evaluate the market conditions/risks involved before making any
investment decision.
EQUITY

   NEWS                                                                                TREND SHEET
                             DOMESTIC NEWS
Economy                                                                          Stocks                 *Closing Trend            Date           Rate       SUPPORT RESISTANCE Closing
• India's industrial output contracted 3.8 percent in October against a                                  Price                   Trend          Trend                                            S/l
   4.3 percent contraction in September. Industrial output, or factory
   output, is the closest approximation for measuring the economic                                                             Changed Changed
   activity of the country's business landscape.                                 S&P BSE SENSEX 41010                  UP      08.02.19         36546          36300                          35300
• India's Consumer prices increased 5.54 percent year-on-year in
   November, faster than the 4.62 percent increase in October. In the            NIFTY50                12087          UP      08.02.19         10944          10900                          10600
   same period last year, inflation was 2.33 percent. The rate was also
   above economists' forecast of 5.3 percent.                                    NIFTY IT               15201          UP      21.07.17         10712          15200                          14800
Information Technology
• Tata Consultancy Services announced a new partnership with Flisa               NIFTY BANK             32014          UP      30.11.18         26863          27700                          27000
   Smart Factory, part of the Finnish telecommunications company Elisa,
                                                                                 ACC                     1465       DOWN 04.10.19                1488                           1520          1540
   to market and deploy the latter's industrial IoT (IIoT) and advanced
   analytics solutions to a wide range of manufacturers across the world.        BHARTIAIRTEL             428          UP      15.03.19           338            410                            390
Engineering
• The Heavy Civil Infrastructure business of L&T Construction has                BPCL                     497          UP      30.08.19           355            470                            450
   secured a prestigious order from Rail Vikas Nigam for the construction
   of Rishikesh - Karanprayag Tunnel 2 package works comprising tunnels,         CIPLA                    461          UP      25.10.19           460            440                            430
   bridges and formation works in the state of Uttarakhand. The project
   consists of the main tunnel with parallel escape tunnel and ballast-less      SBIN                     333          UP      01.11.19           314            315                            305
   track that runs inside the main tunnel. This is a fast track project to be
   completed within stringent timelines.                                         HINDALCO                 208          UP     13.12.19           208            196                            193
• Sterling & Wilson Solar announced that Sterling & Wilson Solar
                                                                                 ICICI BANK               537          UP      20.09.19           418            490                            480
   Australia, a subsidiary of the Company in Australia, has executed a
   definitive contract for Engineering, Construction and Procurement for         INFOSYS                  711       DOWN 25.10.19                 637                            690            720
   a 144 MW DC Solar Farm in Australia amounting to AUD 170.60 million
   (approx. Rs 827 crore).                                                       ITC                      242       DOWN 31.05.19                 279                            260            270
Realty/ Construction
• Dilip Buildcon has been declared L1 bidder through JV by Delhi Metro           L&T                     1305       DOWN 15.11.19                1378                           1370           1390
   Rail Corporation for the project 'Part Design and Construction of
   Elevated Viaduct, Elevated Ramp, Siding lines, Viaduct for connection         MARUTI                  7215       DOWN 06.12.19                6887                           7250           7350
   to Mukundpur Depot and four Elevated Stations, Phase-IV of Delhi MRTS
   and partly integrated and partly independent flyover of PWD between           NTPC                     116       DOWN 16.08.19                 118                            120            124
   Azadpur and Derawal Nagar on G.T. Road. The bid project cost is Rs
                                                                                 ONGC                     127       DOWN 06.12.19                 127                            136            141
   825.56 crore.
Cables                                                                           RELIANCE                1583          UP      16.08.19          1278          1500                           1480
• Sterlite Technologies has signed a Memorandum of Understanding with
   Indian Institute of Technology Madras, for sponsoring a Chair Professorship   TATASTEEL                428          UP      01.11.19           396            390                            375
   in 5G. Under this MoU, the Company and IIT Madras will partner for research                                                                                               Closing as on 13-12-2019
   and advancements in 5G communications technology.
Media & Entertainment
• Inox Leisure has commenced the Commercial Operations of a Multiplex            NOTES:
                                                                                 1) These levels should not be confused with the daily trend sheet, which is sent every morning by e-mail in the name
   Cinema Theatre taken on Lease basis, located at INOX Leisure, 4th                of "Morning Mantra ".
                                                                                 2) Sometimes you will find the stop loss to be too far but if we change the stop loss once, we will find more strength
   Floor, Orion Mall, Mohaddipur, Gorakhpur, Uttar Pradesh. The                     coming into the stock. At the moment, the stop loss will be far as we are seeing the graphs on weekly basis and
   Multiplex Cinema Theatre has 4 screens and 748 seats.                            taking a long-term view and not a short-term view.

Pharmaceuticals
• Strides Pharma Science has got tentative approval from US health                     FORTHCOMING EVENTS
   regulator for Diclofenac Potassium Softgel Capsules a drug used to
   relieve pain.                                                                 Ex-Date                  Company                               Purpose

                         INTERNATIONAL NEWS                                      18-12-2019               Borosil Glass                         65% Dividend
• US producer price index for final demand was flat in November after
                                                                                 19-12-2019               Bharti Infra.                         27.5% Second Interim Dividend
  climbing by 0.4 percent in October. Economists had expected prices to
  rise by 0.2 percent.                                                           26-12-2019               Balmer Lawrie                         1:2 Bonus Issue of Equity Shares
• US initial jobless claims surged up to 252,000, an increase of 49,000
  from the previous week's unrevised level of 203,000. Economists had            Meeting Date             Co_Name                               Purpose
  expected jobless claims to edge up to 213,000.
• US consumer price index rose by 0.3 percent in November after                  16-12-2019               Tilaknagar Inds.                      Quarterly Results
  climbing by 0.4 percent in October. Economists had expected prices to          19-12-2019               Khaitan (India)                       Quarterly Results
  edge up by 0.2 percent.
• US factory orders rose by 0.3 percent in October after falling by a            19-12-2019               Manpasand Bever.                      Quarterly Results
  revised 0.8 percent in September. Economists had expected orders to
  rise by 0.3 percent compared to the 0.6 percent drop originally                27-12-2019               RBL Bank                              Preferential Issue
  reported for the previous month.
                                                                                 02-01-2020               Dr Reddy's Labs                       Scheme of Amalgamation, Scheme of
• The European Central Bank left its key interest rates, asset purchases
  and forward guidance, in the first policy session chaired by the new                                                                          Arrangement
  chief Christine Lagarde. The Governing Council decided to hold the             03-01-2020               Bharti Airtel                         Raising funds through Debt Instr.
  refi rate unchanged at a record low 0 percent, the deposit rate at -0.50
  percent and the marginal lending rate at 0.25 percent. The move was            04-01-2020               Unitech                               Quarterly Results
  in line with economists' expectations.
• Producer prices in Japan were up 0.2 percent on month in November.             18-01-2020               HDFC Bank                             Quarterly Results
  That beat expectations for an increase of 0.1 percent following the 1.1
  percent drop in October.                                                       23-01-2020               EIH Assoc.Hotels                      Quarterly Results

                                                                                                                                                                                                       4
EQUITY
INDIAN INDICES (% Change) SECTORAL INDICES (% Change)
0.60 2.00
1.75
0.42
0.40 0.34 1.50 1.41
0.22
0.19 1.07
0.20 1.00
0.81
0.57
0.00
0.50
0.27
0.15
-0.20
0.00
-0.22
-0.14
-0.40
-0.50
-0.60
-0.81
-1.00
-0.80 -1.14
-0.86 -1.50
-1.00
Ni y Sensex BSE Midcap BSE Smallcap Ni y Next 50 S&P CNX 500
-2.00
SMC Trend
-2.50
Nifty Sensex BSE Midcap BSE Smallcap Nifty Next S&P CNX 500
-2.75
-3.00
Auto Index Bankex Cap Goods Cons Durable FMCG Index Healthcare IT Index Metal Index Oil & Gas Index Power Index Realty Index
Index Index Index
GLOBAL INDICES (% Change)
SMC Trend
2.00
1.87
Auto Cap Goods FMCG IT Oil & Gas
Bank Cons Durable Healthcare Metal Power
Realty
1.50
FII/FPI & DII ACTIVITY (In Rs. Crores)
1.00 1000.00
810.23
0.70 0.72 800.00
605.41
600.00 459.22
0.47
0.50 0.42
400.00 338.40
0.30
210.72 239.87
0.13
0.21 200.00 74.93
0.00
0.00
0.00
-200.00
-400.00
-366.79
-0.50 -600.00
Nasdaq Comp. Dow Jones S&P 500 Nikkei Strait Times Hang Seng Shanghai Comp. FTSE 100 CAC 40
* -800.00 -683.83
-1000.00 -867.66
SMC Trend
Nasdaq Nikkei Hang Seng FTSE 100 Friday Monday Tuesday Wednesday Thursday
Dow jones Strait times Shanghai CAC 40
S&P 500
FII / FPI Activity DII trading activity
Up Down Sideways
BSE SENSEX TOP GAINERS & LOSERS (% Change) NSE NIFTY TOP GAINERS & LOSERS (% Change)
10.00 10.00
7.34 7.34
4.94
5.00 3.92 3.76 5.00 3.83 3.57
2.68 2.47 2.97
0.00 0.00
-1.91 -1.86
-5.00 -5.00 -2.89
-5.00 -4.27 -4.27 -3.99
-4.84
-10.00 -10.00
-15.00
-15.00
-20.00
-19.02 -20.00 -19.02
-25.00
-25.00
Tata Motors Tata Steel Tata Motors- Bajaj Fin. Kotak Mah. Yes Bank TCS HCL ITC Infosys
Tata Motors Eicher Motors Tata Steel Bajaj Finserv IOCL Yes Bank TCS HCL UltraTech Bhar Infra.
DVR Bank Technologies
Technologies Cem.
5
EQUITY
Beat the street - Fundamental Analysis
AHLUWALIA
Securities & CONTRACTS
Intelligence (INDIA)
ServicesLIMITED
India Limited CMP: 331.00
925.75 Target Price: 402
1049 Upside: 13%
21%
VALUE PARAMETERS Investment Rationale reported at 23% growth. Additionally, its operating
• Securities & Intelligence Services India Limited (SIS) is a profit margins expanded by 36% on a YoY basis
Face Value (Rs.) 10.00
market leader in all the 3 business segments of Security, during the quarter, driven by operating leverage
52 Week High/Low 994.00/702.40 Facility management & Cash Logistics services. benefits and the margin-accretive acquisitions.
M.Cap (Rs. in Cr.) 6787.45 • The company has consistently strengthened its Risk
market position in key service segments and • Working capital intensive nature of operations
EPS (Rs.) 38.60 geographies through the organic and inorganic • Competitive nature of industry
P/E Ratio (times) 23.98 routes and has emerged as the leading security Valuation
service provider in India and Australia. The company has strong track record on quarterly as
P/B Ratio (times) 5.00 • On the development front, acquisition of well as yearly basis. According to the management,
Dividend Yield (%) 0.38 Henderson Security Services Pte. Ltd., Singapore impressive client wins, strong focus on operations and
and Henderson Technologies Pte. Ltd., Singapore rigorous monitoring of costs have helped all the
Stock Exchange BSE (collectively referred to as Henderson) and business units deliver good revenue and profitability
% OF SHARE HOLDING Platinum 4 Group Limited (P4G) in FY2019 has metrics. The management believes that the recent
provided it entry into the security services markets acquisitions would help in strengthening its position in
in Singapore and New Zealand, respectively. key micro-markets in India (i.e. Gurugram and
2.91
Foreign • Apart from the acquisitions of Henderson and P4G, Bengaluru) and in segments (i.e. facility management
15.47 6.52 SISL had acquired three other entities in FY2019 - in the healthcare segment) and expand its footprint to
Ins tu ons SLV Security Services Private Limited (SLV), Rare
0.77 Singapore (via Henderson) and New Zealand (via P4G).
Hospitality and Services Private Limited (Rare) and Thus, it is expected that the stock will see a price
Non Promoter Corporate
74.34 Holding Uniq Detective and Security Services Private target of Rs.1049 in 8 to 10 months time frame on a one
Promoters Limited (Uniq). year average P/Ex of 23.98x and FY21 EPS of Rs.43.75.
• Over the past five years, its consolidated revenues
Public & Others have grown at a robust CAGR of 22%. While this has P/E Chart
been supported to some extent by inorganic 2500.00
` in cr
investments (Duster, SXP, Rare, SLV, Uniq,
ACTUAL ESTIMATE
Henderson etc), organic growth across entities like 2000.00
FY Mar-19 FY Mar-20 FY Mar-21 SIS India, Service Master Clean, MSS Security, etc, 1500.00
REVENUE 7093.27 8512.19 9682.00 also remained healthy, driven both by wage hikes
EBITDA 365.16 512.27 582.60 and expanding market presence. 1000.00
EBIT 299.21 420.97 487.08 • SISL reported healthy scale up in operations and 500.00
also expanded its profit margins in Q2 FY2020,
NET INCOME 214.68 280.21 326.12
aided by margin-accretive acquisitions done over 0.00
30-Apr-19
11-Sep-17
6-Dec-17
27-Sep-18
26-Feb-19
25-Sep-19
29-Jun-18
27-Jul-18
27-Jun-19
25-Jul-19
31-Dec-18
28-Mar-19
5-Apr-18
8-Nov-17
4-Jan-18
10-Aug-17
10-Oct-17
2-Feb-18
28-Aug-18
29-Oct-18
26-Aug-19
29-Oct-19
4-May-18
1-Jun-18
6-Mar-18
29-Nov-18
28-Jan-19
27-Nov-19
29-May-19
EPS 29.01 37.76 43.75 FY2019, as well as organic growth across entities.
BVPS 170.49 202.58 238.89 Consolidated revenues increased from Rs1690.20
ROE 18.85% 20.09% 19.55% cr in Q2 of FY19 to Rs2,089 cr in Q2 of FY20, 22 35 48 61 Close Price
GHCL
HEXAWARE
Limited
TECHNOLOGIES LIMITED CMP: CMP:
382.90
198.95 Target Price:
Target 441 227
Price: Upside: 14%
15%
VALUE PARAMETERS Investment Rationale of reporting sustainable EBITDA margin of 30- 32%
• GHCL Limited has established itself as a well- during FY20.
Face Value (Rs.) 10.00 diversified group with an ascertained footprint in Risk
52 Week High/Low 277.20/178.50 chemicals, textiles and consumer products • Capacity addition by competitors
segment. In chemicals, the company mainly • Foreign exchange fluctuation
M.Cap (Rs. in Cr.) 1953.95 manufactures Soda Ash that is a major raw material Valuation
EPS (Rs.) 44.23 for detergents & glass industries and Sodium GHCL has an established position in the domestic soda
Bicarbonate. Its textiles operation is an integrated ash industry and its recent expansion and plans to
P/E Ratio (times) 4.50 set up which commences right from spinning of fiber further expand its chemicals and textile business are
P/B Ratio (times) 0.94 (yarn), weaving, dyeing, printing till the finished likely to support its overall margins and returns. The
products, like sheets & duvets, which are primarily company is optimistic about the Home Textiles
Dividend Yield (%) 2.51 exported worldwide. division and according to the management of the
Stock Exchange BSE • It is likely beneficiary of the favorable demand company, the chemicals business has performed well,
supply dynamics of domestic soda ash industry in despite a slow demand in growth and increase in
light of the tight supply situation in the Asian supply which has led to some pressure on pricing. The
% OF SHARE HOLDING market due to the curtailment of capacity from Textile performance has also been satisfactory and in
China. It has sound liquidity position on account of line with expectations despite significant impact of
Foreign its healthy cash flow generation from operations. US-China trade war. The company has been striving
• It has its own cost competencies owing to captive for judicious capital allocation and the last six
27.09 17.51
Ins tu ons mines of lignite, limestone and salt resulting in months have witnessed a reduction in its debt. We
16.98
healthy operating performance along with its high expect the stock to see a price target of Rs.227 in 8 to
Non Promoter Corporate brand recall value. 10 months time frame on an expected P/E of 4.5x and
18.93
19.48
Holding • Soda Ash business margin during the quarter FY21E earnings of Rs. 50.45.
Promoters improved to 35.7%, supported by higher
realization and higher volume. Volume during the
Public & Others quarter stood at 2.36LT up 3% YoY. The uptick in the P/E Chart
volume is supported by commissioning of 125KT 600.00
` in cr
brownfield capacity expansion. Production during 500.00
ACTUAL ESTIMATE the quarter increased by 30KT.
FY Mar-19 FY Mar-20 FY Mar-21 • In Q2 FY20, Inorganics Chemicals division's revenue 400.00
REVENUE 3341.32 3468.11 3619.28 grew by 2% to Rs. 542 crores in Q2FY20 as 300.00
EBITDA 759.40 846.58 892.33 compared to Rs.534 crores in Q2FY19 and home 200.00
Textiles business revenue declined by 7% to Rs. 283
EBIT 642.46 715.90 757.60 crores in Q2FY20 as compared to Rs.305 crores in 100.00
NET INCOME 350.58 463.72 494.53 Q2FY19 mainly due to weak spinning scenario. 0.00
• The management of the company expects sales
20-Apr-15
27-Apr-16
13-Feb-15
19-Feb-16
28-Feb-17
18-Sep-19
18-Jun-15
24-Jun-16
16-Jul-19
15-Dec-14
21-Dec-15
28-Dec-16
12-Mar-19
2-Nov-17
2-Jan-18
9-Nov-18
17-Aug-15
19-Oct-15
25-Aug-16
28-Oct-16
3-May-17
1-Sep-17
8-May-18
5-Sep-18
3-Jul-17
5-Jul-18
6-Mar-18
10-Jan-19
21-Nov-19
16-May-19
EPS 35.50 47.35 50.45
BVPS 196.28 237.70 282.20 volume of 1MT in FY20E, up 7.5% YoY and domestic
market to witness incremental production of 400kt
ROE 19.83% 20.87% 18.68% in FY20. Moreover, the management is confident 3 6 9 11 Close Price
Above calls are recommended with a time horizon of 8 to 10 months. Source: Company Website Reuters Capitaline
6
EQUITY

     NMDC Limited (NMDC)

                                                                                             The stock closed at Rs 114.25 on 13th December 2019. It made a 52-week low of
                                                                                             Rs 74.80 on 23rd August 2019 and a 52-week high of Rs. 120.55 on 03rd July 2019.
                                                                                             The 200 days Exponential Moving Average (DEMA) of the stock on the daily chart
                                                                                             is currently at Rs 102.27

                                                                                             As we can see on chart that stock was formed an “Inverted Head and Shoulder”
                                                                                             pattern on weekly charts and has given the neckline breakout of pattern and
                                                                                             also has managed to close above the same. Apart from this, technical indicators
                                                                                             like RSI and MACD are also suggest buying for the stock, so one can initiate long
                                                                                             in the range of 112-113 levels for the upside target of 124-127 levels with SL
                                                                                             below 106.

     SRF Limited (SRF)

                                                                                             The stock closed at Rs 3303 on 13th December, 2019. It made a 52-week low at Rs
                                                                                             1906 on 26th December 2018 and a 52-week high of Rs. 3342.95 on 13th
                                                                                             December 2019. The 200 days Exponential Moving Average (DEMA) of the stock on
                                                                                             the daily chart is currently at Rs 2747.40

                                                                                             Short term, medium term and long term bias are looking positive for the stock as
                                                                                             it is trading in higher highs and higher lows on weekly charts, This is bullish in
                                                                                             nature. Moreover, it was formed a “Bull Flag” pattern on charts and has given the
                                                                                             breakout of same so buying momentum can continue in coming days. Therefore,
                                                                                             one can buy in the range of 3260-3270 levels for the upside target of 3600-3700
                                                                                             levels with SL below 3100.

Disclaimer : The analyst and its affiliates companies make no representation or warranty in relation to the accuracy, completeness or reliability of the information contained in its
research. The analysis contained in the analyst research is based on numerous assumptions. Different assumptions could result in materially different results.
The analyst not any of its affiliated companies not any of their, members, directors, employees or agents accepts any liability for any loss or damage arising out of the use of all or any
part of the analysis research.
SOURCE: CAPITAL LINE

Charts by Spider Software India Ltd

                                                  Above calls are recommended with a time horizon of 1-2 months

                                                                                                                                                                                         7
DERIVATIVES
WEEKLY VIEW OF THE MARKET
Bulls once again made a comeback in Indian markets as Nifty along with Sensex surged sharply higher in the week gone by on the back of strong global cues. From
derivative front, call writers at 12000 strike are seen covering their short positions while put writers added significant open interest. Broadly buying was seen in
Auto, PSU banks, Metal and FMCG counters, which lifted the index towards its record peaks once again. From technical front, as well Indian, markets bounced
sharply from its support levels of 11800 and seen heavy long build into the prices. However, on a higher side 12150 would be immediate hurdle for Nifty while
Bank Nifty has immediate resistance at 32200 levels above which we can further witness follow up buying coming into a market. The Implied Volatility (IV) of calls
closed at 11.74% while that for put options closed at 12.25%. The Nifty VIX for the week closed at 13.35% and is expected to remain volatile. PCR OI for the week
closed at 1.35. For coming week, we expect that the still there is lot of outstanding position is held with call writers, and we can witness further short covering.
After almost V shape recovery into the prices, technical setup in Nifty also suggest for further upside into prices.
DERIVATIVE STRATEGIES
BULLISH STRATEGY BEARISH STRATEGY
JUBLFOOD HDFCBANK HINDUNILVR
BUY DEC 1640 CALL 32.40 BUY DEC 1280 CALL 12.45 BUY DEC 1980 PUT 18.45
OPTION SELL DEC 1660 CALL 25.00 SELL DEC 1300 CALL 6.80 SELL DEC 1960 PUT 13.00
STRATEGY
Lot size: 500 Lot size: 500 Lot size: 300
BEP: 1647.40 BEP: 1285.65 BEP: 1974.55
Max. Profit: 6300.00 (12.60*500) Max. Profit: 7175.00 (14.35*500) Max. Profit: 4365.00 (14.55*300)
Max. Loss: 3700.00 (7.40*500) Max. Loss: 2825.00 (5.65*500) Max. Loss: 1635.00 (5.45*300)
BUY CHOLAFIN (DEC FUTURE) SELL INDIGO (DEC FUTURE) SELL APOLLOHOSP (DEC FUTURE)
Buy: Above `319 Sell: Below `1309 Sell: Below `1355
FUTURE
Target: `328 Target: `1225 Target: `1296
Stop loss: `314 Stop loss: `1355 Stop loss: `1384
NIFTY OPTION OI CONCENTRATION (IN QTY) (MONTHLY) CHANGE IN NIFTY OPTION OI (IN QTY) (MONTHLY)
In lakhs In lakhs
35.39
10.46
40.00 12.00
32.60
35.00 10.00
27.94
25.45
6.03
30.00 8.00
5.57
23.99
4.87
25.00 6.00
18.81
2.37
2.24
16.48
4.00
1.89
1.61
15.36
15.22
1.29
20.00
0.56
13.02
12.74
12.42
0.15
0.14
0.11
2.00
15.00
9.45
9.24
0.00
7.68
7.65
6.74
-0.06
10.00
5.66
-0.21
-0.26
4.42
-2.00
-0.88
4.00
-1.02
3.10
-1.42
-1.43
-1.45
0.92
5.00 -4.00
-3.52
0.00 -6.00
10000 11000 11500 11700 11800 11900 12000 12100 12200 12300 12500 10000 11000 11500 11700 11800 11900 12000 12100 12200 12300 12500
Call Put Call Put
BANKNIFTY OPTION OI CONCENTRATION (IN QTY) (MONTHLY) CHANGE IN BANKNIFTY OPTION OI (IN QTY) (MONTHLY)
In 10,000 In 10,000
8.00
39.28
45.00
5.91
40.00 6.00
3.15
30.67
2.92
35.00 4.00
2.19
1.36
1.34
1.24
1.00
30.00
23.98
2.00
0.02
0.01
20.65
20.35
25.00
0.00
16.99
0.00
-0.03
-0.14
20.00
-0.23
-0.49
-0.67
-0.84
-0.93
11.93
-2.00
-1.32
10.49
15.00
9.56
-2.34
9.32
9.32
9.21
-4.00
7.12
10.00
4.78
4.50
4.14
3.64
-6.00
1.94
1.88
1.83
1.19
1.06
5.00
-7.18
-6.86
0.00 -8.00
27500 29000 29500 30000 30500 31000 31500 31800 32000 32500 33000 27500 29000 29500 30000 30500 31000 31500 31800 32000 32500 33000
Call Put Call Put
8
DERIVATIVES
SENTIMENT INDICATOR (NIFTY) SENTIMENT INDICATOR (BANKNIFTY)
12-Dec 11-Dec 10-Dec 09-Dec 06-Dec 12-Dec 11-Dec 10-Dec 09-Dec 06-Dec
DISCOUNT/PREMIUM 56.85 28.00 41.40 29.20 34.20 DISCOUNT/PREMIUM 51.55 57.50 66.20 81.00 76.75
COST OF CARRY% 0.83 0.81 0.81 0.79 0.76 COST OF CARRY% 0.83 0.81 0.81 0.79 0.76
PCR(OI) 1.35 1.23 1.19 1.24 1.22 PCR(OI) 1.28 1.14 1.11 1.12 1.14
PCR(VOL) 1.25 0.99 0.91 1.02 1.11 PCR(VOL) 1.22 0.71 0.79 0.93 0.91
A/D RATIO(NIFTY 50) 5.38 1.68 0.28 1.00 0.19 A/D RATIO(BANKNIFTY) All Up 3.00 0.33 0.57 0.20
A/D RATIO(ALL FO STOCK)* 4.88 2.20 0.21 1.65 0.16 A/D RATIO(ALLFO STOCK)# All Up 3.67 0.27 0.86 0.17
IMPLIED VOLATILITY 11.74 12.01 13.26 12.11 12.08 IMPLIED VOLATILITY 15.73 16.73 16.56 16.06 16.25
VIX 13.35 13.38 14.29 14.60 14.60 VIX 13.35 13.38 14.29 14.60 14.60
HISTORICAL VOLATILITY 12.04 12.17 12.36 12.32 12.69 HISTORICAL VOLATILITY 19.34 18.93 19.47 19.94 20.56
*All Future Stock #All Future Stock
FII’S ACTIVITY IN INDEX FUTURE FII’s ACTIVITY IN DERIVATIVE SEGMENT
In Cr. In Cr.
6549.69
720
800
7000
600
6000
400
240
5000
200
2533.09
15
4000
0
1435.09
3000
1389.27
1200.19
-20
-200
-142
2000
-400
-307
1000
44.7
-368
-600 0
-665
-800
-432.39
-449.33
-1000
-736
-759
-788.62
-833.62
-1000 -2000
29-Nov 02-Dec 03-Dec 04-Dec 05-Dec 06-Dec 09-Dec 10-Dec 11-Dec 12-Dec 29-Nov 02-Dec 03-Dec 04-Dec 05-Dec 06-Dec 09-Dec 10-Dec 11-Dec 12-Dec
Top Long 10 Buildup Top 10 Short Buildup
NAME LTP % Price Change Open interest %OI Chng NAME LTP % Price Change Open interest %OI Chng
NMDC 114.20 3.30% 19548000 17.53% UJJIVAN 330.40 -6.60% 9524800 28.77%
EXIDEIND 185.10 1.31% 9460800 13.57% APOLLOHOSP 1389.20 -5.43% 1627500 24.33%
L&TFH 115.05 2.40% 26500500 12.15% YESBANK 40.15 -25.72% 232306800 11.90%
TATAMOTORS 173.80 7.55% 61401000 10.51% BHEL 45.40 -2.99% 54855000 6.43%
MANAPPURAM 173.25 9.13% 16854000 9.68% MARICO 332.65 -2.96% 12782900 5.86%
DISHTV 13.55 7.97% 116382000 9.58% DABUR 458.50 -1.29% 12810000 5.42%
MUTHOOTFIN 716.05 2.98% 4311000 7.52% HAVELLS 653.70 -1.63% 5377000 5.27%
HDFCBANK 1269.75 1.51% 27122500 6.67% APOLLOTYRE 165.85 -3.55% 9114000 4.04%
IGL 408.35 1.59% 7103250 6.08% ACC 1438.90 -3.05% 3269200 3.42%
CIPLA 461.75 1.15% 13376000 5.61% HEROMOTOCO 2341.90 -1.05% 3959200 3.01%
**The highest call open interest acts as resistance and highest put open interest acts as support.
# Price rise with rise in open interest suggests long buildup | Price fall with rise in open interest suggests short buildup
# Price fall with fall in open interest suggests long unwinding | Price rise with fall in open interest suggests short covering
9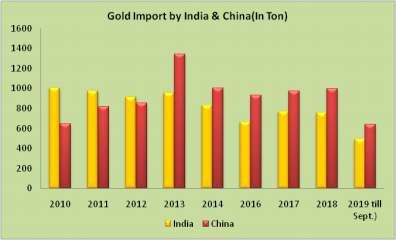
SPICES                                                                               BULLIONS
Turmeric futures (Mar) is expected to trade higher towards 6500-6600, taking        Bullion counter may trade with mixed bias as US China trade war to guide its
support near 6000 levels. The report that the Andhra Pradesh Government             sentiments. Recently fresh comments by US President Trump stated that
might declare soon a Minimum Support Price for turmeric has lifted the              US was very close to nailing down a deal with china, making the riskier
sentiments of the counter. However, much of the turmeric is in poor condition,      assets more attractive putting pressure on the safe have asset. Last
so traders are purchasing almost all medium-quality turmeric and a few bags         week Fed held interest rates steady and signalled borrowing costs will not
of the good stuff from the arrivals. At the Erode Turmeric Merchants
                                                                                    change anytime soon, with moderate economic growth and historically low
Association Sales yard, finger turmeric was sold at Rs.5,556-Rs.6,449 a
                                                                                    unemployment expected to persist through the 2020 presidential election. In
quintal, while the root variety went for Rs.,5329 to Rs.6,116 a quintal. Jeera
futures (Jan) may consolidate and trade sideways in the range of 15700-16200        the meantime the White House has agreed to suspend some tariffs on Chinese
levels. The market participants are avoiding taking long positions despite the      goods and reduce others in return for Beijing’s pledge to hike purchases of
fact it is trading near multi-months low, as they are keeping an eye on the         U.S. farm products in 2020. Gold may remain in narrow range of 37800-38600
sowing progress in the major growing areas. According to traders, jeera             whereas on the other hand silver may recover towards 46000 while taking
production is expected to increase this season. In fact, till December 9, its       support near 43500. Prime Minister Boris Johnson has won the election and put
sowing in Gujarat has increased to 2,77,017 hectares as compared to 2,68,368        the U.K. on track to leave the European Union next month after the biggest
hectares during last season. In Rajasthan, it is reported that the farmers are      shift in British political allegiances for decades. For Johnson, a big majority
not showing much interest in sowing jeera and shifting towards wheat &              would mark the culmination of an extraordinary rise to power after he led the
barley. Due to the presence of cloudy humidity with more moisture in the air,       pro-Brexit campaign three years ago. As expected first, ECB kept the interest
farmers have taken less interest in sowing of cumin crop. There is high             rate unchanged and also lowered their growth forecast for the next year.
probability that cardamom futures (Jan) may surpass the previous weekly high
                                                                                    Surging gold prices in India are keeping customs officials on their toes as there
near 3136 & move higher to test 3200-3300 levels. In the recent times, there is
                                                                                    has been a jump in the smuggling of gold into India from China, Taiwanand
surge in buying in anticipation of possible production drop in the coming
months, as winter started catching up in the growing regions.                       Hong Kong.

                                                                                       ENERGY COMPLEX
   OIL AND OILSEEDS
                                                                                    Crude oil prices may remain on upside path as the United States and China
Soybean futures (Jan) has the potential to reach for its previous high of 4309
                                                                                    moved closer to a resolution to the 18-month trade war between the world’s
and if surpasses then may even go higher towards 4370 levels. The USDA in its
latest report has lowered India’s soybean production estimate for marketing         two biggest economies that have raised big questions about global demand for
year (MY) 2019/20 (Oct-Sept) to 9 million metric tons (MMT) on 11.3 million         crude. Crude oil may move upwards towards 4350-4400 while taking support
hectares to indicate poor yield due to weather-induced stress during the peak       near 4100. Meanwhile International Energy Agency report pointed to future
reproductive and maturity stage. Madhya Pradesh and Maharashtra will                pressure on oil prices, predicting a sharp rise in global inventories despite an
produce 28 percent and 24 percent less soybeans compared to last season             agreement by the Organization of the Petroleum Exporting Countries (OPEC)
(2018). Currently, daily average arrivals of soybean across the country are         and its allies to deepen output cuts. Elsewhere, Norway’s oil output in
400,000-500,000 bags (1 bag = 100 kg), nearly half of what was seen previous        November hit a 32-month high at 1.71 million barrels per day, the Norwegian
year. Mustard futures (Jan) is most likely to trade with an upside bias in the      Petroleum Directorate (NPD) stated last week. The U.S. is on track to become
range of 4400-4530 levels. With planting still in progress, acreage in Rajasthan    a net exporter of crude and fuel for the first time on record on an annual basis
may fall but in other states, it is likely to rise. Higher-than-required soil       in 2020, the EIA said, due to a production surge that has dramatically reduced
moisture due to higher monsoon rains in Rajasthan would weigh on sowing.            its dependence on foreign oil. Weather related developments to keep natural
The sowing progress shows that across the country mustard has been sown             gas on volatile path as prices can take support near 155-160 range and recover
over 5.5 million hectares, which is about 80% of total area. Last year, the total   towards 170-175 in near term. Demand will increase this week as cooling
sown area was at 6.9 million hectares. Soy oil futures (Jan) is seen taking         returns across many regions of the US, coldest across the Midwest and
support near 850 levels & maintain its uptrend in days to come. While, CPO          Northeast as lows of -0s to 20s return, along w/areas of rain and snow. The
futures (Jan) is expected to hold above the support level near 713 and              Department of Energy reported that working gas in storage was 3,518 Bcf as of
continue to make new life time high. The slew of government measures to             December 6, 2019. This represents a net decrease of 73 Bcf from the
reduce the edible oil import bill of Rs 70,000 crores & apprehension of a supply    penultimate week.
shortage in the domestic market following lesser crop of soybean may keep
the prices elevated.                                                                   BASE METALS
   OTHER COMMODITIES                                                                Base metal counter may trade with positive path. Copper may take support
                                                                                    near 430 levels and recover towards 450 levels. Declining stocks on the LME
Cotton futures (Dec) is expected to break the strong support near 18950 & may
                                                                                    were supporting copper prices. Headline inventories fell to their lowest since
plunge towards 18800 levels. This season the supply side is heavier on account
of higher crop at 354.5 lakh bales (each of 170 kg) along with larger imports. As   April at 181,700 tonnes. Overall, the copper market should see a deficit of
the latest statistics, import shipments from October 1, 2019, to November 30,       320,000 tonnes this year but this will flip into a surplus of 281,000 tonnes in
2019, which have reached Indian ports, are estimated at 5 lakh bales, while         2020, the International Copper Study Group stated. Meanwhile in China, data
the balance 20 lakh bales is estimated to arrive in the ports between               over the weekend showed that nation’s copper imports rose 12.1 percent in
December 1, 2019, and September 30, 2020. The scenario of cotton in the             November to 13-month high at 4,83,000 tonnes versus October’s 4,31,000
international market is also bleak as U.S. China trade dispute remains a            tonnes. The rise in imports comes on the back of unexpected improvement in
central source of uncertainty for the global cotton market. Statements from         factory activity last month. Meanwhile, lead may remain sideways as it can
the U.S. suggesting that the dispute could linger on beyond the (November)          move in the range of 150-158 levels. Zinc may recover towards 188 levels
2020 elections, raise the possibility that this uncertainty could continue to       while taking support near 181 levels. Nickel prices can move with upside path
dominate the market for some time into the future. Chana futures (Jan) may          as it may recover towards 1060 levels while taking support near 1000 levels.
witness selling pressure facing resistance near 4500 levels since past many         LME on-warrant nickel inventories, or those available to the market, rose to a
weeks. The news that the Centre has asked states to place demand for                2-1/2-month high at 67,248 tonnes. Aluminium prices can trade on mixed path
subsidised pulses available in Centre’s buffer stock may bring down the             in range of 131-138 levels. LME headline aluminium stocks jumped to their
counter to 4290 levels. It is reported that the centre has a buffer stock of        highest since April 2018 at 1.33 million tonnes, and the spread between the
around 12 lakh tonnes. The upside moves in castor seed futures (Jan) is             cash and three-month contract flipped to a discount of $8.75 a tonne after
expected to face resistance near 4350 levels. The reason being is that the
                                                                                    mostly holding in the premium zone for around a month. Almost 394,000
fresh arrivals have started hitting the spot markets of Gujarat & is priced at
                                                                                    tonnes of aluminium have been warranted in the LME warehouse system over
780-790 rupees per 20 kg, down 22% from the year-ago period, owing to high
moisture content in the crop, at 10-12%.                                            the last four weeks, and the headline total has jumped from 940,500 tonnes to
                                                                                    1,288,150.

                                                                                                                                                                 10
TREND SHEET
EXCHANGE COMMODITY CONTRACT CLOSING DATE TREND TREND RATE TREND SUPPORT RESISTANCE CLOSING
PRICE CHANGED CHANGED STOP/LOSS
NCDEX SOYABEAN JAN 4266.00 15.10.19 UP 3621.00 4180.00 - 4150.00
NCDEX JEERA JAN 15820.00 15.10.19 Down 16460.00 - 16350.00 16500.00
NCDEX REF.SOY OIL JAN 864.40 08.08.19 UP 741.30 825.00 - 820.00
NCDEX RMSEED JAN 4468.00 14.10.19 UP 4105.00 4330.00 - 4300.00
NCDEX CHANA JAN 4363.00 16.10.19 UP 4362.00 4320.00 - 4300.00
NCDEX GUARSEED JAN 4002.00 31.10.19 Sideways 4016.00 3950.00 4210.00 -
NCDEX COCUD JAN 2041.00 08.11.19 Down 2280.00 - 2070.00 2100.00
MCX CPO DEC 731.40 08.08.19 UP 528.00 695.00 - 690.00
MCX MENTHA OIL DEC 1301.40 21.01.19 Down 1551.90 - 1330.00 1335.00
MCX SILVER MAR 43926.00 12.12.19 Down 43926.00 - 44500.00 44650.00
MCX GOLD FEB 37544.00 07.10.19 Sideways 38470.00 37500.00 38500.00 -
MCX COPPER DEC 441.95 05.12.19 Sideways 430.00 425.00 445.00 -
MCX LEAD DEC 153.20 26.09.19 Sideways 156.00 150.00 156.00 -
MCX ZINC DEC 182.70 30.07.19 Sideways 194.00 178.00 189.00 -
MCX NICKEL DEC 1020.70 16.10.19 Down 1235.00 - 1045.00 1050.00
MCX ALUMINIUM DEC 133.50 26.09.19 Down 144.80 - 138.00 140.00
MCX CRUDE OIL DEC 4200.00 24.09.19 Sideways 4194.00 3900.00 4300.00 -
MCX NATURAL GAS DEC 163.30 25.11.19 Sideways 191.00 156.00 180.00 -
Closing as on 12.12.19
TECHNICAL RECOMMENDATIONS
GOLD MCX (FEB) contract closed at Rs. 37544.00 on 12th Dec’19. The contract made its
high of Rs. 40806.00 on 04th Sep’19 and a low of Rs. 36098.00 on 31st Jul’19. The 18-day
Exponential Moving Average of the commodity is currently at Rs. 37820.13. On the daily
chart, the commodity has Relative Strength Index (14-day) value of 41.006.
One can sell below Rs. 37350 for a target of Rs. 36400 with the stop loss of Rs. 37825.
NICKEL MCX (DEC) contract closed at Rs. 1020.70 on 12th Nov’19. The contract made its
high of Rs. 1245.60 on 11th Oct’19 and a low of Rs. 961.00 on 10th Dec’19. The 18-day
Exponential Moving Average of the commodity is currently at Rs. 1029.39. On the daily
chart, the commodity has Relative Strength Index (14-day) value of 42.200.
One can buy near Rs. 1010 for a target of Rs. 1080 with the stop loss of Rs. 975.
RMSEED NCDEX (JAN) contract was closed at Rs. 4468.00 on 12th Dec’19. The contract
made its high of Rs. 4499.00 on 13th Dec’19 and a low of Rs. 4230.00 on 07th Nov’19. The
18-day Exponential Moving Average of the commodity is currently at Rs. 4387.87. On the
daily chart, the commodity has Relative Strength Index (14-day) value of 75.916.
One can sell below Rs. 4460 for a target of Rs. 4300 with the stop loss of Rs 4540.
11NEWS DIGEST WEEKLY COMMENTARY
Ÿ The Centre has partially restored the merchandise In the week gone by, Bullion counter ended with weak bias as optimism regarding US China trade
export of India scheme (MEIS) incentive much to the deal kept prices under pressure. Last week Federal Reserve stood pat on interest rates and
relief of the spice exporters of the country, whose signaled moderate economic growth for next year. Governor Powell mentioned that the US
margins were hit after its discontinuance from August. economic outlook remains favorable despite global developments and ongoing risks, he
They have decided to extend it till December 31. also mentioned that as long as the economic data remains broadly consistent with this
outlook the current stance of monetary policy is likely to remain appropriate. US tariffs on
Ÿ The total shipment of soymeal has declined over 70% to Chinese imports loomed with no phase one deal remains in sight. Gold took support near 37450
1.13 lakh tonnes in oil year October and November 2019 while silver took support near 44400. Base metals registered gains last week on falling
as compared to 4.57 lakh tonnes in previous year record inventories. Copper prices rose to above 444 a five-month high on hopes that the US would
in the same period of time. - The Soybean Processors delay imposing more trade tariffs on goods from China, which would signal a detente in the
Association of India dispute that has sapped metals demand. The United States has reached a "phase-one" trade
Ÿ The Cotton Association of India (CAI) has retained its deal in principle with China, a source briefed on talks between the two nations stated last week.
Nickel managed to witness recovery from five-month lower levels as took support at near 960
cotton production estimate at 354.5 lakh bales in its
and recovered above 1015 as downtrend was overdone given an export ban on ore from
latest November forecast for the 2019-20 season, same Indonesia from 2020 is expected to tighten the market. LME nickel on-warrant inventories
as October. material not earmarked for delivery soared by 52% in one day to 102,036 tonnes, the highest
Ÿ Malaysia's production also dropped 14.35 percent since Aug. 29, LME data showed. Natural gas recovered last week as it took support near 155-157
month-on-month to 1.54 million tons & inventories fell range and recovered towards 164. U.S. Crude oil traded on sideways path. Prices got some
4.08 percent to 2.26 million tons in November from the support after OPEC monthly report showing a supply deficit next year, suggesting market is
previous month. - Malaysian Palm Oil Board tighter than previously thought - even before latest pact with other producers to curb
supply takes effect. U.S. crude stockpiles rose unexpectedly last week, while gasoline and
Ÿ The U.S Federal Reserve held interest rates steady and distillate inventories jumped sharply higher. Crude inventories rose 822,000 Bpd with
indicated that no action is likely next year amid expectations for a 2.8 Mbpd drop. At 447.9 million barrels, crude stocks were about 4% above
persistently low inflation. the five-year average for this time of year.
Ÿ Jiangxi Copper Co, one of China’s biggest copper The oilseeds counters continued to rule and scale higher on persistent demand from the
producers, stated that it will receive “financial stockiest apprehending of a supply shortage in the domestic market following Kharif crop
assistance” to the tune of 1.5 billion yuan from its damage, talks that the Centre is mulling imposition of quantitative restriction on imports of all
parent to repay loans and cut financing costs. kind of edible oils and a sharp jump in the international market. The news that U.S. President
Donald Trump signed off on a trade deal with China that would delay a new round of tariffs that
Ÿ Mines across South Africa shut down after flash flooding was to be put in place on Dec. 15 lifted the sentiments of the market participants, those were
triggered the most severe power blackouts in more than facing the heat of the 17-month-old trade war. Turmeric witnessed a sharp bounce back on the
a decade, forcing major miners Harmony Gold, Impala news that the Andhra Pradesh Government might declare a Minimum Support Price (MSP). On
Platinum, and Sibanye-Stillwaterto cut output. the flip side, guar complex continued to descend amid lower demand from the oil drilling
Ÿ Chinas imports of unwrought copper increased to the industries. Chana also decline on the back of the news that the Centre is about to take various
highest since September 2018. measures to pause the rising prices of pulses.
NCDEX TOP GAINERS & LOSERS (% Change) MCX TOP GAINERS & LOSERS (% Change)
7.00% 4.00%
6.37% 3.43%
6.00%
3.00%
2.34%
5.00%
2.00%
4.00% 1.32%
3.27% 1.11% 1.09%
3.11%
2.84% 1.00%
3.00% 2.61%
2.00% 0.00%
-
-0.34%
1.00% -0.50% -0.46%
-1.00%
0.00%
-2.00%
-0.50%
-1.00%
-3.00% -2.80%
-2.00%
-1.93%
-2.20%
-2.55% -2.48%
-3.00% -4.00%
TURMERIC CPO PADDY SOYABEAN COCUD GUARGUM CHANA GUAR SEED MOONG JEERA CPO NICKEL RBD KAPAS BRASS NATURAL GOLD MINI ZINC MINI CARDAMOM CRUDE OIL
BASMATI PALMOLEIN GAS MINI
WEEKLY STOCK POSITIONS IN WAREHOUSE (NCDEX) WEEKLY STOCK POSITIONS IN WAREHOUSE (MCX)
COMMODITY UNIT 05.12.19 11.12.19 DIFFERENCE COMMODITY UNIT 04.12.19 11.12.19 DIFFERENCE
QTY. QTY. QTY. QTY.
CASTOR SEED MT 35608 35027 -581 ALUMINIUM MT 5946.68 5015.13 -931.55
CHANA MT 2319 4434 2115 COPPER MT 6284.61 6027.34 -257.27
COCUD MT 6530 11727 5197 COTTON BALES 4475.00 4900.00 425.00
CORIANDER MT 3476 3676 200
GOLD KGS 452.00 417.00 -35.00
GUARGUM MT 8600 8491 -109
GOLD MINI KGS 79.20 65.20 -14.00
GUARSEED MT 13470 14134 664
GOLD GUINEA KGS 5.70 5.70 0.00
JEERA MT 821 560 -261
MAIZE (KHARIF) MT 306 810 504 LEAD MT 820.44 820.44 0.00
RM SEED MT 11990 11990 0 MENTHA OIL KGS 164265.45 164265.45 0.00
SOYBEAN MT 23443 29394 5951 NICKEL MT 49.07 49.07 0.00
TURMERIC MT 1641 1616 -25 SILVER (30 KG Bar) KGS 17986.32 17990.53 4.21
WHEAT MT 1225 1225 0 ZINC MT 471.90 406.53 -65.37
12COMMODITY
SPOT PRICES (% change) Gold Import of India & China In 2019
• According to World Gold Council, the global consumer demand for gold in the July-
September quarter of 2019 shrank 28 per cent to 611 tonnes, from a year ago due to factors
GUR (MUZAFFARNGR) 12.47 including stronger dollar, the rising US stock market, signs of a détente in the US-China trade
friction and of course, enervated demand in major markets such as India and China.
COTTON SEED OIL CAKE (AKOLA) 5.96 • The consumer demand for gold from India in the July-September quarter fell about 32 per
cent from a year ago to 124 tonnes, its lowest level in 13 quarters. Demand in India was hurt
by elevated prices of the yellow metal, dampened consumer sentiment due to the economy
CRUDE PALM OIL (KANDLA) 4.54
slowing, and an increase in import duty in July from 10 per cent to 12.5 per cent.
• China’s demand is also contracted 25 per cent to 199 tonnes. However, the overall consumer
SOYABEAN (INDORE) 3.04
demand for gold from China was 61 per cent higher compared to that from India in the July-
September quarter.
TURMERIC (NIZAMABAD) 2.78 • Clearly, in the July-September quarter the elevated prices of the yellow metal pulled
demand down to the level last seen in April-June 2016. Gold prices had soared from Rs.
GUAR GUM (JODHPUR) 1.43 34,000 per 10 grams at the end of June 2019 to Rs. 39,000 by the first week of September.
• China’s demand, too, was dented by soaring prices and weaker consumer sentiment.
CORIANDER (KOTA) 1.00
However, the rise in prices of gold in China was a slower 8.7 per cent compared to 15.6 per
cent in India.
• Overall demand in the current calendar year is anticipated to settle much lower for India at
JEERA (UNJHA) 0.94
about 700 tonnes, notwithstanding wedding season buying in North India.
• In the first nine months of the current calendar, consumer demand for gold from India was at
GUAR SEED (JODHPUR) 0.82
496 tonnes, while China stood at 639 tonnes. This was about five per cent and 14 per cent
lower, respectively, compared to the same period last year.
COTTON (KADI) 0.63 • The demand for gold for jewellery from China was over 20 per cent higher than from India
for the first nine months of the current calendar. China’s demand for gold for jewellery was
PEPPER MALABAR GAR (KOCHI) 0.63 estimated at 476 tonnes, compared with 396 tonnes from India.
• For the nine months of the current calendar year, India’s demand for gold as coins and bars
MUSTARD (JAIPUR) 0.54
was 38 per cent lower at 100 tonnes compared to 163 tonnes from China. India’s demand for
gold bars and coins fell to its lowest January-March 2009.
• China’s official holding of gold, with the People’s Bank of China, is more than three times
SUGAR (KOLKATA) 0.14
the holding of India, kept with the Reserve Bank of India. The WGC report estimates that
China held 1,948 tonnes of gold as of September 2019, as the People’s Bank increased its
BARLEY (JAIPUR) 0.05 holding of the metal every month, beginning December 2018.
• In comparison, India held 618 tonnes, of which 40.5 tonnes was acquired in 2018. China’s
WHEAT (DELHI) -0.07 gold holding accounts for just about 3 per cent of its reserves, and in contrast, India’s hoard
is about 7 per cent of its reserves.
RAW JUTE (KOLKATA) -1.66 • According to GOI sources, India imported 71 tonnes of gold in November, compared with 40
tonnes in October and down 16% from November 2018
-4.00 -2.00 0.00 2.00 4.00 6.00 8.00 10.00 12.00 14.00
WEEKLY STOCK POSITIONS IN LME (IN TONNES)
COMMODITY STOCK POSITION STOCK POSITION DIFFERENCE
05.12.19 11.12.19
ALUMINIUM 1274850 1303975 29125
COPPER 202950 185200 -17750
NICKEL 68976 83520 14544
LEAD 67125 67400 275
ZINC 59075 57800 -1275
PRICES OF COMMODITIES IN LME/ COMEX/ NYMEX (in US $)
COMMODITY EXCHANGE CONTRACT 06.12.19 12.12.19 CHANGE%
ALUMINIUM LME CASH 1750.50 1755.00 0.26
COPPER LME CASH 5867.50 6097.00 3.91 Source: WGC
LEAD LME CASH 1881.00 1920.00 2.07
INTERNATIONAL COMMODITY PRICES
NICKEL LME CASH 13420.00 13810.00 2.91
COMMODITY EXCHANGE CONTRACT UNIT 06.12.19 12.12.19 CHANGE(%)
ZINC LME CASH 2250.00 2229.00 -0.93
Soybean CBOT JAN Dollars Per Bushel 8.89 8.98 1.01
GOLD COMEX FEB 1465.10 1472.30 0.49
SILVER COMEX MAR 16.60 16.95 2.13 Soy oil CBOT JAN Cents per Pound 31.22 32.23 3.24
LIGHT CRUDE OIL NYMEX JAN 59.20 59.18 -0.03 CPO BMD FEB MYR per MT 2858.00 2891.00 1.15
NATURAL GAS NYMEX JAN 2.33 2.33 -0.26 Cotton ICE MAR Cents per Pound 65.00 67.17 3.34
13CURRENCY
Currency Table News Flows of last week
Currency Pair Open High Low Close 12th DEC FED leaves rates on hold, forecasts show no change through 2020.
USD/INR 71.4525 71.4525 70.65 70.92 12th DEC IIP contracts for third straight month by 3.8% in October.
EUR/INR 79.09 79.09 78.65 78.9750
12th DEC India’s November inflation spikes to 3-year high at 5.54%.
GBP/INR 93.9525 94.2650 93.1075 93.3950
12th DEC US getting very close to a big deal with China, Trump tweets.
JPY/INR 65.8350 65.84 65.14 65.3625
(* NSE Currency future, Source: nseindia.com, Open: Monday 9.00 AM IST, Close: Thursday (5.00 PM IST) 12th DEC UK election exit polls project victory for Boris Johnson’s party.
Market Stance Economic gauge for the next week
Indian Rupee gained more than a percent amid substantial improvement in the Date Currency Event Previous
Trade War sentiment ahead of tariff deadline on 15th December. At the same time
Chinese renminbi rose the most since turmoil faced in August. Meanwhile raising of 16th DEC EUR Flash Manufacturing PMI 46.9
dollar flows from Indian Corporate lifted the domestic unit. Stake sale of 25.1% 16th DEC EUR Flash Services PMI 51.9
from Adani Electricity to Qatar Investment Authority also triggered dollar to fell 16th DEC GBP Flash Manufacturing PMI 48.9
against rupee. Recent development from tariff front is that both the US and China
were closing in on a limited trade deal including a reduction in existing tariffs that 16th DEC GBP Flash Services PMI 49.3
have weighed down the world’s two largest economies for months. Hopes for such a 16th DEC USD Flash Manufacturing PMI 52.6
pact pushed US stocks to record highs on Thursday, as investors cheered the 17th DEC GBP Average Earnings Index 3m/y 3.6%
imminent easing of tensions between Washington and Beijing. The biggest action
seen this week is Sterling. Boris Johnson is heading for 10 Downing Street to chair 18th DEC EUR German IFO Business Climate 95.0
the PMship. The pound shot higher amid an emphatic victory for the Conservative 18th DEC GBP CPI y/y 1.5%
party in the UK general election after an exit poll indicated Boris Johnson was on 19th DEC JPY Monetary Policy Statement -
course to win an overall majority in parliament. Sterling climbed 2.7 per cent to
$1.351, its highest level against the US dollar since May 2018, putting it on course for 19th DEC GBP Core PPI m/m -0.1%
one of its biggest ever one-day gains. The UK currency reached its highest level against 19th NOV GBP Official Bank Rate 0.75%
the euro since December 2016, hitting €1.207. Going forward next week, Flash PMIs 20th NOV GBP Current Account -25.2B
from Euro zone along with tariff roll-out will guide the major pairs. Rise in Indian rupee
likely to get capped subject to RBI intervention to scale-up dollar reserves. 20th NOV USD Personal Spending m/m 0.3%
USDINR is likely to take support near 70.20 and move higher towards 70.90 in 20th DEC INR Foreign Exchange Reserves 13-DEC -
the next week.
Technical Recommendation USD/INR EUR/INR
USD/INR (DEC) contract closed at 71.92 on 12th Dec’19. The contract made its EUR/INR (DEC) contract closed at 78.9750 on 12th Dec’19. The contract made its
high of 71.4525 on 9th Dec’19 and a low of 70.65 on 12th Dec’19 (Weekly Basis). high of 79.09 on 9th Dec’19 and a low of 78.65 on 11th Dec’19 (Weekly Basis). The
The 14-day Exponential Moving Average of the USD/INR is currently at 71.40. 14-day Exponential Moving Average of the EUR/INR is currently at 79.14.
On the daily chart, the USD/INR has Relative Strength Index (14-day) value of On the daily chart, EUR/INR has Relative Strength Index (14-day) value of 43.24.
30.98. One can buy at 70.30 for the target of 70.90 with the stop loss of 70. One can buy at 78.75 for a target of 79.35 with the stop loss of 78.45.
GBP/INR JPY/INR
GBP/INR (DEC) contract closed at 93.3625 on 12th Dec’19. The contract made its JPY/INR (DEC) contract closed at 65.3625 on 12th Dec’19. The contract made its
high of 94.2650 on 9th Dec’19 and a low of 93.1075 on 11th Dec’19 (Weekly Basis). high of 65.84 on 9th Dec’19 and a low of 65.14 on 12th Dec’19 (Weekly Basis). The
The 14-day Exponential Moving Average of the GBP/INR is currently at 93.26. 14-day Exponential Moving Average of the JPY/INR is currently at 65.74.
On the daily chart, GBP/INR has Relative Strength Index (14-day) value of 58.51. On the daily chart, JPY/INR has Relative Strength Index (14-day) value of 37.26.
One can buy above 95.50 for a target of 96.10 with the stop loss of 95.20. One can buy at 64.20 for a target of 64.80 with the stop loss of 63.90.
14You can also read