ARE THE BRAKES ON CARGO CRIME IN EMEA? - INCIDENT INFORMATION SERVICE (IIS) CARGO CRIME DATA FOR THE NETHERLANDS - Q1 2018 - Politie.nl
←
→
Page content transcription
If your browser does not render page correctly, please read the page content below

Transported Asset Protection Association

                                                  ARE THE BRAKES ON
                                                CARGO CRIME IN EMEA?
                                                         INCIDENT INFORMATION SERVICE (IIS)
                                           CARGO CRIME DATA FOR THE NETHERLANDS - Q1 2018
                                                                  EUROPE, MIDDLE EAST & AFRICA (EMEA) REGION
THEBIGPICTURE
Incident rates and loss values fall year-on-year – but is this the
start of a sustainable downturn in cargo crime in EMEA?
Cargo crime intelligence reported to the EMEA that dominated the Q1 2017 IIS Report statistics all saw
Transported Asset Protection Association’s reductions in recorded freight thefts in the TAPA IIS database.
And, significantly, these are the three countries which in
(TAPA) Incident Information Service (IIS) in the recent years have seen the strongest level of cooperation
first three months of 2018 may give rise to and intelligence sharing by law enforcement agency partners.
cautious optimism that thefts from supply chains Year-on-year analysis for recorded incidents shows:
in some countries in the Europe, Middle East &
• 382 cargo crimes in the United Kingdom in Q1 2018,
Africa (EMEA) region are declining. down 8.4% on the 407 incidents in the same three THEFT BY PRODUCT - Q1 2018
Data for Q1 2018 provides a series of positive indicators, months of 2017
*Number of incidents % of total
although whether this is merely a one quarter phenomenon • 57 crimes in the Netherlands in this latest reporting
or represents a sustainable shift in improved supply chain Unspecified 171 27.6%
period, 69.6% lower than the 188 recorded freight losses a
security remains to be seen. year ago Food & Drink 101 16.4%
Miscellaneous 68 11.0%
Adding weight to the more optimistic outlook is the fact • 34 incidents in Sweden – down 29.1% versus the 48 crimes
that in the first three months of 2018, the three countries in reported to the IIS database in Q1 2017 Clothing & Footwear 47 7.6%
Car Parts 36 5.9%
Furniture/Household Appliances 28 4.5%
A 12-MONTH PERSPECTIVE OF REPORTED CARGO CRIMES IN EMEA Tobacco 25 4.0%
Computers/Laptops 24 3.9%
Based on loss data reported to TAPA's Incident Information Service (IIS) in the EMEA region for the 12 months ending 31 March 2018 2018 2017 2016 Cosmetics & Hygiene 23 3.7%
302 Metal 21 3.3%
300 284
269 264 259 No Load 20 3.2%
247 255 257
250 247 244
244
233 210 215 207 229 216 Tools/Building Materials 16 2.5%
201
200 188 190 172
166 160 Tyres 15 2.4%
149
150 Pharmaceuticals 8 1.3%
100 Phones 5 0.8%
50 Bicycles 5 0.8%
0 Toys/Games 4 0.6%
APRIL MAY JUNE JULY AUGUST SEPTEMBER OCTOBER NOVEMBER DECEMBER JANUARY FEBRUARY MARCH
Sports Equipment 2 0.3%
% CHANGE % CHANGE % CHANGE % CHANGE % CHANGE % CHANGE % CHANGE % CHANGE % CHANGE % CHANGE % CHANGE % CHANGE
YoY +6% YoY 22.8% YoY -2.3% YoY +38.9% YoY -1% YoY +6.5% YoY +1.8% YoY +18.4% YoY -3.4% YoY -5.0% YoY -23.9% YoY -38.2% Cash 1 0.2%
TAPA EMEA - INCIDENT INFORMATION SERVICE - Q1 2018 REPORT 2
THE BIG PICTURE
Total losses reduced by nearly €17m over Q1 2017
89
6 7
Overall statistics for the EMEA region as a whole in the three 5
months ended 31 March 2018 show similar downward trends. 4
3
In 2016 and 2017, year-on-year Q1 incident data revealed 14
increases of 115.5% and 59.6% respectively. However, in the 13
12
first three months of this year, the 620 cargo thefts reported 11
10
to TAPA in the EMEA region represent a 12.5% drop in 2
recorded crimes compared to Q1 2017.
The total loss figure for the 69.4% of these Q1/18 crimes
reporting a value was €26,511,436, nearly €17 million lower
INCIDENT 1
than the corresponding figure a year ago of €43.4 million. Losses of €50,000-€100,000 down by 56.7% CATEGORY
The average loss for Q1 2018 incidents of €61,369 was also The downward trend in cargo losses was also reflected in the
-37.6% down year-on-year. value category between €50,000 and €100,000. In Q1 2017,
TAPA EMEA’s IIS was notified of 162 thefts from supply chains
Average loss values for major crimes more than in this loss range with a total value of €10,641,393. The
halved to €310,630 corresponding figures of 70 incidents and combined value of
While the number of major cargo crimes recorded in the €4,693,909 in Q1 2018 represented reductions of 56.7% and
quarter with a loss value of €100,000 or more rose 22.5% to 55.8% respectively.
49, the overall value of these crimes and average losses also Crimes reported in more countries in Q1/18
recorded sharp reductions. Altogether, the combined value of
TAPA did see a year-on-year increase in the number of % of all Q1 2018 incidents
products stolen in major crimes in Q1 2018 was €15,220,916,
producing an average loss of €310,630. This compares to countries reporting cargo crimes. Overall, incidents were 1 Theft from Vehicle 437 70.5% 8 Theft from Facility 10 1.6%
€27,325,088 and €683,127 respectively in Q1 of 2017. noted in 23 countries in Q1 2018 – up from 18 the year before 2 Theft from Trailer 66 10.6% 9 Robbery 7 1.1%
- including losses in seven countries that did not record any 3 Fraud 28 4.6% 10 Theft from Container 3 0.5%
The crime with the highest loss value in Q1/18 was the loss of cargo crimes in Q1/17; Bulgaria, Finland, Hungary, Ireland,
car parts from a truck while it was en route in Romania, which 4 Theft of Vehicle 25 4.0% 11 Truck Theft 3 0.5%
Latvia, Romania and Switzerland.
reported a loss value of €2,017,440. 5 Theft of Trailer 15 2.4% 12 Theft of Container 1 0.2%
This was one of two seven-figure Improved data sharing on cargo thefts in Russia meant it 6 Hijacking 12 1.9% 13 Theft from Train 1 0.2%
losses in the quarter. The other was the country to see the highest year-on-year growth in 7 Theft 11 1.7% 14 Clandestine 1 0.2%
also involved the thefts of car reported incidents – up 1,133% - to 37 in Q1 2018 versus just
parts – multimedia control three a year ago. The other three countries in the top seven
units and shock absorbers for recorded crimes – Germany, France and South Africa – all
– worth €1,900,000, which were saw their rates of incidents increase. Germany was the scene
stolen after a driver left his loaded of 25 newly-recorded freight thefts in this reporting period,
vehicle unattended on an industrial up from 19 in Q1/17, while in France, losses rose from 7 to 24
estate in the German state of North year-on-year, a rise of 242.8%. 13 crimes in South Africa were
Rhine-Westphalia over a weekend added to the IIS intelligence database, up from nine in the
in January. same period of last year.
Freight thefts were recorded in 23 countries in EMEA in Q1 2018 compared to 18 a year
ago. Of the top five countries, only Russia and Germany's figures increased over Q1/17
3 TAPA EMEA - INCIDENT INFORMATION SERVICE - Q1 2018 REPORT
THE BIG PICTURE
Seven countries accounted for 92.2% of all
Q1/18 incidents
Overall, the UK, Netherlands, Russia, Sweden, Germany,
France and South Africa accounted for 572 or 92.2% of all
recorded cargo crimes in the EMEA region in the first quarter
of 2018.
The UK remained well ahead of its neighbours in EMEA in
terms of its overall incident rate. Its 382 crimes in Q1 2018
represented 61.7% of all cargo theft reports in the region in
this period. The UK also saw the highest number of major
losses – 23 in total with a combined value of €5,111,918 and
an average of €222,257. 36% of all the incidents reported in
Germany involved losses in excess of €100,000, producing a
consolidated loss of €3,916,848. The average value of major Trucks were the target in over 90% of
crimes in Germany in Q1/18 was €435,205. criminal attacks on supply chains
Major thefts were recorded in 12 countries in EMEA versus As is now well established, products moving in supply chains 6
7 8
10 a year ago. continued to be most at risk when they are being transported 5
by trucks, with the statutory requirements for drivers to take
The rate of cargo crimes fell in each of the first three months 4
rest breaks and the lack of secure parking places – especially
of 2018 versus last year. January’s 244 incidents was 5% 10
in Europe – contributing significantly to the ease with which
lower than the figure for the first month of 2017, while in 9
many crimes are carried out. 3
February and March this year, the 216 and 160 new cargo
thefts entered into the IIS database represented year-on-year The majority of freight crimes in Q1 2018 involved Theft from
falls of 23.9% and 38.2% respectively. Vehicle incidents, although the 437 reports stating this type of
incident in this latest reporting period were 21.6% lower than
the 558 cases in this crime category in the opening three
2
LOCATION
TYPE
1
months of 2017.
Overall, TAPA’s Incident Information Service captured
intelligence on 14 different types of incidents in the first
three months of 2018. Theft from Trailer crimes, the second
most reported incident, rose from 31 to 66 year-on-year,
an increase of 112.9%, while all losses involving vehicles
accounted for over 90% of the Q1 2018 total.
Fraud was used in 28 or 4.6% of cargo thefts in the quarter,
mostly involving bogus transport companies using false
documentation to pick up loads. 75% of these crimes took
% of all Q1 2018 incidents
place in Russia.
1 Unsecured Parking 435 70.2% 6 Origin Facility 17 2.8%
2 En Route 46 7.5% 7 Destination Facility 11 1.7%
Although Theft from Vehicle crimes continued to be the most reported type of 3 Unknown 43 6.9% 8 Authorised 3rd Party Facility 6 0.9%
incident in TAPA's IIS database, they fell by 21.6% against the same period of 2017 4
5
Secured Parking
Services 3rd Party Facility
37
18
6.0%
2.9%
9
10
Maritime Transportation Facility
Railway Operation Facility
4
3
0.6%
0.5%
TAPA EMEA - INCIDENT INFORMATION SERVICE - Q1 2018 REPORT 4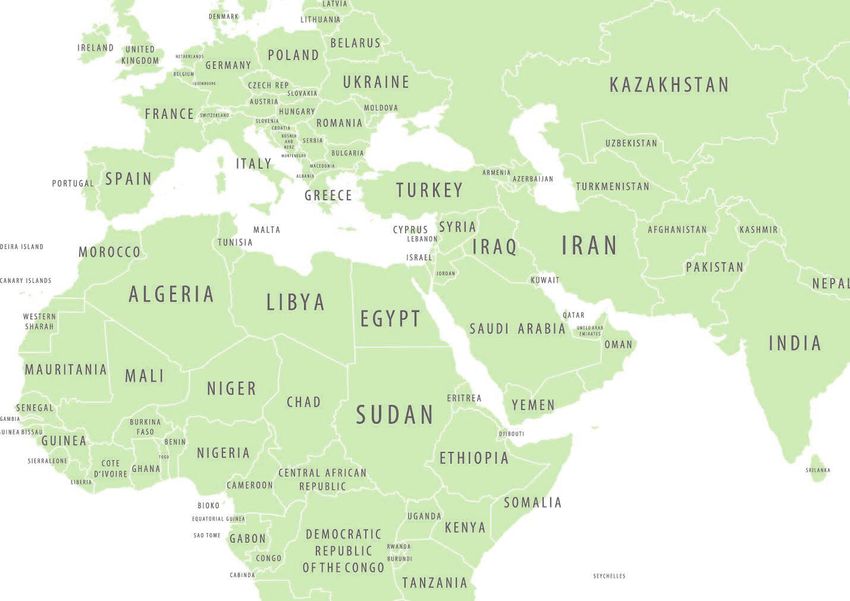
THE BIG PICTURE
Unsecured parking areas continued to pose the
greatest risk in Q1 2018
Encouraging the creation of a network of secure parking
sites across Europe remains one of TAPA EMEA’s strategic
priorities. Alongside the launch of its new Parking Security
Requirements (PSR) Security Standard, the Association has
also created a new membership category for Parking Place
Operators (PPO) and extended its Security Service Provider
membership to include Parking Booking Platform Operators
in an effort to engage more closely with parking sites, their
owners and customers. In 2018, as PPOs begin to adopt one
of the three levels of the PSR Standard, TAPA’s Manufacturer
and Logistics Service Provider members will be able to easily
identify these secure sites using the Association’s new online
tool for secure parking. This not only provides information in total – occurred when trucks were parked in unsecured
on TAPA-certified parking places, it also allows members locations, usually when drivers were required to take
to manage risk by overlaying cargo crime incident data on mandatory rest breaks in areas with no secure parking 3
4 56
intended transport routes. options. Even with the growing level of momentum behind
TAPA EMEA has also given its full support to the European the development of secure parking sites in Europe, building a
2
Commission’s ‘Study on Safe and Secure Parking Places sufficiently big network in key locations across the continent
for Trucks’ and will incorporate the EU Safe and Secure is going to take time. In the meantime, it will be those PPOs
9
Parking Manual requirements as a baseline into that meet the required security standards that will profit most 8
7
its Parking Security Requirements (PSR) when from the commercial benefits offered by a secure
the EC project is completed. The European parking market where demand far outweighs supply.
Commission’s commitment to develop
common security standards and a new
Attacks on vehicles while en route was one of the
types of location to record a sizeable increase
MODUS
rating system to guide parking owners
and users is widely regarded as one of
year-on-year, with incidents up 119% to 46. OPERANDI 1
the most significant initiatives so far in However, further evidence was also provided
the move to build a network of secure on the drop in the number of cargo thefts from
parking sites across Europe. facilities with Q1/17 vs. Q1/18 figures showing a
66.6% decline to 17 such crimes in the first three
In the meantime, drivers, trucks and cargo
months of 2018. Four incidents were recorded
loads continue to face the daily threat of
at Maritime Transportation Facility locations in
attacks from criminals operating across the
Durban in South Africa, Riga in Latvia, Grimsby
continent.
in the UK, and Madrid in Spain. Crimes were also
In Q1 2018, 70.2% of all the cargo crimes reported at Railway Operation Facility sites in
recorded by TAPA’s IIS – 435 incidents Germany and Italy. % of all Q1 2018 incidents
1 Intrusion 478 77.1% 6 Internal 8 1.3%
2 Unknown 82 13.3% 7 Deceptive Stop 3 0.5%
The EU is leading the drive for safe and secure parking places in Europe as incidents in unsecured 3 Deceptive Pick Up 21 3.4% 8 Forced Stop 2 0.3%
parking places continue to represent more that 70% of crime locations in the region 4 Deception Other 12 1.9% 9 Theft from Moving Vehicle 2 0.3%
5 Violent & Threat with Violence 12 1.9%
5 TAPA EMEA - INCIDENT INFORMATION SERVICE - Q1 2018 REPORT
THE BIG PICTURE

Crimes with a violent M.O. reduce year-on-year                      was attacked while en route across the Romanian/Bulgarian            As well as the big increase in the number of Food & Drink
                                                                    border on 16 March although, on this occasion, they were             thefts, the 25 crimes involving Tobacco represented a 56%
With high incident rates involving thieves cutting the tarpaulin    unsuccessful in reaching the cargo.                                  increase year-on-year, while losses of Car Parts rose 50% in
curtains and breaking open the rear doors of parked trucks,                                                                              Q1 2018.
Intrusion remained the most common type of criminal modus           Big rise in thefts of Food & Drink, Car Parts
operandi and was recorded in 478 or 77.1% of all freight thefts                                                                          TAPA EMEA members can search for more Q1 2018
                                                                    and Tobacco
in Q1 2018.                                                                                                                              intelligence in the Association’s online, password-protected
                                                                    Goods were recorded stolen in 17 TAPA IIS product categories         Incident Information service (IIS) database.
The number of Deceptive Pick-ups rose substantially from 1          in the first quarter of 2018, with the highest number of cases
to 21 year-on-year, almost entirely due to the increased level      involving thefts of Food & Drink; 101 in total, 16.4% of the first
of incident reporting in Russia, where this type of crime is a      quarter total and a 38.3% increase over Q1 2017.
frequent occurrence. Thefts with an M.O. of Internal also rose
from 3 to 8.                                                        The other products averaging more than one crime per
                                                                    week in Q1 were:
Crimes with a Violent or Threat with Violence M.O. accounted
for only 1.9% of the total incidents in this reporting period and   •	Clothing & Footwear – 47 crimes in Q1, 7.6% of
the 12 cases in Q1/18 were five lower than in the same period          the quarterly total
of last year. Only one of these violent attacks involved a major    • Car Parts – 36 or 5.9%
loss; the €107,696 theft of clothing & footwear products in
                                                                    • Furniture/Household Appliances – 28 or 4.5%
a Theft from Vehicle crime in Dartford, Kent, in the UK on 6
March. However, TAPA EMEA is continuing to see a rise in            • Tobacco – 25 or 4.0%
the number of violent attacks on Last Mile delivery drivers, a      • Computers/Laptops – 24 or 3.9%
major concern for the tobacco industry in particular.               • Cosmetics & Hygiene – 23 or 3.7%
Theft from Moving Vehicle incidents reduced from 10 a year          • Metal – 21 or 3.3%
ago to just two in Q1 2018. On 8 February, thieves targeted
                                                                    • No Load – 20 or 3.2%
a truck travelling along the A5 in Hinckley, Leicestershire in
the UK, and stole phones worth €45,380 while the vehicle            • Tools/Building Materials – 16 or 2.5%
was in motion. In the second crime, a truck carrying cigarettes     • Tyres – 15 or 2.4%

 HAVE YOU SEEN THE NEWS?
                                                                                                                                                  AVERAGE Q1 LOSS VALUES:
                                                                                                                                                    5-YEAR COMPARISON

                                                                                                                                                                               €61,369
  Over 50% of the intelligence gathered by TAPA’s Incident                                                                                2018

  Information Service (IIS) is generated from media reports.                                                                              2017                                 €98,498

                                                                                                                                          2016                                 €74,547
                                 If you see a reported cargo crime incident, just take
                                 a second and send the news link to iis@tapaemea.org
                                                                                                                                          2015                                 €210,365

                                 TAPA INTELLIGENCE DRIVES A SECURE SUPPLY CHAIN                                                           2014                                 €210,869

TAPA EMEA - INCIDENT INFORMATION SERVICE - Q1 2018 REPORT                                                                                                                                           6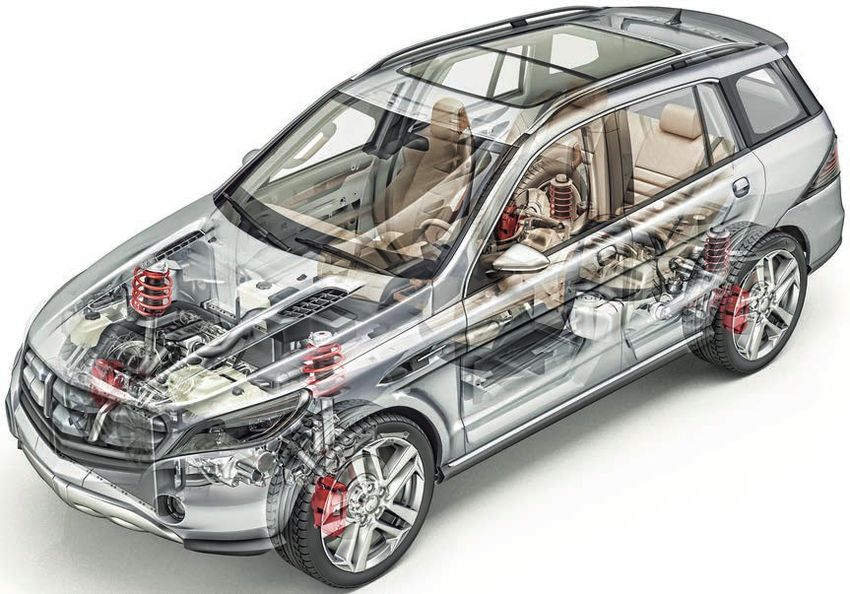
EMEA REGION - CARGO CRIME BY COUNTRY IN Q1 2018

         BASED ON ALL FREIGHT THEFTS REPORTED TO TAPA’S INCIDENT
         INFORMATION SERVICE (IIS) IN THE EMEA REGION IN Q1 2018
        COUNTRY                      Q1 2018 INCIDENTS         % OF Q1 2018 TOTAL              VS. Q1 2017 TOTAL         % CHANGE YEAR-ON-YEAR
        BELGIUM                               11                      1.70%                              1                        1000%
        BULGARIA                               1                     0.20%                              0                           n/a
        CZECH REPUBLIC                        4                      0.60%                               1                         300%
        DENMARK                               3                      0.40%                               2                          50%
        FINLAND                                1                     0.20%                              0                           n/a
        FRANCE                               24                      3.90%                               7                      242.80%
        GERMANY                              25                      4.00%                              19                        31.50%
        GREECE                                2                      0. 30%                             0                           n/a
        HUNGARY                               2                      0.30%                              0                           n/a
        IRELAND                                1                     0.20%                              0                           n/a
        ITALY                                  7                      1.10%                              4                          75%
        LATVIA                                 1                     0.20%                              0                           n/a
        NETHERLANDS                          57                      9.20%                             188                       -69.60%
        NIGERIA                                1                     0.20%                               1                     No change
        POLAND                                2                      0. 30%                              1                         100%
        ROMANIA                               2                      0. 30%                             0                           n/a
        RUSSIA                               37                      6.00%                               3                      1133.30%
        SOUTH AFRICA                          13                     2.00%                               9                        44.40%
        SPAIN                                 8                      1.30%                               2                         300%
        SWEDEN                               34                      5.50%                              48                       -29.10%
        SWITZERLAND                            1                     0.20%                              0                           n/a
        UNITED KINGDOM                      382                      61.70%                            417                        -8.40%
        ZIMBABWE                               1                     0.20%                              0                           n/a

                                                           Q1 2018:                          Q1 2017:                      % CHANGE YoY
                TOTAL                                     620                               709*                            -12.5%
        * Note: Kenya (3), Kazakhstan (1), Swaziland (1) and United Arab Emirates (1) all recorded crimes in the TAPA EMEA IIS database in Q1 2017 but
                                   none in Q1 2018. The overall total number of recorded cargo crimes in Q1 2017 was 709.

7                                                                                                                     TAPA EMEA - INCIDENT INFORMATION SERVICE - Q1 2018 REPORT
NETHERLANDS Q1 2018 TOTAL NUMBER OF
INCIDENTS IN Q1 2018
NUMBER & % OF CRIMES
0
WITH A LOSS VALUE
57
MOST RECORDED TYPE OF INCIDENT
THEFT FROM VEHICLE – 41 OR 71.8% OF QUARTERLY TOTAL
VS. Q1 2017 TOTAL OF 188
ALL INCIDENTS = % CHANGE YEAR-ON-YEAR -69.6%
Theft from Vehicle............................................................... 41 (71.8%)
Theft of Trailer.............................................................................7 (12.2%)
Theft of Vehicle............................................................................ 3 (5.3%)
Truck Theft......................................................................................... 3 (5.3%)
61.4% OF Q1 INCIDENTS
INCIDENT
CATEGORY Theft from Trailer.......................................................................... 1 (1.8%) OCCURED IN 3 PROVINCES -
Theft from Facility........................................................................ 1 (1.8%)
Fraud.......................................................................................................... 1 (1.8%)
NORTH BRABANT, LIMBURG
-69.1% FALL IN THE NUMBER OF THEFT FROM
& GELDERLAND
VEHICLE CRIMES IN THE NETHERLANDS IN Q1
2018 VS. Q1 2017
TAPA's IIS RECORDED OVER 20 CASES OF
TRUCK TARPAULINS BEING CUT OPEN ON
10 TAPA IIS PRODUCT CATEGORIES RECORDED A SINGLE NIGHT IN GELDERLAND
LOSSES IN THE NETHERLANDS IN Q1 2018
MOST STOLEN PRODUCT: TRUCK AND/OR TRAILER WITH NO LOAD MOST REPORTED TYPE OF LOCATION
UNSECURED PARKING – 32 OR 56.1% OF TOTAL
MODUS OPERANDI USED
NUMBER OF MAJOR LOSSES
0
IN MOST CARGO THEFTS: ALL INCIDENTS
INTRUSION - RECORDED IN IN EXCESS OF €100,000
38 OR 66.6% OF TOTAL Unsecured Parking....................................................................... 32 (56.1%)
Intrusion.................................................................... 38 (66.6%) Secured Parking................................................................................ 10 (17.5%)
Unknown....................................................................18 (31.6%) Origin Facility.......................................................................................... 9 (15.8%)
Deceptive Pick Up..................................................1 (1.8%) LOCATION Services 3rd Party Facility............................................................5 (8.8%)
TYPE Unknown......................................................................................................... 1 (1.8%)
-59.1% DECREASE IN CASES OF
INTRUSION VERSUS THE SAME -74.6% LOSSES AT UNSECURED
3 MONTHS OF 2017 vs. 2 in Q1 2017 PARKING LOCATIONS REDUCED
SIGNIFICANTLY FROM 126 IN Q1 2017
8 TAPA EMEA - INCIDENT INFORMATION SERVICE - Q1 2018 REPORT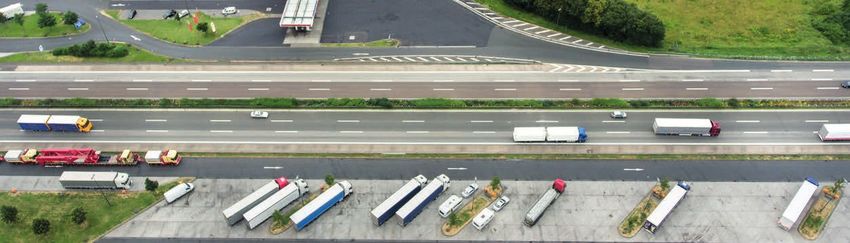
NETHERLANDS - Q1 2018
Recorded incidents drop by 69.6% compared to Q1 2017 – so is the proactive approach of Dutch
police starting to deter cargo criminals from operating in the Netherlands?
The most significant fact to emerge in terms It is not possible to provide a clear explanation for the decline
of cargo thefts in the Netherlands in the first although the proactive approach taken by Dutch police
to counter the threat of cargo crime may well be having a
quarter of 2018 is the significant drop in the positive impact, such as initiatives mentioned in previous IIS
number of recorded crimes. A year ago, 188 Reports in the last 12 months involving the launch of a Cargo
losses were reported to TAPA’s IIS database but Theft Reporting Hotline and the high-profile arrest of a gang
in Q1 2018 this figure fell substantially to 57, a implicated in a series of Theft from Moving Vehicle crimes in
the Netherlands and other parts of Europe.
69.6% drop.
With the majority of crime reports coming from TAPA’s law Multiple ‘curtain-cutting’ crimes
enforcement agency partners, none of the incidents in this Similar to the United Kingdom a high percentage of all cargo
reporting period provided any financial data. Nonetheless, crimes involved thieves slicing open the tarpaulin curtains
the reduced rate of incidents is encouraging – especially of parked trucks to steal products. In Gelderland, TAPA
given the strategic importance of the Netherlands to supply EMEA received reports of more than 20 vehicles having
chains connecting customers across Europe. As with the their tarpaulins cut over the course of just one night as cargo
overall figures for the EMEA region in Q1 2018 and the lower thieves trawled through the site of a Services 3rd Party
crime rates in the UK and Sweden, it remains to be seen if Facility in Gaanderen looking for desirable goods to sell on
this is a trend that can be sustained. the black market.
THEFT BY PRODUCT - Q1 2018
*Number of incidents % of total
Unspecified 21 36.8%
No Load 8 14.0%
Cosmetics & Hygiene 6 10.5%
Food & Drink 5 8.8%
Computers/Laptops 4 7.0%
Clothing & Footwear 3 5.3%
Furniture/Household Appliances 2 3.5%
Miscellaneous 2 3.5%
Phones 2 3.5%
Tools/Building Materials 2 3.5%
Toys/Games 1 1.8%
Metal 1 1.8%
TAPA EMEA - INCIDENT INFORMATION SERVICE - Q1 2018 REPORT 9
NETHERLANDS - Q1 2018
A single case involving Fraud and a Deceptive
Pick-up was also recorded on 31 January when
thieves used fake documentation to steal metal from
an Origin Facility in Rotterdam, Southern Holland.
In Q1, TAPA received intelligence on cargo crimes in
10 Dutch provinces, with the top three consisting of:
• North Brabant, 19 incidents or 33.3% of the Q1 total
in the Netherlands
• Limburg, 10 incidents or 17.5%
• South Holland, 6 incidents or 10.5%
Of the nine TAPA IIS product categories recording
losses, the top three were:
• No Load (Theft of truck and/or trailer) –
CARGO CRIMES BY REGION - Q1 2018
8 incidents, 14%
Position on map Number of incidents
• Cosmetics & Hygiene – 6 incidents, 10.5%
• Food & Drink – 5 incidents, 8.8% 1 North Brabant 19
Crimes involving Theft from Vehicle accounting for 41 2 Limburg 10
or 71.8% of all types of incidents in the quarter, while 9
3 Gelderland 7 7
the most reported type of location was Unsecured
Parking, which was stated in 32 or 56.1% of thefts. 4 South Holland 6 8
5 Overijssel 5
5
6 Utrecht 3 10
57
3
4 6
recorded
incidents in total
1
2
After a 24.8% rise in cargo crimes in the Netherlands in 2016, the growth 7 3
Drenthe
rate slowed to just 1.2% last year. Q1 2018 incident data suggests freight 8 North Holland 2
thefts across the country are continuing to fall 9 Friesland 1 10 Flevoland 1
10 TAPA EMEA - INCIDENT INFORMATION SERVICE - Q1 2018 REPORTYEAR-ON-YEAR ANALYSIS
Based on all cargo crimes reported to TAPA's Incident Information Service (IIS) in Q1 2018 vs. Q1 2017 in the EMEA region
INCIDENT DATA COMPARISON Q1 2018 Q1 2017 CHANGE YoY
Total number of reported cargo crimes 620 709 -12.5%
% of freight thefts stating a value 69.4% 62.2% +7.2%
Total loss for all incidents recording a value €26,511,436 €43,437,696 -€16,926,260
Average loss for the year based on incidents
€61,369 €98,498 -€37,129
reporting a value
Number of major crimes with a loss value
49 with average loss of €310,630 40 with an average loss of €683,127 +9
of more than €100,000
% of crimes classified as major losses 7.9% 5.6% +2.3%
Country with the highest number of
United Kingdom - 382 incidents United Kingdom - 417 incidents -8.4%
recorded freight thefts
Most recorded type of incident Theft from Vehicle - 437 or 70.5% Theft from Vehicle - 558 or 78.7% Incidents -21.6%
Most recorded type of location Unsecured Parking - 435 or 70.2% Unsecured Parking - 513 or 72.4% Incidents -15.2%
Most recorded modus operandi used
Intrusion - 478 or 77.1% Intrusion - 549 or 77.4% Incidents -12.9%
by thieves
Total number of countries recording
23 18 +5
cargo losses in EMEA
€2,017,440 - Theft from Vehicle of car parts €8,108,416 - An Internal theft of cash-in-transit at
Biggest single loss -€6,090,976
while en route in Romania on 9 January Heathrow Airport in the UK on 14 March
Please note that the 2018 data referred to in this report is based on the information available at the time that
report was published. Additional data may have been added to the IIS database subsequently.
Copyright TAPA EMEA 2018. No part of this document may be reproduced, stored in a retrieval system or transmitted in any form or by any means electronic, mechanical, photocopying, recording or otherwise, without prior written approval of TAPA EMEA or
its authorized representive. We acknowledge all third party rights for the software and data used in the generation of this document. Confidentiality: This document contains information that is confidential to TAPA EMEA, its authorized suppliers
or third parties, and cannot be disclosed in whole or in part without the prior written authority of the Board of TAPA EMEA or its authorised representative. Disclaimer: All information, products and services are provided as is” without warranty
of any kind. TAPA EMEA and its IIS Service Provider hereby disclaim all warranties with respect to this information, products and services, whether express or implied, Including the implied warranties of merchantability and fitness for a particular
purpose. In no event shall TAPA EMEA or its IIS Service Provider be liable for any direct, indirect, incidental, special or consequential damages or damages for loss of profits, revenue data or use, incurred by you or any third party, whether
in an action in contract or tort, arising from your access to, or use of information, products or services obtained from TAPA EMEA IIS.
TAPA EMEA - INCIDENT INFORMATION SERVICE - Q1 2018 REPORT 11SETTING THE STANDARD
FOR SECURE SUPPLY CHAINS
www.tapaemea.org
www.tapa-global.orgYou can also read