ARES: Advanced Networking for Distributing Genomic Data
←
→
Page content transcription
If your browser does not render page correctly, please read the page content below
ARES: Advanced Networking for Distributing Genomic Data
               Gianluca Reali(*), Mauro Femminella(*), Emilia Nunzi(**)(***), Dario Valocchi(*)
                                  (*)
                                     Department of Engineering, University of Perugia,
                                                  06125 Perugia, Italy.
                           (**)Department of Experimental Medicine, University of Perugia,
                                Via Gambuli, Edificio D, 3° Piano, 06132 Perugia, Italy.
                      (***)
                            Polo d’Innovazione di Genomica, Genetica e Biologia (GGB) SCARL
                                Via Gambuli, Edificio D, 3° Piano, 06132 Perugia, Italy.

                         {gianluca.reali, mauro.femminella, emilia.nunzi}@unipg.it, dario.valocchi@gmail.com
                                             Gianluca Reali phone number: +390755853651

Keywords: Content Distribution Network, Cloud Computing, Genomic data, Big Data, DNA analysis.

Abstract
This paper shows the network and service architecture being implemented within the project ARES (Advanced
networking for the EU genomic RESearch). This architecture is designed for both providing delivery of genomic data
set over the GÉANT network and supporting the genomic research in EU countries. For this purpose, the strategic
objective of the project ARES is to create a novel Content Distribution Network (CDN) architecture, suitable for
handling the rapidly increasing diffusion of genomic data. This paper summarizes the status of the project, the ongoing
research, and the achieved and expected results. This CDN architecture is based on an evolved NSIS signalling, and
addresses the major challenges for managing genomic data sets over a shared wideband network with limited amount of
resources made available to the service.
Besides a detailed description of the functional entities included in the ARES architecture, we illustrate the signalling
protocols that support their interaction, and provide preliminary experimental results obtained by the implementation
and deployment of two significant research scenarios within our research laboratories.

1. Introduction.
The increasing scientific and societal needs of using genomic data and the parallel development in sequencing
technology has made affordable the human genome sequencing on large scale (DNA Sequencing Costs)(Strickland
2013). In the next few years, many applicative and societal fields, including academia, business, and public health, will
require an intensive use of the massive information stored in the DNA sequence of the genome of any living body.
Access to this information, a typical big data problem, requires redesigning procedures used in sectors such as biology,
medicine, food industry, information and communication technology (ICT), and others.
The strategic objective of the project ARES (Advanced networking for the EU genomic RESearch) is to create a novel
Content Distribution Network (CDN) architecture supporting medical and research activities making a large use of
genomic data. This paper summarizes the status of the project, the ongoing research, and the achieved and expected
results.
The size of the file containing a sequenced human genome is approximately equal to 3.2 GB. In addition, the genome
processing results, necessary to further computations in research and medical activities, consists of quite large files,
which makes the whole data sets larger of orders of magnitudes. For example, the size of the Catalog of Human Genetic
Variation (1000 Genomes) is 464 TB for just 1000 samples. Since it is expected that in the next few years all newborns
will have their whole genomes sequenced, and the whole medicine will build upon genome processing, it is evident that
managing genomic data will shortly be a very serious problem (O’Driscoll, Daugelaite & Sleator 2013). It is also
evident that doctors and genomic scientists from thousands of hospitals and research centres will not be able to quickly
download all needed files and have the desired result in a short time. In order to avoid that the available data networks
will not be the bottleneck of the entire process, it is necessary to design and deploy scalable network service
architectures that allow delivering the genomic processing results in a time compliant with the medical and research
needs.
The main research objectives of ARES are
- To gain a deep understanding of network problems related to a sustainable increase in the use of genomes and
    relevant annotations (auxiliary genomic files) for diagnostic and research purposes.
- To allow extensive use of genomes through the collection of relevant information available on the network for
    diagnostic purposes.
- To identify suitable management policies of genomes and annotations, in terms of efficiency, resiliency, scalability,
    and QoS in a distributed environment using a multi-user CDN approach.
- To make available the achieved results to extend the service portfolio of the GÉANT network (Géant) with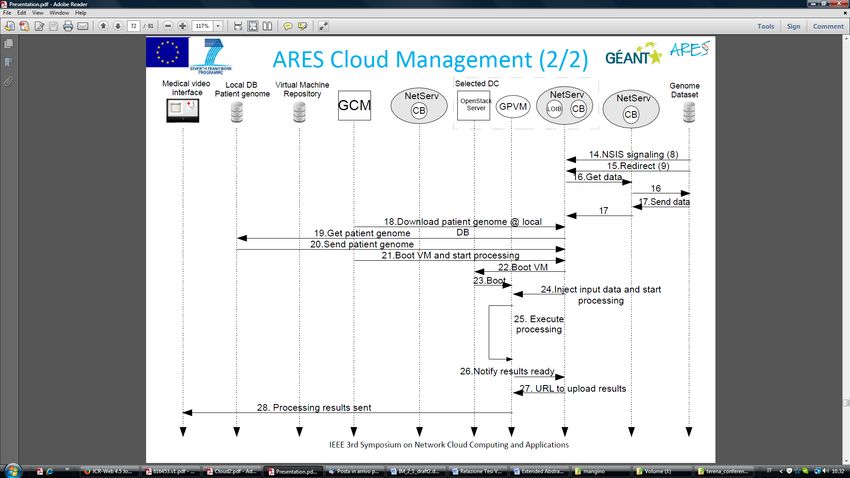
advanced CDN services.
The paper is organized as follows. Section 2 provides first a description of the original aspects of the genomic contents
form the networking perspective. We will show that genomic data have some original features very different from other
data typically available in the Internet. Thus, from the network perspective, they cannot simply be regarded as big
generic files, since it will make the network resource management highly sub-optimal. We will also show the research
issues related to the adoption of well-known data management and delivery techniques, such as content distribution
networks (CDNs) and Cloud Computing services. This proposal, targeted to the GÉANT network (Géant), makes use of
some open source software packages, which are illustrated in Section 3. Section 4 shows the functional entities of the
ARES architecture and their service-level interactions. These interactions allow implementing an innovative network
distribution system, which makes an extensive use of resource virtualization driven by an advanced NSIS signalling (Fu
et al 2005), manages them through optimization functions, and access them through cloud-based services. This proposal
is illustrated in Section 5. Some case studies are illustrated in Section 6, and analyzed in terms of network load in
simulations and lab experiments. Even if the research is still in progress, these results demonstrate that our proposal is
promising and deserving further investigations. A synthesis of the current achievements and the future research
directions are illustrated in Section 7.

2. Networking Research Issues: the Big2Data Problem.
This section introduces the networking issues arising in exchanging genomic data sets through data networks.

       2.1. Service delivery time
Genomic data are being generated at a rate significantly higher than the deployment rate of network resources that can
handle that. Just to give an idea of the seriousness of the problem, assume that a researcher want to determine the
genome fingerprint of a disease spread over different countries. Not only the number of available genome files is getting
extremely large, but also each individual data set is significantly large, in the order of tens of GB. This problem will be
referred to as Big2 data problem.
The genome processing typically proceeds through a pipeline of software packages. Many pipelines exist, each having a
specific research or diagnostic purpose (Yandell & Ence 2012). The input files of these pipelines are typically genome
files, processed genome data sets, that will be referred to as genome annotations, and the human reference genome
model (http://hgdownload.cse.ucsc.edu/downloads.html), used for file alignment purposes. Even if the patient’s genome
may be locally stored, all other files must be downloaded from different databases. The aggregate size of all these files
ranges in the interval from few GB to several tens of GB. Once all files are available, the relevant processing may take
different hours.
In summary, the overall time taken for having the result of a processing request could be longer than one day. In the
view of the fast diffusion of genomic data, this poses two technical challenges, the minimization of the service delivery
time when a very serious disease must be treated and the minimization of the overall network traffic. In regards to the
former issue, some initiatives aim to decrease the processing time. For example, the Translational Genomics Research
Institute adopts a cluster of several hundreds of CPU cores (TGen) to significantly decrease the processing time of the
tremendous volume of data relevant to the neuroblastoma. While this approach may be expected in a small number of
prestigious organizations, it cannot be generally adopted when genomic processing will be largely needed in most of
countries. In regard to service time, a lot of research is urgently needed on the networking side. For example, the
Beijing Genomics Institute, which produces 2,000 human genomes a day, instead transmit them through the Internet or
other networks, sends computer disks containing the data, via express courier1.

       2.2. Popularity model
A further original aspect that makes the Big2 data problem even more challenging is that a popularity model of data is
not known. For other data types, such as a video file, the popularity patterns typically increases until a maximum is
reached, and then it decreases over time. For genomes, the popularity does not have a typical pattern. A genome is an
incredibly rich source of information still unveiled. It may happen that the interest over the genome of a dead man is
more interesting than a genome recently sequenced. The popularity could also decrease and increase again after some
time according to the research progress in a totally unpredictable manner. Thus, in the short and medium terms the
evolution of the available data in the future networks can be modeled as a pure-birth process. Therefore, beyond the
clear need to have large amounts of storage capacity, specific solutions for managing data storage are expected. For this
reason, the ARES architecture includes a dynamic cache management, which adapts to the request pattern of genome
data.

1
    http://www.nytimes.com/2011/12/01/business/dna-sequencing-caught-in-deluge-of-data.html.
2.3. Data management
The intrinsic nature of genomic data provides new opportunities for managing them. In fact, genome processing has
highlighted that diseases can share a lot of genes in their genomic fingerprint. Thus, any activity related to the diagnosis
and treatment of a disease could trigger other similar activities for the diseases having a considerable genomic
correlation with the original one. This correlation have been organized in a large multi-scale graph referred to as human
disease network, which connects all known human diseases (see http://diseasome.eu/). These observed links provide
important opportunities for optimizing network data management, such as cache pre-fetching for minimizing the overall
network traffic and service delivery time, still unexplored.

    2.4. Parallel downloading
The minimization of the service delivery time can be pursued also by resorting to parallel data download. This feature
poses significant challenges on signalling protocols and data discovery. The problem is that the system decision point,
in order to decide from where downloading data, has to be provided by different information. In fact, it has to know not
only of the data repositories where the genomic data reside, which can be easily addressed by static configurations, but
also by the temporary caches in the network that have previously been used for delivering the same data, if any, and still
storing such data. We have addressed this problem by resorting to a modified version of NSIS protocol architecture,
introduced in what follows, which has been enriched by off-path signalling. This off-path signalling is used for
discovering the available network resources in network point of presence (PoPs, (Spring et al 2004)) discovering the
populated caches, and determining parallel paths for carrying the genomic data to the node selected for hosting the
genomic processing service.

    2.5. TCP incast congestion
A further research issue strictly related to parallel downloading consists of the so-called incast congestion problem for
TCP in data centre networks (Chen et al 2013). This problem is typical of the big data management, and is due to the
fact that TCP does not handle well many-to-one traffic data flows on high-bandwidth networks. In the situation under
analysis, since data could be retrieved from many different sites in parallel, they could overwhelm the requesting
interface and cause severe packet losses and, consequently, TCP retransmissions and timeouts.

    2.6. Security and ethical issues
It is also worth to mention the security and ethical issues involved in the exchange and management of human genomic
data. They include the authentication of the involved entities, data integrity, and their encrypted exchange. These issues
are beyond the scope of this paper. We just mention that the network connections established in our experiments are
suitably encrypted, and that the genomic data exchanged and processed during our tests are publicly available in
databases such as (1000 Genomes). For a deep investigation of the involved ethical issues, we suggest to refer to the
project Elixir (http://www.elixir-europe.org/).

3. Background and Software Packages.
The ARES project integrates different technologies that have recently been made available to efficiently deploy services
and deliver data, such as CDN, Cloud, and Grid Computing.
The experimental achievements of such integration depend on some protocols and tools illustrated in what follows.

    3.1. Content Distribution Network
A CDN is a distributed network of servers and file storage devices, typically referred to as caches. They are deployed to
store content and applications in proximity to users, in order to reduce the network resources used to satisfy a customer
request and improve the user perception of the network service. CDNs can address a wide range of needs, such as
multimedia content distribution over the Internet, cache large files for fast delivery, support of on-line business
applications and so on.
In recent years, CDN operators have struggled to tackle the big data problem, by using
- high-radix switch-routers, having an aggregate capacity of hundreds of 10 Gigabit Ethernet ports and different
    routers per datacentre in order to scale in the terabit per second range,
- tens of servers connected by multiple gigabit links to the top of rack (TOR) switch 0 and from the TOR to the
    datacentre interconnect fabric.

    3.2. NSIS
NSIS is a suite of protocols specified by the IETF RFC 4080. Its architecture is shown in Figure 1.
Figure 1 – NSIS architecture.
It was defined for signalling information about a data flow along its path in the network, in order to allows signalling
applications to install and manage states in the network. It consists of two layers:
- NSIS transport layer protocol (NTLP), which is a generic lower layer used for node discovery and message sending,
which is regarded as independent of any signalling application;
- NSIS signalling layer protocol (NSLP), the upper layer, which defines message format and sequences; it contains
the specific signalling application logic.
GIST (General Internet Signaling Transport protocol, (Schulzrinne & Hancock 2010), is a widely used implementation
of NTLP. GIST makes use of the existing transport and security protocols to transfer signalling (i.e. NSLP) messages on
behalf of the served upper layer signalling applications. It provides a set of easy-to-use basic capabilities, including
node discovery and message transport and routing. Since its original definition, GIST allows transporting signalling
message according to two routing paradigms. It provides end-to-end signalling, that allows sending signalling messages
towards an explicit destination, and path-coupled signalling, that allows installing states in all the NSIS peers that lie on
the path between two signalling peers.
GIST does not make use of any new IP transport protocols or security mechanisms. It rather takes advantage of existing
protocols, such as TCP, UDP, TLS, and IPsec. Applications have to specify the transport attributes for their signalling
flow, such as unreliable or reliable. In turn, GIST has to select the most appropriate protocol to provide the flow
requirements. Typically, UDP is used for unreliable signalling, whilst TCP is selected when reliability is required. TLS
over TCP is a suitable solution for providing secure and reliable signalling flows. GIST includes extensibility functions
that allow including different transport protocols in the future. In particular, in (Femminella et al 2012) we have
illustrated our implementation of a third routing paradigm, named off-path signalling, that allows sending signalling
message to arbitrary sets of peers, totally decoupled from any user data flow. A peer set is called off-path domain. We
have defined and implemented three different off-path signalling scheme: (i) Bubble, which allows to disseminate
signalling around the sender, (ii) Balloon, which allows disseminating signalling around the receiver, and (iii) Hose,
which allows discovering and exchanging signalling messages with peers close to the network path connecting
information source and destination. Thanks to the extensibility of GIST, other off-path domains can be implemented as
they become necessary for different signalling scenarios.
3.3. NetServ
The objectives of ARES will be pursued by resorting to the NetServ service modularization and virtualization
(Femminella et al 2011). The former consists of providing well-defined building blocks, and use them to implement
other services. The runtime environment executing services is provided by a virtual services framework, which manages
access to building blocks and other resources on network nodes. Applications use building blocks to drive all network
operations, with the exception of packet transport, which is IP-based. The resulting node architecture, designed for
deploying in-network services (Femminella et al 2011), is suited for any type of nodes, such as routers, servers, set-top
boxes, and user equipment. This architecture is targeted for in-network virtualized service containers and a common
execution environment for both packet processing network services and traditional addressable services (e.g. a Web
server).Figure 3 depicts the developed service virtualization architecture. As illustrated in the figure, applications use building
blocks to drive all network operations, with the exception of packet transport, which is IP-based. The resulting node
architecture, designed for deploying in-network services (NetServ), is suited for any type of nodes, such as routers,
servers, set-top boxes, and user equipment. This architecture is targeted for in-network virtualized service containers
and a common execution environment for both packet processing network services and traditional addressable services
(e.g. a Web server). Thus, it is able to eliminate the mentioned dichotomy in service deployment over the Internet and
administrators can be provided with a suitable flexibility to optimize resource exploitation. It is currently based on the
Linux operating system, and can be installed on the native system or inside a virtual machine. It includes an NSIS-based
signalling protocol (Fu et al 2005), used for dynamic discovery of nodes hosting the NetServ service environment, and
service modules deployment therein.
It is necessary to specify the main entities of the implemented NetServ architecture in some details.
Service containers, which are user-space processes. Each container includes a Java Virtual Machine (JVM), executing
the OSGi framework for hosting service modules. Each container may handle different service modules, which are
OSGi-compliant Java archive files, also referred to as bundles. The OSGi framework allows for hot-deployment of
bundles. Hence, the NetServ controller may install modules in service containers, or remove them, at runtime, without
requiring JVM reboot. Each container includes system modules, library modules, and wrappers of native system
functions. The current prototype uses Eclipse Equinox OSGi framework. Service modules are OSGi bundles deployed
in a service container.
Any incoming packet is routed from the network interface, through the kernel, to a service container process being
executed in user space. Each NetServ module may act as both server module or packet processing module. This is an
original NetServ feature that overcomes the traditional distinction between router and server by sharing each other’s
capabilities.
Signaling module: The implementation of the NetServ signalling daemons is based on an extended version of NSIS-ka,
an open source NSIS implementation by the Karlsruhe Institute of Technology (NSIS-ka). The NetServ NSLP is able to
manage the hot-deployment of service bundles on remote nodes. NetServ NSLP handles 3 types of messages:
- SETUP message, which triggers the installation of a specific bundle on the remote node. Its header includes NetServ
version, the requesting NetServ user id, the bundle time-to-live, and an arbitrary series of pairs which
are initialization parameters for the bundle.
- REMOVE message, which explicitly removes an existing bundle from the remote node.
- PROBE message, which is used to check if a specified bundle is instantiated on the remote node.
NetServ controller, which coordinates the NSIS signalling daemons, the service containers, and the node transport layer.
It receives control commands from the NSIS signalling daemons, about the installation or removal of service bundles
and filtering rules in the data plane. It makes use if the netfilter library through the iptables tool. The NetServ controller
is also in charge of setting up and tearing down service containers, authenticating users, fetching and isolating modules,
and managing service policies.
The NetServ repository, which stores a pool of modules (either building blocks or applications) deployable through
NetServ signalling in the NetServ nodes present in the managed network.
As mentioned above, NSIS wraps the application-specific signalling logic in a separate layer, the NSLP. The NetServ
NSLP is the NetServ-specific implementation of NSLP. The NetServ NSLP is able to manage the hot-deployment of
bundles on remote nodes.
The use of NetServ in the ARES protocol architecture has the following aims:
- definition of the service requirements for genome and annotation exchange;
- deployment of a suitable architectural framework, for modular and virtualized services, able to provide suitable
insights for the service operation and relevant perception in a research environment;
- deployment of mechanisms and protocols for service description, discovery, distribution, and composition.
- experimental performance evaluation, in terms of QoE, scalability, total resource utilization, signalling load,
performance improvement and coexistence with legacy solutions, dynamic deployment and hot re-configurability.
3.4. OpenStack.
OpenStack (http://www.openstack.org/) is a cloud management system that allows using both restful interface and APIs
to control and manage the execution of virtual machines (VMs) on a server pool. It allows retrieving information about
the computational and storage capabilities of both the cloud and the available VMs. It also allows triggering the boot of
a selected VM with a specific hardware configuration. Thus, it is possible to wrap, inside a certain number of VMs,
different existing software packages processing genome files. Each VM could expose, through OpenStack, the required
configuration, which allows mapping the minimum required computational capabilities for a specific processing service
into the hardware configuration for the VM that executes the service. Virtual machine image files are stored within the
storage units of the PoP managed by OpenStack and also available for download through a restful interface. In fact,
OpenStack allows also to automatically inject, in the managed server pool, new VMs by specifying an URL whichpoints to the desired VM image, thus allowing the system to retrieve the relevant files from other locations (i.e. other
GÉANT PoPs). Furthermore, OpenStack is not bounded to the use of a single hypervisor, but it can make use of
different drivers to support different formats of virtual machines and hypervisors, such as VMWare, KVM, Xen, and
Hyper-V.
4. ARES Architecture.
Figure 2 sketches the experimental network architecture being implemented. In what follows, we illustrate the involved
entities and the steps of the execution of the experiment.
Public Genome/Annotation Data-base: data base storing genomic information.
Medical Centres: organizations hosting medical and research personnel making use of genomic annotations. Estimate of
parameters useful for diagnoses are obtained by processing genomes of patients through pattern-matching algorithms.
Private Genome/Annotation Data-base: each Medical Centre stores patients’ genome information within a local private
data-base. This information is not publicly accessible.
NetServ CDN nodes: These nodes have a threefold role. As NSIS (Next Steps in Signaling, (Fu et al 2005)) and GIST
(General Internet Signaling Transport protocol, (Schulzrinne & Hancock 2010, Femminella et al 2012)) enabled nodes,
they discover network resources; as NetServ (Femminella et al 2011, Maccherani et al 2012, NetServ) nodes they
instantiate genome processing packages; as NetServ nodes, they implement CDN mirrors by running the CDN bundle
(CB). This bundle delivers both virtual machines (VMs) image files for genomic processing software and annotation files
to the processing Computing Node/Computing Cluster. These functions can either be co-located or implemented in
separated nodes.
Computing Node/Computing Cluster: one or more GIST computers discovered by a specific NetServ service. They
receive the Annotation files through the CDN nodes and the genome of the patient. After executing the pattern-matching
algorithms, results are returned to the requesting Medical Centre.
Controller: A single node implementing the NetServ Genomic CDN Manager (GCM).
Computing
Node
/ Private Public
Computing
Cluster Genome/Annotation Genome/Annotation
Data-‐base Data-‐base
Netserv Medical
Controller
CDN
node Centre
Control
CDN
Data
Processed
Data
Figure 2 – The ARES CDN for distributed genome processing.
4.1. Advanced CDN and virtualization services
Our experiments aims to investigate (i) which network metric is suitable for the successful and efficient usage of
genomes and annotations for both diagnosis and research purposes, and for associating requesting users with an
available cache (such as total number of hops, estimated latency, queue length in servers, available bandwidth), (ii) thebest policy for dynamically instantiating and removing mirrors, with reference to the user perception, the signalling
load, and the information refresh protocols, (iii) the achievable performance when only a subset of nodes, with a
variable percentage, execute the NetServ modules analyzed. In this latter case, our enriched off-path signalling of the
NSIS modules, mentioned in the previous section will be essential, since it allows discovering the nodes actually
executing NetServ and available services therein.
In the proposed scenario we assume that each network point of presence (PoP, see Figure 2) has a certain amount of
storage space and computational capabilities hosted in one or more servers and managed through a virtualization
solution. In this virtualized infrastructure, we assume that a specific node executes a virtual machine that hosts NetServ,
and that the virtualized resources of the PoP are managed by OpenStack (OpenStack). The NSIS signalling indicates the
required computational capabilities for a specific processing service, which is mapped into the resource configuration of
the VM that executes the service. Virtual machine image files are stored within the storage units of the PoP managed by
OpenStack and also available for download through a restful interface. In fact, OpenStack allows also to automatically
inject, in the managed server pool, new VMs by specifying an URL which points to the desired VM image, thus
allowing the system to retrieve the relevant files from other locations (i.e. other GÉANT PoPs).
Modules
verification
NSIS signaling daemons
NetServ NetServ repository
NSLP
Modules
installation Server
UNIX NetServ Packet
modules
socket Controller processing
modules
Java OSGi
GIST Service Client-server
Java OSGi Container data packets
Service
iptables Container
GIST packet
interception command Forwarded
data
Netfilter NFQUEUE #1
packets
Signaling
Linux kernel transport layer packets
Figure 3 – NetServ node internal architecture.
A CDN bundle can either be executed on the same NetServ container hosting the OpenStack Manager service module,
or on an instance of NetServ deployed within a different VM. The CDN module is in charge of managing the restful
interface for distributing both the genomic data files and the VM image files. It implements the HTTP server function
by using the NetServ native support for Jetty, a light-weighted HTTP server implemented in Java, which allows creating
restful interfaces and managing different servlets.
Finally, at least one of the NetServ nodes will run the decision system, implemented in the GCM NetServ bundle. The
GCM node will make an intensive use of the NSIS capabilities. In the proposed architecture, the GCM can use a Hose
off-path signalling scheme (Femminella et al 2012), which extends off-path signalling to the NSIS-enabled nodes
adjacent to those along the IP path between the signalling initiator and the receiver. The NetServ GCM can be
replicated in multiple locations for scaling out the service.
In addition to describing the ARES architecture in more details, the final paper will illustrate the preliminary results of
the performance achieved in supporting genomic processing pipelines (Altschul 1990, Trapnell et al 2012, Altschul et
al 1997, Schaffer et al 2001).
5. Signaling protocols
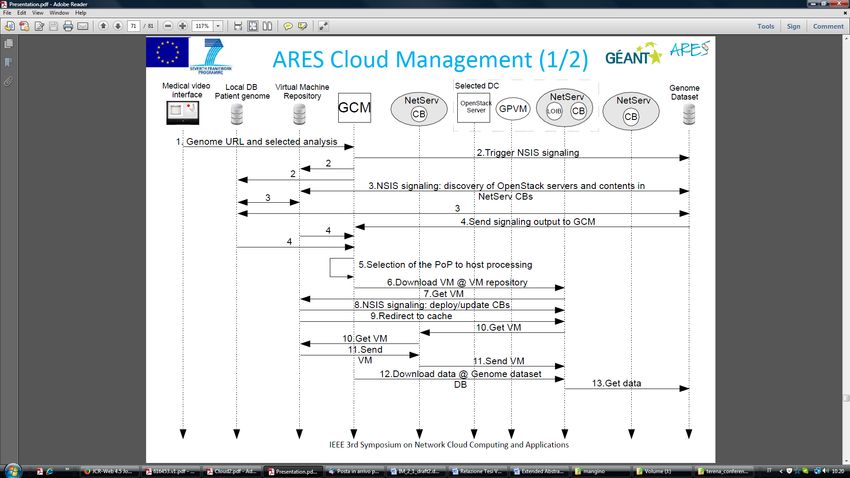
Figure 4 shows the CDN signalling that will be detailed in what follows.Figure 4 – ARES Cloud signalling In order to simplify the figure, Local DB patient genome, VM repository, and genome dataset repository have to be intended as the NetServ CB acting as proxies for them. These CBs are instantiated at runtime by the CGM at the first request for download contents from them, using an appropriate off-path NSIS signalling (remote bubble around the IP address of the selected repository Even the interactions between the OpenStack entities and the local OpenStack interface bundle (LOIB) are shown in a simplified way. Figure 4 illustrates a worst-case scenario, since contents are retrieved by the original repository and subsequently cached on the path to the selected PoP. Future requests can be served by retrieving data (VM and/or genome auxiliary data) from the caches close to the selected PoP. These caches are discovered at step 3, and used by the GCM in the PoP selection process (step 5). First, the service request is issued by the medical interface to the HTTP server. In our experiments, it consists of the providing the url of a patient’s genome and the selection of the “disease”, corresponding to software pipeline for analyzing the patient’s genome. This request is captured by the GCM, hosted by a dedicated NetServ bundle, implementing the intelligence of the system. This controller queries the database management system for being informed about the location of repositories storing genomic data sets and VMs implementing the desired software pipeline, likely implemented through a NoSQL approach for scalability reasons. Once this information is returned to the GCM, an NSIS signalling is started by the repositories towards each other, triggered by the GCM. The NSIS session will deliver a probe message according to the Hose off-path signalling mentioned above. Each NSLP probe message will follow the "virtual" path and collects the
data on the computing and storage capabilities of the PoP servers hosting NetServ instances along the "virtual" path
between the repositories storing data and the VM with the processing software.
When the NetServ nodes have collected this information, they forward it to the GCM. Then, it uses the following
information to find the suitable position of the cloud nodes (e.g. the GÉANT PoPs) where both data and VM image
have to be loaded.
When data are downloaded, an additional NSIS signalling allows locating on-path caches (or also slightly off-path
ones), indicated by steps 8 and 14 in Figure 4. The on-path caches are populated by the crossing traffic, and available to
provide data for any further request. When all files have been transferred, the LOIB, by interacting with OpenStack,
inject the VM image in the OpenStack storage, drives the VM boot, and inject the auxiliary files in the VM, which
executes the software pipeline. Then, the obtained results are returned to the requesting medical personnel. Then, the
used VM is shutdown and sensible data (patient genome) are deleted, whereas the VM image and auxiliary files are
maintained in the local CB for future use.

6. Case studies and simulation results

    6.1. Genomic Pipelines
Experiments in ARES will make use of two genomic pipelines, named Differential Expression (DE) and Copy Number
Variation (CNV). These pipelines will be deployed in two different configurations, thus resulting in four different case
studies that will make a different use of network and computing resources.
         6.1.1. Copy Number Variation (CNV) pipeline
Figure 5 shows the flow diagram of the CNV pipeline (Abyzov et al 2011.), along with the name of its software
components. The bioinformatics processing functions implemented are beyond the scope of this document. For what
concerns the ARES experiments, the resource requirements to be deployed, in two different configurations, are reported
in Table 1.

                                                                                    No
                Patient’s
  genome
  reads                FastQC
                                                                                                   End
                                                           Quality
  Control

                                                         Trimmomatic
                                                            Trimming

                                                              Reads

                                                       Bowtie
  2
  vs hg19

                                                       Mapping
  Reads

                                                        vs Genome

                       Custom
  script/BLAST               CNVnator                           Custom
  script

                           Annotation
  CNV               Find
  CNV                   Produce
  a
  Report

                                                              End

                                     Figure 5 – Copy Number Variation (CNV) Pipeline
6.1.2. Differential Expression (DE) pipeline
Figure 6 shows the flow diagram of the DE pipeline (Seyednasrollah et al 2013), along with the name of its software
components. The bioinformatics processing functions implemented are beyond the scope of this document. For what
concerns the ARES experiments, the resource requirements to be deployed, in two different configurations, are reported
in Table 1.
No
Patient’s
genome
reads
FastQC
+ End
Quality
Control
Control
genome
reads
Trimmomatic
Trimming
Reads
STAR
+
hg19
Mapping
Reads
vs hg19
index
Custom
R
script HTSeq Custom
script
Patient
vs Control Produce
a
Report
Expression
Count
Differential
Expression
End
Figure 6 – Differential Expression (DE) Pipeline
6.1.3. Computing requirements
The VM size and the auxiliary files size (e.g. the genome indexes) reported in Table 1 represent the total size of the files
to be uploaded into the PoP selected for the computation, in order the execute the relevant genomic pipeline. The RAM
size and the number of CPU cores reported in Table 1 are the minimum amount of RAM and the minimum number of
CPU cores, respectively, necessary to execute the relevant genomic pipeline. As for the disk size allocated to the VM
during the execution of the pipeline, this has been estimated with a specific input file. These values have been obtained
by performing extensive computation with different amounts of RAM and number of CPU cores allocated to the VM,
which represent reference values to be used for associating different service levels with RAM size and allocated number
of CPU cores.
Figure 7 and Figure 8 show the experimental processing time obtained by using a different number of virtual cores and a
different amount of RAM space to the CNV and DE pipelines, respectively. We can observe that, by increasing the RAM
size and the number of processor cores, it is possible to reduce the execution time of the genomic pipeline. However, the
performance improvement associated with the increase of the memory size allocated to the VM is often negligible. Only
in Figure 7 the curve with 4 GB of RAM is slightly more slow with respect all the other ones, due to the different way the
computation is performed to cope with a limited size of available memory, as reported in Table 1, and only when the
number of allocated CPU cores is equal to 2. Instead, the variability associated with a different amount of CPU cores is
more significant. Said this, by observing Figure 7 it is quite evident that the gain in allocating more than 4 CPU cores is
almost negligible and thus not recommended, and, in any case, doubling the number of CPU cores (from 2 to 4), we can
save "only" the 27% of computing time, which is about the half of what expected. Thus, this has to be done only when
strictly necessary. Thus, a final, general comment is that the processing time of the CNV pipeline is dependent of the
number of CPU cores used, whilst it appears to be quite insensitive to the amount of allocated RAM size beyond 8GB. It
is possible to execute the CNV pipeline by using 4GB of RAM, but the achievable performance results to be affected by
this choice.Pipeline Configuration Hypervisor VM image RAM size # CPU VM storage Auxiliary files
size min cores size 2 size
min
CNV BOWTIE aligner (the KVM 3.1GB 8 GB 1 50 GB 3.5 GB
computing is performed
on the whole human
genome)
CNV BOWTIE aligner (the KVM 3.1 GB 4 GB 1 50 GB 3.5 GB
computing is performed
chromosome by
chromosome)
DE BOWTIE aligner KVM 3.1 GB 4 GB 1 80 GB 3.5 GB
DE STAR aligner KVM 3.1 GB 32 GB 1 100 GB 26 GB
Table 1 - Configuration and minimum resource requests of VMs implementing the genomic pipelines.
9
8,5
4GB 8GB 12GB 16GB
8
7,5
Processing Time [h]
7
6,5
6
5,5
5
0 2 4 6 8 10 12 14 16 18
Number of cores
Figure 7 – Processing time of the CNV pipeline vs number of allocated virtual cores, for different values of the
allocated RAM size.
The situation is similar in Figure 8 there is not a clear, significant advantage to allocate more than the minimum
computing resources (reported in Table 1) to the VM performing a DE pipeline. In fact, the performance of the DE
pipeline shows a substantial independence of the RAM size when the STAR aligner is used. This aligner requires a
minimum amount of 32GB RAM, and any further increase of this large value is useless. In addition, a very large amount
of RAM could give some problem due to the dynamic memory management and garbage collection of the Java
components of the pipeline. Also for the allocation of CPU cores, multiplying by 8 their number, the gain is around 20%,
a result which does not definitely recommend allocating more that 2 CPU cores.
As a final note is relevant to the hypervisor choice. Even if we have used KVM, since it is open source and widely used
both in the research community and in operational data centres, especially for its easy integration with cloud management
2
The requirement in terms of storage size allocated to the VM executing the processing pipeline (in GB) has been estimated by using as inputs two
compressed files of 1.2 GB each. It takes into account all intermediate outputs of the pipeline, and leaves enough spare disk space to avoid problems
in the operating system.systems like OpenStack, the obtained results do not depend on the specific hypervisor used, which could be also Xen,
Hyper-V, or VMWare ESXi.
These simple considerations make evident the possibility of making different trade-offs when the two pipelines are used.
The traded resources essentially consist of the RAM size and CPU cores, which may have an impact on cache
deployment and management, essentially on the download time, number of parallel executed pipelines and their
processing time. Clearly even the processing time may be part of a trade-off in order to deploy differentiated service
categories.
The results shown will be used in operation to adapt the performance requirement to the seriousness of the medical
scenario being executed.
The results shown so far are not representative of the wide scenarios that can be found in operation. Even during the
execution of the activities of the ARES project, different genomic components will be introduced, according to
considerations deriving from both the ICT and medical areas. Thus, even if what was done so far is well representative of
the ARES experimental activities, a continuous monitoring of the suitability of individual functions and requirement will
be done.
3,4 32GB 64GB 96GB
3,2
3
Processing Time [h]
2,8
2,6
2,4
2,2
2
0 2 4 6 8 10 12 14 16 18
Number of cores
Figure 8 – Processing time of the DE pipeline vs number of allocated virtual cores, for different values of the allocated
RAM size. Use of the STAR aligner.
6.1.4. System Analysis
In this section, we present some preliminary results about the effectiveness of the proposed solution in terms of total
traffic exchanged in the transport network. To obtain these results, we have executed some simulations using the
topology of the GÉANT IP network (Géant), illustrated in Figure 9. In this figure, each circle represents a national PoP,
whose internal architecture is reported in Figure 10. We have assumed that the VM repository is reachable through the
AT PoP, whereas the repository for annotations and auxiliary, reference genome files can be reached through the UK
PoP.Figure 9 – GÉANT IP network topology.
Figure 10 – PoP architecture.
The project ARES is in progress. Lab experiment as has shown the correct functioning of all the software components
mentioned above. For what concerns the achievable performance, so far they have been analyzed by simulation only.
Service requests are modeled as a Poisson process, with average rate λ, generating from 5 to 45 requests per hour. For
each value of λ, we have simulated 10000 genomic processing requests. Each request comes from a user connected to
one of the 42 PoP of the topology. The users are randomly selected using a uniform distribution. We considered the
execution of three different genomic processing pipelines. Each of them uses a VM, whose image file is 3 GBs large.
The auxiliary and reference files, together with the necessary annotations for the three different processing pipelines are
equal to 1, 10, and 20 GBs, respectively. The relevant execution times have been set to 3, 4, and 5 hours, including also
the transfer time. Data flow can be shaped in the hypervisor or by another NetServ bundle, so as to avoid overwhelming
the network and thus causing starvation to other type of traffic. According to the GÉANT map (Géant), the minimum
bandwidth among PoPs has been set to 1 Gb/s. We assumed 10 Gigabit Ethernet connections inside PoPs. Each PoP canserve up to 5 genomic requests contemporarily, no matter of the selected pipeline. We assumed that all routers depicted
in Figure 10 are NetServ-enabled routers. This can be accomplished either by resorting to a software defined
networking solutions, which has been successfully tested and described in (Maccherani et al 2012), or by porting the
NetServ platform in a real router. In this regard, currently there is an ongoing effort to port the NetServ architecture
inside Juniper routers, using the Junos SDK (software development kit). We assumed that the caching capabilities
(RAM plus disk space) in NetServ nodes is equal to 50 GBs. We assumed that only VM images and
annotations/auxiliary files can be cached for future usage, but not genomes, for privacy constraints.
The proposed service architecture is compared with a basic cloud computing paradigm, in which in each PoP there is a
computing node with the same characteristics of that in our solution. When a new service request arrives, the computing
node is selected randomly among those available, and it is fed with VM image and input files (genome plus auxiliary
files).
Figure 11 shows the simulation results. The gain provided by the ARES solution is evident: it allows decreasing up to
about 5/6 times the network traffic, while providing the same service. This result is due to the dynamic caching strategy
implemented by the proposed solution, which strongly reduce the transmission of very large files on the backbone
network.
230
220
Total traffic (TB)
210
200 ARES
190
5 10 15 20 25 30 35 40 45
Service request rate, λ (req/hour)
1160
Total traffic (TB)
1150
Baseline cloud computing
1140
1130
5 10 15 20 25 30 35 40 45
Service request rate, λ (req/hour)
Figure 11 – Simulations results: ARES vs. baseline cloud computing paradigm, as a function of the input load.
7. Conclusions and future research
In this paper we have first illustrated the major issues relevant to the management of genomic big data. We have also
described the currently available results of a research project, ARES, aiming at finding scalable solutions for making
genomic data available for processing in a timely manner. Results have been shown in terms of total network traffic.
Future work will investigate also other metric (e.g. service request completion time) beyond pure network efficiency,
and deduplication schemes, which allows implementing more advanced and efficient caching policies, taking into
account also possible prefetching criteria based on likelihood of future processing for likely diagnoses.
The next steps of the project ARES consist of the realization of a comprehensive set of experiments, aimed at providing
the necessary results usable for assessing the capabilities of the proposed novel CDN concept for addressing the issues
related to the networked handling of genomic data sets.Acknowledgements This work is supported by the project ARES, funded by GÉANT/GN3plus in the framework of the first GÉANT open call. References 1000 Genomes, 2013. A Deep Catalog of Human Genetic Variation. , [Accessed 11 December 2013]. O’Driscoll A, Daugelaite J., Sleator R. D. 2013. ‘Big data’, Hadoop and cloud computing in genomics”. Journal of Biomedical Informatics. 46, pp. 774–781. The Géant pan-European research and education network, 2014 [Accessed 15 January 2014]. Yandell M. and Ence D. 2012. A beginner’s guide to eukaryoticgenome annotation. Nature Reviews, Genetics, 13(5). TGen achieves 12-foldperformance improvementin processing of genomicdata with Dell and Intel-basedHPC cluster, , [Accessed 11 December 2013]. Chen Y., Griffit R., Zats D., Katz R. H. 2013. Understanding TCP Incast and Its Implications for BigData Workloads. Technical report UCB/EECS-2012-40, EECS Department, University of California, Berkeley, [Accessed 11 December 2013]. Holzle U. 2012. Google researcher. Speaker at the Open Network Summit. Femminella M., Francescangeli R., Reali G., Lee J.W., Schulzrinne H. 2011. An enabling platform for autonomic management of the future internet. IEEE Network: IEEE 25 (6), pp. 24-32. Maccherani E., Femminella M., Lee J.W., Francescangeli R., Janak, J., Reali G., Schulzrinne H. 2012. Extending the NetServ Autonomic Management Capabilities using OpenFlow. IEEE/IFIP NOMS, Maui, US. Spring N., Mahajan R., Wetherall D., Anderson T. 2004. Measuring ISPTopologies With Rocketfuel. IEEE/ACM Transaction on Networking, 12(1). DNA Sequencing Costs. Data from the National Human Genome Research Institute (NHGRI). Genome Sequencing Program (GSP). [Accessed 09 May 2013]. Strickland E. 2013. The gene machine and me. IEEE Spectrum, 50(3), pp. 26 – 55. Altschul S.F., Gish W., Miller W., Myers E.W., and Lipman D.J. 1990, “Basic Local Alignment Search Tool,” J. Molecular Biology, vol. 215, pp. 403-410. Trapnell C. and al 2012. Differential gene and transcript expression analysis of RNA-seq experiments with TopHat and Cufflinks. Nature Protocols, 7(3), pp.562-578. Altschul S.F. et al. 1997. Gapped BLAST and PSI-BLAST: A New Generation of Protein Database Search Programs. Nucleic Acids Research, 25, pp. 3389-3402. Schaffer A.A. et al. 2001. Improving the Accuracy of PSI-BLAST Protein Database Searches with Composition-Based Statistics and Other Refinements. Nucleic Acids Research, 29(14), pp. 2994-3005. The NetServ project home page 2013. [Accessed 13 May 2013]. Fu X. et al. 2005. NSIS: a new extensible IP signaling protocol suite. IEEE Communications Magazine, 43(10), pp. 133- 141. Schulzrinne H., Hancock R. 2010. GIST: General Internet Signalling Transport. IETF RFC 5971. Femminella M., Francescangeli R., Reali G., Schulzrinne H. 2012. Gossip-based signaling dissemination extension for next steps in signaling. IEEE/IFIP NOMS 2012, Maui, US. OpenStack web site 2013. [Accessed 28 May 2013]. NSIS-ka 2014. < https://projekte.tm.uka.de/trac/NSIS/wiki> [Accessed 03 April 2014]. Abyzov A., Urban A.E., Snyder M., Gerstein M. 2011. CNVnator: an approach to discover, genotype, and characterize typical and atypical CNVs from family and population genome sequencing. Genome Res. 21, pp. 974-84. Seyednasrollah F., Laiho A., Elo L.L. 2013. Comparison of software packages for detecting differential expression in RNA-seq studies. Briefings in Bioinformatics. December. pp. 1-12.
Biographies
Gianluca Reali
Associate Professor at DIEI since January 2005. He received the Ph.D. degree in Telecommunications from the
University of Perugia in 1997. He was a researcher at the University of Perugia from 1997 to 2004. From 1999 to 2000
he was visiting researcher at the Computer Science Department of the University of California, Los Angeles (UCLA).
He is member of the Editorial Board of IEEE Communications Letters and Hindawi ISRN Communications and
Networking. He coordinates the activity of the Telecommunication Networks Research Lab (NetLab) at the University
of Perugia. He has been scientific and technical coordinator for University of Perugia of many national and international
projects.

Mauro Femminella
Assistant Professor at DIEI. He received his "Laurea" degree in Electronic Engineering, magna cum laude from the
University of Perugia on 24 March 1999. For his thesis he was also awarded by the SAT EXPO in 1999. He obtained
the Ph.D. degree in Electronic Engineering on 7 February 2003, from the University of Perugia. He was Consulting
Engineer for Universities of Perugia and Rome "Tor Vergata", and for the consortia CoRiTel and Radiolabs. His present
research is focuses on network protocols, programmable networks, network virtualization, and               molecular
communications.

Emilia Nunzi
Assistant professor at DIEI and co-head of bio-informatic group at GGB. She received the PhD degree in Electronic
Measurements from the University of Perugia. She was involved for eight years in metrological characterization of
digital systems. For three years she worked on detecting atomic clocks anomalies. For two years she worked on human
face identification. She was national coordinator of the ministerial project PRIN (Research Project of National Interests)
2007 and research unit coordinator of the project PRIN 2009. Her current research interests are in metrological
characterization of system biology devices, remote control of instrumentation for biological data processing, and
estimation of allele frequency and association mapping.

Dario Valocchi
Ph.D. student at the Department of Electronic and Information Engineering, University of Perugia. He received the
master degree cum laude in Computer and Automation Engineering from University of Perugia in 2012. His current
research interests focus on programmable networks, network virtualization and Internet protocols.
You can also read