Arizona Reconsultation Committee Meeting 3 - May 26, 2021 - Arizona Department of Water Resources

Page created by Elizabeth Hicks
 
CONTINUE READING
Arizona Reconsultation Committee Meeting 3 - May 26, 2021 - Arizona Department of Water Resources
Arizona
        Reconsultation
    Committee Meeting 3
               May 26, 2021
1
Arizona Reconsultation Committee Meeting 3 - May 26, 2021 - Arizona Department of Water Resources
Meeting Logistics Summary
-   Roll Call
      -   Members will unmute and acknowledge their attendance when their name is
          called.
-   ARC Delegates
      -   Use the WebEx “raise hand” feature to request to speak or ask questions.
      -   Wait to be recognized before speaking to ensure clear communication and
          remain muted when not speaking.
-   Livestream Attendees
      -   Electronic public comment forms are available at cap-az.com/ARC for anyone
          wishing to submit a comment or question during the meeting.
      -   All submissions will be acknowledged during the Call to the Public at the end
          of the meeting, unless relevant to a specific topic in the presentation.
-   ARC Information
      -   Meeting materials have been posted on the ADWR and CAP ARC pages:
          cap-az.com/ARC or new.azwater.gov/ARC.

2                                                                             May 25, 2021
Arizona Reconsultation Committee Meeting 3 - May 26, 2021 - Arizona Department of Water Resources
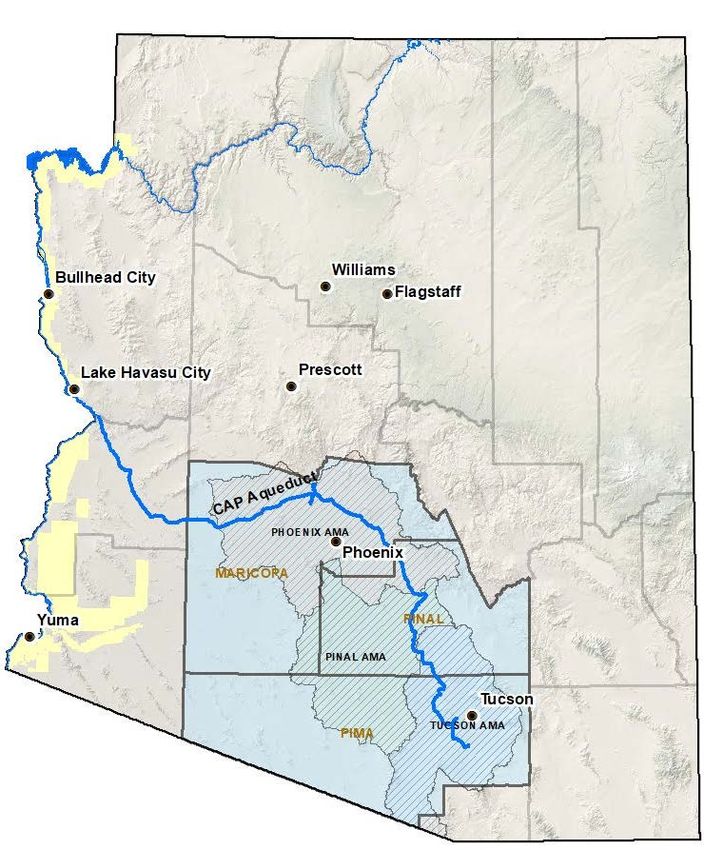
Meeting Agenda
-   Welcome and Introductions
-   Colorado River Update
-   Review of 2020 and 2021 Tier 0 Operations
-   Preparations for 2022 Tier 1 Operations
-   Report on the Modeling and Analysis Work Group Efforts
-   Report on the Arizona Strategy Team
-   Update on Federal and Basin States Processes
-   Next Steps
-   Call to the Public

3
Arizona Reconsultation Committee Meeting 3 - May 26, 2021 - Arizona Department of Water Resources
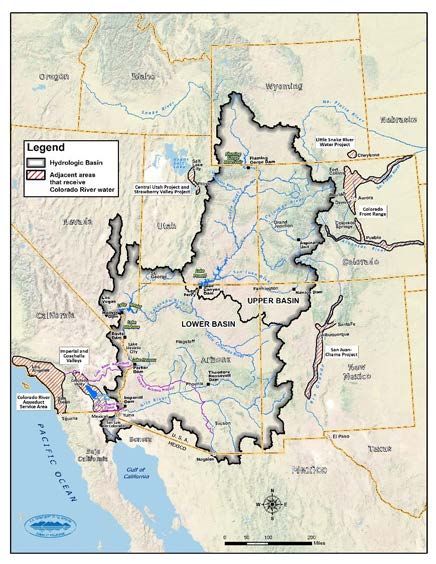
Colorado River Basin
System Status Update

Arizona Reconsultation Committee Meeting
May 26, 2021
Arizona Reconsultation Committee Meeting 3 - May 26, 2021 - Arizona Department of Water Resources
Colorado River Basin Storage
as of May 24, 2021

                                              Storage          Elevation
         Reservoir          Percent Full
                                               (maf)             (feet)

        Lake Powell             34%             8.32             3,560

        Lake Mead               37%             9.62             1,075

   Total System Storage*        42%             25.1              NA

  Total system storage was 52% of capacity, with 30.9 maf in storage, this
  time last year
Arizona Reconsultation Committee Meeting 3 - May 26, 2021 - Arizona Department of Water Resources
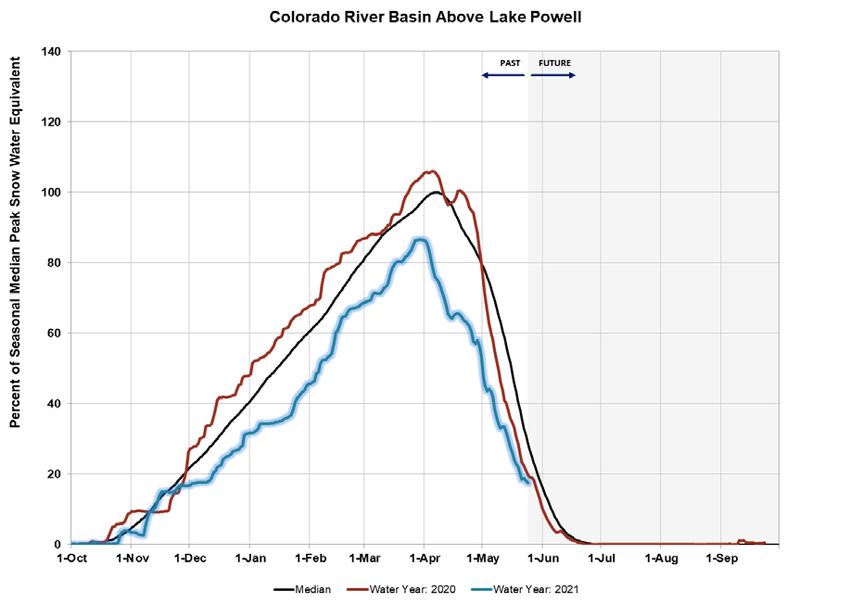
Upper Colorado River Basin
Water Year 2021 Snowpack and Inflow into Lake Powell

  Water Year 2021
                        WY 2021 snowpack
                         peaked at 89% of

 Forecasted Inflow
                        median on March 30

  (as of 5/17/2021)

     3.49 maf

  32% of average
Arizona Reconsultation Committee Meeting 3 - May 26, 2021 - Arizona Department of Water Resources
End of Calendar Year 2021 Projections
     May 2021 24-Month Study Most Probable Inflow Scenario1
Based on a Lake Powell release of 8.23 maf in WY 2021 and 7.48 maf in WY 2022

 Not to Scale
 1
 WY 2021 unregulated inflow into Lake Powell is based on the CBRFC forecast dated 5/4/21.
Shortage Reductions and Water Savings Contributions
            Under the 2007 Interim Guidelines, Minute 323, Lower Basin Drought Contingency Plan (DCP),
                                  and Binational Water Scarcity Contingency Plan
                                          (Volumes in thousand acre-feet)
                                                                                 Binational
                                                 Total
                  2007 Interim                                                     Water                                                  Total
                                 Minute 323   Combined       DCP Water                        Combined Volumes of Shortage Reductions
                   Guidelines                                                     Scarcity                                              Combined
                                  Delivery     Shortage       Savings                             and Water Savings Contributions
                    Shortage                                                    Contingency                                             Volumes
                                 Reductions   Reductions    Contributions                       by Lower Basin State and by Country
Lake Mead          Reductions                                                   Plan Water                                              (U.S. and
                                  (Mexico)     (U.S. and       (U.S.)                                    (U.S. and Mexico)
Elevations           (U.S.)                                                       Savings                                                Mexico)
                                                Mexico)
  (in feet)                                                                      (Mexico)
                                                Lower                                                                 Lower              Lower
                                                Basin                                          AZ      NV      CA     Basin    Mexico    Basin
                  AZ     NV       Mexico                   AZ    NV     CA        Mexico
                                               States +                                       Total   Total   Total   States    Total   States +
                                               Mexico                                                                 Total             Mexico

Projected
1,090 - >1,075   Operation
                   0     0 for 2022
                                  0               0        192    8         0       41        192      8       0       200      41        241

1,075 - >1050     320    13         50           383       192    8         0       30        512      21      0       533      80        613

1,050 - >1,045    400    17         70           487       192    8         0       34        592      25      0       617      104       721

1,045 - >1,040    400    17         70           487       240   10    200          76        640      27     200      867      146       1,013

1,040 - >1,035    400    17         70           487       240   10    250          84        640      27     250      917      154       1,071

1,035 - >1,030    400    17         70           487       240   10    300          92        640      27     300      967      162       1,129

1,030 – 1,025     400    17         70           487       240   10    350         101        640      27     350     1,017     171       1,188
Most Probable End of CY 2021 Projection:
        1,065.82 feet (34% full)
Min/Max Range: 1,064.97 to 1,066.89 feet

                                           Most Probable End of CY 2022 Projection:
                                                   1,048.83 feet (29% full)
                                           Min/Max Range: 1,044.96 to 1,061.57 feet
Lower Basin – Lake Mead
Percent of Traces with Event or System Condition
Results from April 2021 CRSS using the Full Hydrology and Stress Test Hydrology (values in percent)

Notes:
1 Modeled operations include the 2007 Interim Guidelines, Upper Basin Drought Response Operations, Lower Basin Drought Contingency Plan, and Minute 323, including

the Binational Water Scarcity Contingency Plan.
2 Reservoir initial conditions on March 31, 2021 were simulated using the April 2021 MTOM based on the CBRFC unregulated inflow forecast ensemble dated April 2, 2021.

3 Each of the 35 initial conditions from MTOM were coupled with 114 hydrologic inflow sequences from the Full Hydrology that resamples the observed natural
flow record from 1906-2019 for a total of 3,990 traces analyzed and with 32 hydrologic inflow sequences from the Stress Test Hydrology that resamples the
observed natural flow record from 1988-2019 for a total of 1,120 traces analyzed.
4 Percentages shown in this table may not be representative of the full range of future possibilities that could occur with different modeling assumptions.
5 Percentages shown may not sum to 100% due to rounding to the nearest percent.
2007 Interim Guidelines, Minute 323, Lower Basin Drought Contingency Plan,
                    and Binational Water Scarcity Contingency Plan
                                                                Total Volumes (kaf)
                                                                                                      Combined Volumes by Country
                                                                                 Binational
                                                                                                 US: (2007 Interim Guidelines Shortages +
                2007 Interim   Minute 323     Total          DCP Water             Water                                                        Total
                                                                                                            DCP Contributions)
                 Guidelines     Delivery    Combined          Savings             Scarcity                                                    Combined
                                                                                                Mexico: (Minute 323 Delivery Reductions +
Lake Mead        Shortages     Reductions   Reductions      Contributions       Contingency                                                   Volumes
                                                                                                Binational Water Scarcity Contingency Plan
 Elevation                                                                      Plan Savings
                                                                                                                 Savings)
 (feet msl)
                                              Lower                                                                      Lower                 Lower
                                              Basin                                             AZ      NV      CA       Basin       Mexico    Basin
                AZ     NV       Mexico                     AZ     NV     CA       Mexico
 2021
                                             States +                                          Total   Total   Total     States       Total   States +
                                             Mexico                                                                      Total                Mexico

1,090 - 1,075    0      0          0             0        192      8        0       41          192      8       0        200          41       241

1,075 - 1050    320    13         50            383       192      8        0       30          512      21      0        533          80       613

1,050 - 1,045   400    17         70            487       192      8        0       34          592      25      0        617          104      721

1,045 - 1,040   400    17         70            487       240     10     200        76          640      27     200       867          146     1,013

1,040 - 1,035   400    17         70            487       240     10     250        84          640      27     250       917          154     1,071

1,035 - 1,030   400    17         70            487       240     10     300        92          640      27     300       967          162     1,129

1,030 - 1,025   400    17         70            487       240     10     350        101         640      27     350      1,017         171     1,188
2020/21 Arizona DCP Implementation

                                                                     20192      20203      2021 4
 Arizona Lake Mead Contribution Volumes                     ICS1                Tier 0     Tier 0
       DCP Implementation & Related Actions                          (ac-ft)    (ac-ft)    (ac-ft)
                     Ag Forbearance 3 Program              EC-ICS      24,283     44,310
                     Ag Forbearance 3 Program              DCP-ICS                           57,000
  Arizona LBDCP      CAWCD Compensated Conservation        EC-ICS                  3,124
(Tier 0: 192k ac-ft) CAWCD Compensated Conservation        DCP-ICS                           3,500
                     CAWCD Excess Water5                             119,942    133,174    142,892
                                                   Total             144,225    180,608    203,392
                     GRIC - Reclamation                    EC-ICS    100,000
   Arizona DCP       GRIC - AWBA                           EC-ICS     17,000     33,000
 Mitigation Offset GRIC6                                   EC-ICS                50,000      40,000
 (400k ac-ft total) CRIT System Conservation                                     50,000      50,000
                                                   Total             117,000    133,000      90,000
                     FMYN System Conservation                                    10,000      13,933
 Reclamation DCP MVIDD                                                            6,137       6,925
                                                   Total                   0     16,137      20,858
Additional Arizona CRIT                                    EC-ICS      6,274      3,736       4,685
    ICS Creation                                   Total               6,274      3,736       4,685
                     Bullhead City                                       306        349         360
   Pilot System
                     CRIT                                             26,805
   Conservation
                     FMYN                                             13,683
  Program (PSCP)
  12                                               Total              40,794        349        360
Total Arizona Lake Mead Contributions                                308,293    333,830    319,295
CAP 2021 Tier Zero Planned
Operations:
2020 & 2021 Interstate DCP/323
 Operations:
                                            2020      2021 estimates
DCP Contributions
Arizona                                     181 kaf      203 kaf
Nevada                                       8 kaf        8 kaf

Reclamation (System Conservation)           16 kaf        21 kaf

BWSCP Contributions
Mexico                                      41 kaf        41 kaf
Additional Contributions
Arizona, California, Nevada
and Mexico (includes System Conservation,   540 kaf      130 kaf
PSCP, ICS, Mexico Water Reserve)

Total Reductions                            786 kaf      403 kaf

   14
Shortage Reductions and Water Savings Contributions
            Under the 2007 Interim Guidelines, Minute 323, Lower Basin Drought Contingency Plan (DCP),
                                  and Binational Water Scarcity Contingency Plan
                                          (Volumes in thousand acre-feet)
                                                                                 Binational
                                                 Total
                  2007 Interim                                                     Water                                                  Total
                                 Minute 323   Combined       DCP Water                        Combined Volumes of Shortage Reductions
                   Guidelines                                                     Scarcity                                              Combined
                                  Delivery     Shortage       Savings                             and Water Savings Contributions
                    Shortage                                                    Contingency                                             Volumes
                                 Reductions   Reductions    Contributions                       by Lower Basin State and by Country
Lake Mead          Reductions                                                   Plan Water                                              (U.S. and
                                  (Mexico)     (U.S. and       (U.S.)                                    (U.S. and Mexico)
Elevations           (U.S.)                                                       Savings                                                Mexico)
                                                Mexico)
  (in feet)                                                                      (Mexico)
                                                Lower                                                                 Lower              Lower
                                                Basin                                          AZ      NV      CA     Basin    Mexico    Basin
                  AZ     NV       Mexico                   AZ    NV     CA        Mexico
                                               States +                                       Total   Total   Total   States    Total   States +
                                               Mexico                                                                 Total             Mexico

Projected
1,090 - >1,075   Operation
                   0     0 for 2022
                                  0               0        192    8         0       41        192      8       0       200      41        241

1,075 - >1050     320    13         50           383       192    8         0       30        512      21      0       533      80        613

1,050 - >1,045    400    17         70           487       192    8         0       34        592      25      0       617      104       721

1,045 - >1,040    400    17         70           487       240   10    200          76        640      27     200      867      146       1,013

1,040 - >1,035    400    17         70           487       240   10    250          84        640      27     250      917      154       1,071

1,035 - >1,030    400    17         70           487       240   10    300          92        640      27     300      967      162       1,129

1,030 – 1,025     400    17         70           487       240   10    350         101        640      27     350     1,017     171       1,188
Arizona Colorado River Priorities
 (Actual 2019)
Priority 6: Entitlements to Surplus
Water                                                                                               Losses (75,000 AF)

                                                                                                              System Conservation
Priority 5: Unused Arizona Entitlement                                         P5/6
                                                                                                                  (134,555 AF)

or Apportionment

                                                                                                                                                               2019 Available Supply ≈ 1.7 MAF
                                                                            (4,474 AF)                                   EC-ICS
                                                                                            EC-ICS                     (143,146 AF)
                                                                                          (3,736 AF)       System
Priority 4: Post-September 30, 1968                                                                     Conservation
                                                                                                         (56,137 AF)
contracts, Secretarial Reservations, and

                                           2019 Consumptive Use ≈ 1.1 MAF
Perfected Rights                                                                     Priority 4 (56,324 AF)

Priority 3: Entitlements pursuant to                                                     Priority 2 & 3                                  Priority 4
contracts between the United States                                                      (528,502 AF)
                                                                                                                                      (1,280,592 AF)
and water users in the State of Arizona
executed on or before September 30,
1968
                                                                                           Priority 1
Priority 2: Secretarial Reservations and                                                 (474,276 AF)
Perfected Rights established or                                                                                                       Priority 3 (68,400 AF)
effective prior to September 30, 1968
                                                                                         On-River                                           CAP
Priority 1: Present Perfected Rights as
defined and provided for in the Decree
                                                                                                2.8 MAF Total Arizona Supply

 16
2022 Arizona Tier 1 Reduction
Summary
- Total Reductions = 512,000 af
- Reductions to P5
     - Approximately 4,000 af of Consumptive Use
       reductions
- Reductions to CAP
     - Approximately 508,000 af of reductions
- No reductions to P4 On-River
- No reductions to P1 – P3

17
2022 – Tier 1 Shortage
              1,600,000
                                       Other Excess

                                                              512,000
              1,400,000                                                                 Mitigation Water      Firming
                                       Ag Pool
                                                                                                               Compensated
                                                                                                               Mitigation
              1,200,000
                                         NIA                                                                CAP-SRP
                                                                                                            Exchange
              1,000,000
Volume [AF]

               800,000
                                                                                                           Urban-To-Ag
               600,000      Indian                    M&I

               400,000

               200,000

                     0                  P3

                          2022 – Tier 1 Prior to Mitigation             2022 – Tier 1 With Mitigation

      18
DCP Mitigation Implementation
              2020      2021      2022      2023     2024      2025      2026

                                               No CAP Wet Water Mitigation

     Ag           105 KAF - Tier 1
    Pool                                   Groundwater Infrastructure Program
                70 KAF - Tiers 2a/2b                 70 KAF / Yr
                                16.5 GW

                                                                             NO
    NIA                100%                   75%* - Tiers 1/2a
                                                                       Mitigation

    Pool                                                                2026 or
                  Tiers 1/2a/2b                 50%* - Tier 2b           Tier 3

-    Potential Tier One 2022 conditions would trigger Arizona’s Mitigation Plan
       -    CAWCD Lake Pleasant 50 kaf release and CAWCD ICS releases to NIA Pool
       -    CAWCD Compensated mitigation to NIA Pool
       -    M&I GSF to AG Pool plus AWBA LTSC Exchange

19
BREAK

20      May 26, 2021
ARC Process Review
ARC Review:
- Provide input to Arizona’s positions in the Reconsultation Process

ARC Multiple Levels:
- Modeling and Analysis Work Group
- Arizona Strategy Team

ARC Relationship to:
- Basin States Process
- Reclamation Process

Refer to the ADWR and CAWCD websites for Sep 17th ARC presentation, recording,
comments and materials

21                                                                      May 25, 2021
Arizona’s Estimate of Reconsultation
Processes and Timeline
       2020          2021         2022          2023         2024       2025     2026

     BOR 7.D             BOR Reconsultation Process*                    ROD & Federal
      Review            (multiple levels and engagement)                 Legislation**

                       Basin States Process - preferred
                       alternative/consensus agreement

              Arizona Reconsultation Committee
            Process (build intra-Arizona consensus)              Continued Engagement

     *Exact timing of BOR Reconsultation Process yet to be determined
     ** Federal legislation if necessary

22
Arizona Reconsultation Process
                        Basin States
                                                                                        BOR Process
                          Process
                           Basin
                          States*                                                       ROD & Federal
                           Arizona                                                       Legislation***
                           Strategy
                           Team**

                    AZ Technical
                        AZTechnical
                           TechnicalWork
                    Work Groups
                       Work  Groups
                             Groups

         Arizona Reconsultation Committee (ARC):
       Arizona Colorado River stakeholders including
       cities, tribes, agriculture, CAP users, industry,
         development, NGOs, and elected officials

23                        *By invitation to support the co-Chairs                                            May 25, 2021
                          **Requires confidentiality agreement for legal advice and negotiating strategies
                          ***Federal legislation if necessary
Report from Modeling and
Analysis Work Group
                              • Addresses questions and
           Basin                examinations from the ARC groups
           States             • Provide a fact-basis to inform ARC
          Arizona               discussions
          Strategy            • Examine risks, vulnerabilities and
            Team                impacts to:
        Modeling and               •   Arizona’s overall Colorado River
        Analysis Work                  supply
                                   •   On-River priorities and users
           Group
                                   •   CAP priorities and users
                              • Consider a broad range of future
     Arizona Reconsultation     conditions
        Committee (ARC)
                              • All ARC members and alternates
                                are invited to attend and participate
                                (not recorded) – non-delegates may
                                observe and provide input

24                                                             May 25, 2021
MAWG Geographies & Tools

Basin Scale = CRSS

     On-River Scale = CRSS & JSAM

25
                     CAP System = JSAM   May 25, 2021
MAWG Meetings Summary
- July 30, 2020 MAWG #1 – Introduction to CR modeling
- Nov 10, 2020 MAWG #2 – Basin scale models:
  Hydrology
- Jan 26, 2021 MAWG #3 – Basin scale models:
  Demands/depletions, Use behaviors, Operations and
  initial model visualizations
- March 11, 2021 MAWG #4 – Arizona and CAP scale
  models: Demands, Use behaviors, and priorities
- May 13, 2021 MAWG #5 – Initial Conditions Scenario
  Exercise

26                                             May 25, 2021
MAWG Initial Conditions
Scenarios Exercise
• MAWG Members completed an initial conditions scenarios
  selection exercise on May 13, 2021
• The Members submitted a pre-meeting exercise which was
  used to generate six “themes”
• From there, the Members selected model input components
  for those themes, defining six unique initial conditions
  scenarios
• ADWR-CAWCD staff have reviewed and refined one of the
  scenarios to reflect input from MAWG members

27                                                 May 25, 2021
MAWG Scenario Development
Feedback
• Suggestion for sensitivity analysis for drier conditions/higher
  uses – high impact scenario
• Members also suggested continued exploration of alternative CO
  River hydrology scenarios
• Some requested information on hydropower impacts
• Some provided suggestions for post-processing analysis to
  explore trends in the model/data

These Initial Conditions Scenario are preliminary examinations and
do not represent Arizona’s positions on model assumptions or the
appropriateness of any model variable

28                                                            May 25, 2021
MAWG Initial Conditions
    Scenarios Summary
Scenario Theme                                    1                                                           2                                                    3
                                                                                                                           Paleo-           Median hydrology (in-between
                  Drier and increased temperatures               Stress Test                 Wetter conditions                                                               Pluvial-removed
                                                                                                                         Conditioned                wet and dry)
Hydrology

                                                          Guidelines Period UB Uses                                     2016 UCRC UB       UB growth based on recent trends Guidelines Period
                   UB M&I Conservation (Low use)                                         High end of future UB use
                                                                  Extended                                                 Growth                     (Low use)             UB Uses Extended
UB Demand
                      Increased ag CU due to dry                                      Growth of on-river communities AZ On-River 0.2% Conversion of on-river ag use to AZ On-River 0.1%
AZ On-River                   conditions
                                                          AZ On-River 0.1% Growth
                                                                                             and tribal areas            Growth              on-river M&I use              Growth
Demand
                     CAP Contract allocation and                                        CAP Contract allocation and      Medium CAP          CAP Contract allocation and      Medium CAP
                                                            Medium CAP Growth
                    utilization (slow/medium/fast)                                     utilization (slow/medium/fast)      Growth           utilization (slow/medium/fast)      Growth
CAP Utilization

Scenario Theme                                    4                                                           5                                                    6
                                                                                                                                                                                 Paleo-
                  Future effects of climate variability       Downscaled-GCM          Drier and increased temperatures Pluvial-removed            Wetter conditions
                                                                                                                                                                               Conditioned
Hydrology

                  Decrease in tributary streamflow
                                                                                      UB growth based on recent trends UB Guidelines                                          2016 UCRC UB
                  for ag diversion (Intermediate UB        2016 UCRC UB Growth                                                                (Intermediate UB demand)
                                                                                                 (Low use)             Period Average                                            Growth
                               demand)
UB Demand

                                                                                                                           On-River
                  Increase in demands/ag CU due to                                    Conversion of on-river ag use to                                                       AZ On-River 0.1%
                                                                0.2% Growth                                            Guidelines Period      Increase in demands/ag CU
AZ On-River                 climate change                                                   on-river M&I use                                                                    Growth
                                                                                                                           Average
Demand
                     CAP Contract allocation and                                        CAP Contract allocation and      Medium CAP          CAP Contract allocation and      Medium CAP
    29                                                        Fast CAP Growth
                    utilization (slow/medium/fast)                                     utilization (slow/medium/fast)      Growth           utilization (slow/medium/fast)      Growth
CAP Utilization
Initial Conditions Scenario
  Refinements
 Initial Colorado River operating rules consistent with BOR’s Jan. ‘21 CRSS version
 EXCEPT ADWR-CAWCD will explore an appropriate “Equalization Line”
Scenario Theme                                    1                                                           2                                                       3
                                                                                                                           Paleo-           Median hydrology (in-between
                  Drier and increased temperatures               Stress Test                 Wetter conditions                                                               Pluvial-removed
Hydrology                                                                                                                Conditioned                wet and dry)

                                                          Guidelines Period UB Uses                                     2016 UCRC UB       UB growth based on recent trends Guidelines Period
                   UB M&I Conservation (Low use)                                         High end of future UB use
                                                                  Extended                                                 Growth                     (Low use)             UB Uses Extended
UB Demand

AZ On-River           Increased ag CU due to dry                                      Growth of on-river communities AZ On-River 0.2% Conversion of on-river ag use to AZ On-River 0.1%
                                                          AZ On-River 0.1% Growth
                              conditions                                                     and tribal areas            Growth              on-river M&I use              Growth
Demand
                     CAP Contract allocation and                                        CAP Contract allocation and      Medium CAP          CAP Contract allocation and      Medium CAP
                                                            Medium CAP Growth
CAP Utilization     utilization (slow/medium/fast)                                     utilization (slow/medium/fast)      Growth           utilization (slow/medium/fast)      Growth

Scenario Theme                                    4                                                           5                                             High Impact

                  Future effects of climate variability       Downscaled-GCM          Drier and increased temperatures Pluvial-removed             Drier conditions             Stress Test
Hydrology
                  Decrease in tributary streamflow                                                                                                                           2012 Basin Study
                                                                                      UB growth based on recent trends UB Guidelines
                  for ag diversion (Intermediate UB        2016 UCRC UB Growth                                                                   Higher UB demands            Current Trends
                                                                                                 (Low use)             Period Average
                               demand)                                                                                                                                           Growth
UB Demand
                                                                                                                           On-River
                  Increase in demands/ag CU due to                                    Conversion of on-river ag use to                                                       AZ On-River 0.2%
                                                                0.2% Growth                                            Guidelines Period     Higher Az On-River demands
AZ On-River                 climate change                                                   on-river M&I use                                                                    Growth
                                                                                                                           Average
Demand
                     CAP Contract allocation and                                        CAP Contract allocation and      Medium CAP        Fast CAP Contract allocation and
                                      30                      Fast CAP Growth                                                                  May utilization
                                                                                                                                                      25, 2021              Fast CAP Growth
CAP Utilization     utilization (slow/medium/fast)                                     utilization (slow/medium/fast)      Growth
ARC Arizona Strategy Team
Overview and Update
                              • Strategy Team to examine:
            Basin
                                 • Negotiating strategies to
           States
                                   approach the Basin States and
           Arizona
                                   Federal processes, and
           Strategy
            Team                 • Legal implications of new
                                   operating rules and related
        Technical Work             proposals
           Groups
                              • Will meet as necessary
                                 • First meeting was held in April
     Arizona Reconsultation        2021
        Committee (ARC)

31                                                       May 25, 2021
Basin States Reconsultation
Process Update
• The Basin States Principals have had preliminary
  discussions regarding development of a Basin
  States process.
• Overall, Arizona is well prepared and situated to
  work through the Basin States Reconsultation
  process.
• Basin States representatives have conducted
  targeted outreach to Tribes and NGOs.

32                                             May 25, 2021
Reclamation’s Reconsultation
Process Update
• Under the 2007 Interim Guidelines the United States and
  the Basin States have a mutual requirement to consult with
  each other.
• Arizona, with the six other Basin States, initiated formal
  consultation with a letter to the Secretary of the Interior on
  December 20, 2020
• Tanya Trujillo was nominated for the position of Assistant
  Secretary for Water and Science at the Department of the
  Interior. Senate Energy & Natural Resources Committee
  vote is scheduled for Thursday, May 27.
     • No nominee for Commissioner of Reclamation
     • No named replacement for Lower Colorado Regional Director

33                                                           May 25, 2021
ARC Next Steps
- ADWR and CAWCD staff complete modeling
  of the refined initial conditions scenarios
- MAWG Follow Up Meeting:
     - Targeting end of August
- Arizona Strategy Team:
     - Meet as appropriate
- ARC Meeting Fall 2021

34                                      May 25, 2021
Call to the Public

Submit questions or comments using the
electronic public comment form at
cap-az.com/ARC.

35                                       May 25, 2021
For continued information
         and updates, visit
     new.azwater.gov/ARC or
         cap-az.com/ARC
36
You can also read