Asian Auckland: The multiple meanings of diversity
←
→
Page content transcription
If your browser does not render page correctly, please read the page content below
Asian Auckland:
The multiple
meanings of diversity
Author Wardlow Friesen

February 2015

ISBN 978-0-9876637-8-8 (online PDF)
© Asia New Zealand Foundation
Disclaimer: Comments made in this research report do not
                                                                                 R
necessarily represent the views of the Asia New Zealand Foundation.   Report   Research
Contents
3    About the author

5    Introduction

8	Asian migration and settlement: the national context

17	Asian migration and settlement in Auckland

28	The evolving Asian ‘ethnoscapes’ of Auckland

39   Characteristics of Asian populations of Auckland

53   Conclusion

57   Appendix

                                                   Asian Auckland: The multiple meanings of diversity   2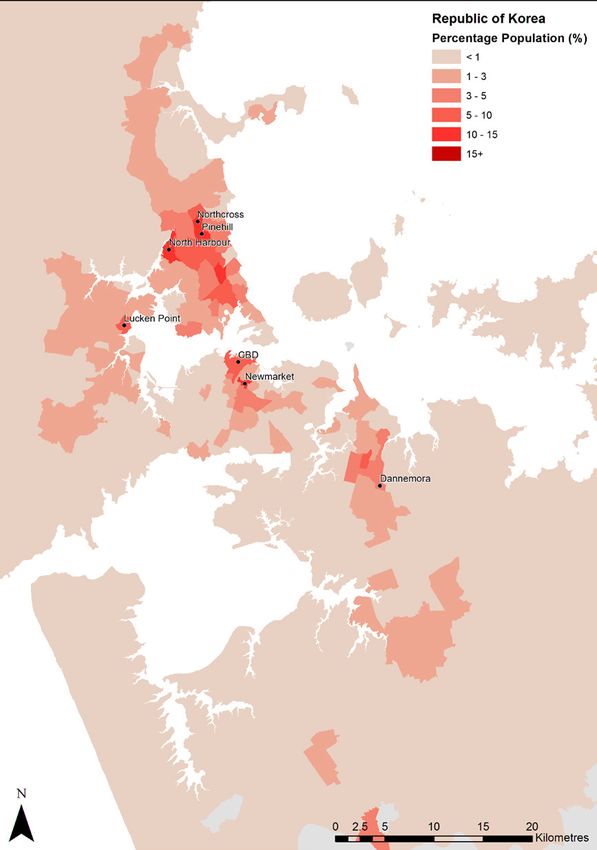
About the author

                   1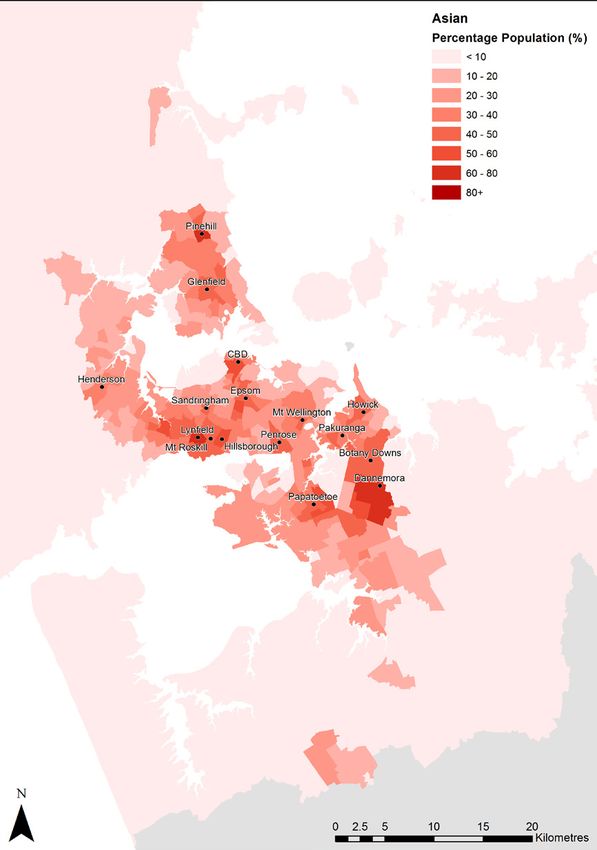
About the author
Dr. Friesen is currently Senior Lecturer in Geography in
the School of Environment at The University of Auckland.
His research focus for a number of years has been in the
areas of migration and ethnic change, and research and
publication have focused on various groups including
Pacific, Chinese and Indian migrants. Other areas of
research have included population change, international
education, development in the Pacific, and urban change,
with regional focuses including New Zealand, the Pacific
islands and Asia; areas in which he has travelled widely.

He is a regular commentator in the media on these and
related issues. Between 2005 and 2007 he served as
President of the Population Association of New Zealand
(PANZ) and he remains active in this association. At the
University of Auckland, he currently serves on the Centre
for Pacific Studies Board of Graduate Studies and the
Development Studies Advisory Committee. He also has
considerable experience in consultancy on demographic
issues and their planning implications at the national,
regional and local levels. He has supervised over
70 graduate theses and dissertations, including
11 Ph.Ds. on a range of topics.

                                                            Asian Auckland: The multiple meanings of diversity   4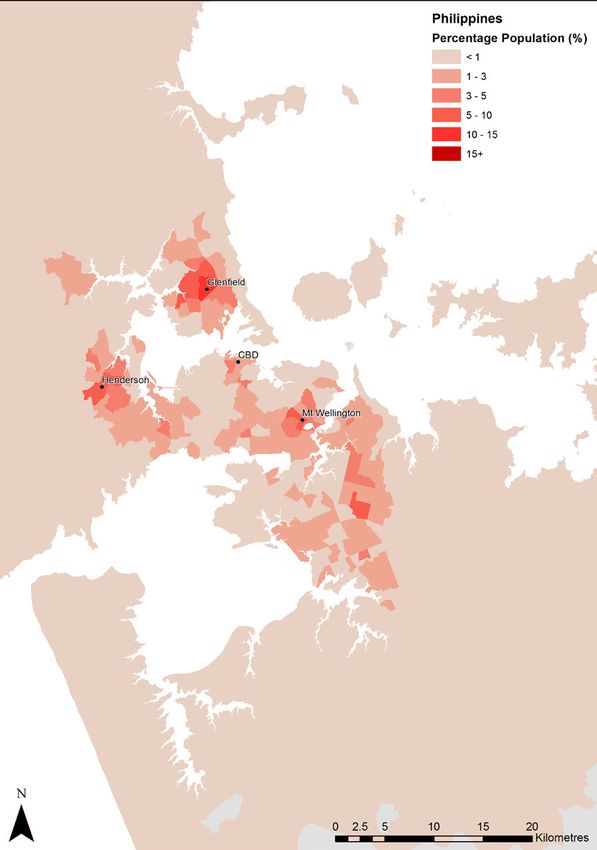
Introduction

               2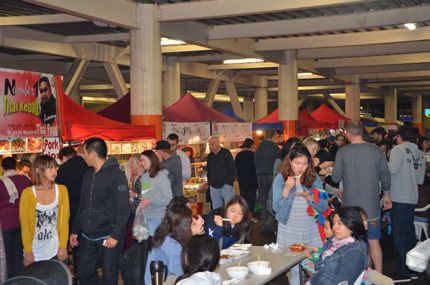
Introduction
This report considers Auckland’s increasingly diverse          DEFINING ‘ASIAN’
and rapidly growing Asian population. In detailing the
                                                               Much of the attention paid to ‘Asian Auckland’ in recent
history and trends of Asian migration to the city and
                                                               years has related to the increase in immigration to
the ethnicities, locations and demographic and other
                                                               New Zealand from countries in Asia. However, as well
characteristics of Asian groups, it provides insights into
                                                               as those migrants who originate in Asian countries,
the Asian ‘ethnoscape’ and the contribution that Asians
                                                               there is also a significant New Zealand-born population
are making to their communities and to Auckland as a whole.
                                                               of Asian ‘ethnicity’.

EMPLOYING CENSUS AND OTHER DATA
                                                               This report uses both birthplace and ethnic identification
The content of this report is largely based on data from the   data in considering Asian Auckland. Birthplace data
2013 New Zealand census, which was originally scheduled        enables us to discuss migrant populations originating in
for March 2011 but postponed after the February 2011           Asian countries, and to consider the places and patterns
Christchurch earthquake. It is supplemented by information     of migrant settlement and their impacts on Auckland.
from a variety of other sources.                               Ethnicity data facilitates an assessment of the situation
                                                               of the broader groups, including the descendants of earlier
The 2013 census took place 25 years after the enactment        migrants and the children of recent migrants.
of the Immigration Act 1987, which comprehensively
changed New Zealand’s immigration system and resulting         While ‘Asian’ is widely used to describe a broad ‘ethnic’
urban ethnoscapes, especially in Auckland. The report          affiliation (mainly for statistical purposes), it is important
reviews some of the changes in this quarter century,           to note that relatively few people consider it their primary
focusing especially on those since the 2006 census.            ethnic identity; instead, they identify with national identities
                                                               such as Chinese, Indian, Korean and Filipino. It should also
                                                               be recognised that, within these categories, there are
                                                               many more specific ethnic identities, such as Cantonese,
                                                               Sichuan, Gujarati and Tamil. However, census data
                                                               does not allow a comprehensive analysis at this level.

                                                                                       Asian Auckland: The multiple meanings of diversity   6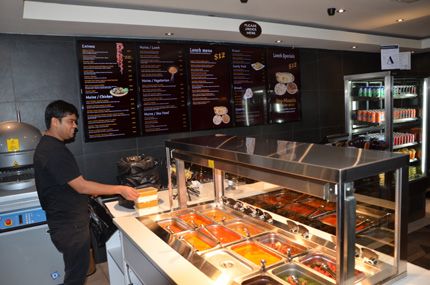
THE STRUCTURE OF THE REPORT
The report has four main sections:

• Section One considers migration and settlement in              • Section Three provides examples of the recently
  the national context, particularly since the 1987                evolving ethnoscapes in Auckland. It highlights the
  immigration policy changes, which have had profound              idea that, while there is debate about the merits of
  effects on the country’s ethnic composition, especially          (Asian) immigration, many aspects of Asian ethnoscapes
  in Auckland. The section emphasises that points-based            have value for both the migrants and the wider
  permanent residence immigration is just one contributor          population. These ethnoscapes are represented in
  to diversification; other migration categories include           the neighbourhoods where migrants live, the foods
  temporary work migration, international student                  they consume and sell, the festivals that celebrate
  movements and humanitarian migration.                            their cultures, and some less tangible aspects of
                                                                   the Asian ‘presence’ in Auckland.
• Section Two reviews the migration and settlement patterns
  of Asian migrants who have settled in the Auckland region.     • Section Four considers the demographic and other
  It describes the growing significance of this population in      characteristics of Auckland’s Asian population(s),
  Auckland, the timings of immigration according to migrant        covering topics such as demographic structures,
  groups, the relationship of ethnicity to birthplace, and the     education and language skills, labour force characteristics
  geographic spread of Asian settlement – all factors that         and religion. Once again, it emphasises diversity, in the
  show there is no singular ‘Asian migration’ as the media         demographic structures of different Asian groups and
  and politicians sometimes imply.                                 in indicators of education, language skills and labour
                                                                   force participation. It also reveals another type of
                                                                   diversity, both within and between Asian ethnic groups,
                                                                   through religious affiliation.

                                                                                    Asian Auckland: The multiple meanings of diversity   7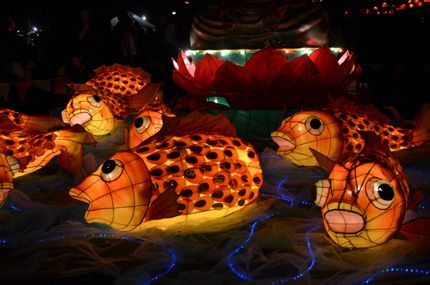
Asian migration
and settlement:
the national context

                  3
Asian migration
and settlement:
the national context
This section considers the patterns of migration from                            circumstances, as well as changes in the country of origin
Asia to New Zealand. It starts with a discussion of                              – seen, for example, in the sharp increase in migrants from
permanent residence migration, the form of immigration                           Hong Kong leading up to its reintegration with the Peoples’
usually considered to have the greatest long-term impacts                        Republic of China (hereafter China), and the sudden
on both migrants and the host society. It then discusses                         increase from Taiwan when political tensions increased
other forms of migration that have become increasingly                           with the China in the mid-1990s. More generally,
important in recent years, including student migration,                          liberalised regimes governing the movement of people
the arrival of workers on short- to medium-term visas,                           and capital (including China’s) have affected the number
and humanitarian immigration. The last has been a feature                        of migrants to New Zealand.
of New Zealand’s immigration programme for many years,
leading to the establishment of significant refugee                              This increase in migrant numbers from Asian countries
populations with Asian origins.                                                  in the early 1990s paralleled two developments:
                                                                                 increased economic, political and cultural connections
PERMANENT RESIDENCE TRENDS                                                       between New Zealand and Asia; and the establishment
                                                                                 of the Asia New Zealand Foundation in 1994 (originally
The Immigration Act 1987 signalled a turning point in
                                                                                 as the Asia 2000 Foundation), with the goal of increasing
New Zealand’s migration history. While earlier immigration
                                                                                 New Zealanders’ awareness and knowledge of Asia.
policy had been based on ‘preferred country of origin’, the
new Act prioritised migrants’ particular characteristics,                        Since the last Asia New Zealand Foundation report on
especially age, education level, work experience and the                         Asian Auckland, published after the 2006 Census,1 there
ability to bring capital investment into New Zealand. In                         have been some notable changes in immigration trends.
1991 a points system was implemented, which quantified
these characteristics.                                                           The number of permanent residence migrations from the
                                                                                 two largest Asian countries of origin, China and India,
These changes have led to much greater diversity in                              have never returned to the peak seen in the earlier part
migrants’ countries of origin. While the United Kingdom and                      of the decade, but have fluctuated around an average
Pacific countries have remained significant, the countries                       of 6,000 and 4,000 a year respectively. The Philippines
of Asia have become important new migrant sources.                               has been the only country with a significant increase
                                                                                 since 2006, rising to between 3,000 and 4,000 per year.
Figures 1 and 2 show the number of permanent residence
                                                                                 This has been partly facilitated by ‘work to residence’
approvals for migrants from the countries of East Asia
                                                                                 schemes, which have become more important in this time.
and South and Southeast Asia from April 1987 to March
2013 (‘March years’). It is notable that the trend of each
country relates to changes in New Zealand’s immigration
policy and overall economic, social and political

1	Friesen, W. (2008). Diverse Auckland: the face of New Zealand in the 21st century? Asia New Zealand Foundation, Wellington.

                                                                                                          Asian Auckland: The multiple meanings of diversity   9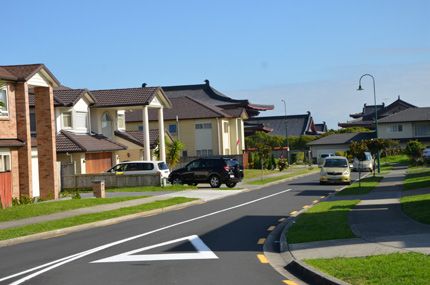
Figure 1. Number of permanent residence approvals from
selected North Asian countries 1987-2013 (March years)
Figure 1. Number of permanent residency approvals from selected
North Asian countries 1987-2013 (March years)
12,000
10,000
8,000
Numbers of permits and visas
6,000
4,000
2,000
0
87
88
89
90
91
92
93
94
95
96
97
98
99
00
01
02
03
04
05
06
07
08
09
10
11
12
13
19
19
19
19
19
19
19
19
19
19
19
19
19
20
20
20
20
20
20
20
20
20
20
20
20
20
20
Year
China Hong Kong Japan South Korea Taiwan
Data source: Immigration New Zealand
Asian Auckland: The multiple meanings of diversity 10Figure 2. Number of permanent residence approvals from selected
South and Southeast Asian countries 1987-2013 (March years)
Figure 2. Number of permanent residency approvals from selected
South and Southeast Asian countries 1987-2013 (March years)
12,000
10,000
8,000
Numbers of permits and visas
6,000
4,000
2,000
0
87
88
89
90
91
92
93
94
95
96
97
98
99
00
01
02
03
04
05
06
07
08
09
10
11
12
13
19
19
19
19
19
19
19
19
19
19
19
19
19
20
20
20
20
20
20
20
20
20
20
20
20
20
20
Year
India Sri Lanka Malaysia The Philippines Thailand
Data source: Immigration New Zealand
Asian Auckland: The multiple meanings of diversity 11As is the case in other migrant settlement countries, As shown in Table 1, several Asian countries of origin
‘permanent residence’ migrants in New Zealand are not showed a decrease in New Zealand resident populations
always permanent. Immigration New Zealand data between 2006 and 2013. The most notable was South
suggests that about 28 percent of all permanent Korea, which declined by about 2,200 people as a result
residence migrants arriving between 1998 and 2011 of both relatively low levels of immigration (as shown in
had left New Zealand for six months or more by the end Figure 1), on-migration to other countries and returns
of 2011.2 Among Asian migrants this number varied to Korea.4 The decline in populations from Taiwan and
between countries of origin, with China as high as Hong Kong also appeared to result from return migration.
40 percent and India at about 32 percent. Many of
the ‘outmigrants’ from China had come in the ‘Investor’
category, with much lower rates among those who had
originally arrived on work or student visas. The greatest
number of outmigrants from India had come in the ‘Capped
Family Stream’, with a rate of only 18 percent for those
who had come on work or student visas.3
Table 1 shows the outcomes of immigration trends
between the 2006 and 2013 censuses. Asian countries
of origin that increased are shown in red (bolded)
and those that decreased are shown in blue (bolded).
In absolute terms, the largest increase was of about
24,000 from India, a proportionate increase of
55 percent. Close behind, at about 22,000, were the
additional number born in The Philippines – the greatest
proportionate increase of any country at 144 percent.
The significant increase of about 15,000 in those
born in Fiji (not an Asian country) is important because
most of these new migrants were of Indo-Fijian origin.
The next largest increase from Asian countries was
from China, with a net gain of about 11,000 people
between the censuses; however, this represented an
increase of only about 14 percent. Other Asian countries
with increases of 1,000 people or more were, in rank
order, Sri Lanka, Malaysia, Thailand and Vietnam.
In proportionate terms there were increases of 10 percent
or more from Sri Lanka, Pakistan, Vietnam, Thailand,
Afghanistan, Malaysia, Cambodia and Singapore.
For each of these there are country-specific explanations
related to political and economic conditions.
2 Ministry of Business, Innovation and Employment. (2012). Migrants in New Zealand: retention and onward migration, 1998-2011. MBIE, Wellington.
3 Ibid., p. 13.
4 See Lee, J. Y. (2012). Return migration of young Korean New Zealanders: transnational journeys of reunification and estrangement. PhD thesis,
The University of Auckland, Auckland.
Asian Auckland: The multiple meanings of diversity 12Table 1. Forty largest usually resident populations in New Zealand
Birthplace 2006 2013 No. change % Change
Total people 4,027,947 4,242,048 214,101 5.3
New Zealand 2,960,217 2,980,827 20,610 0.7
England 202,401 215,589 13,188 6.5
China, P.R. 78,117 89,121 11,004 14.1
India 43,344 67,176 23,832 55
Australia 62,634 62,613 -21 0
South Africa 41,676 54,279 12,603 30.2
Fiji 37,746 52,755 15,009 39.8
Samoa 50,649 50,658 9 0
The Philippines 15,285 37,299 22,014 144
Korea, Republic of 28,806 26,604 -2,202 -7.6
Scotland 29,016 25,953 -3,063 -10.6
Tonga 20,520 22,413 1,893 9.2
U.S.A. 17,751 21,462 3,711 20.9
Netherlands 22,101 19,815 -2,286 -10.3
Malaysia 14,547 16,350 1,803 12.4
Cook Islands 14,697 12,954 -1,743 -11.9
Germany 10,761 12,945 2,184 20.3
Japan 9,573 10,269 696 7.3
Sri Lanka 7,257 9,582 2,325 32
Taiwan 10,764 8,988 -1,776 -16.5
Canada 8,994 9,576 582 6.5
Ireland 6,888 9,042 2,154 31.3
Zimbabwe 8,151 8,100 -51 -0.6
Thailand 6,159 7,722 1,563 25.4
Hong Kong (SAR) 7,686 7,059 -627 -8.2
Wales 6,756 6,708 -48 -0.7
Cambodia 5,853 6,570 717 12.3
Vietnam 4,875 6,153 1,278 26.2
Iraq 6,024 5,481 -543 -9
Russia 4,581 5,469 888 19.4
Singapore 4,857 5,370 513 10.6
Indonesia 4,614 4,911 297 6.4
Northern Ireland 4,776 4,713 -63 -1.3
Niue 4,851 4,197 -654 -13.5
France 2,475 3,762 1,287 52
Brazil 1,761 3,588 1,827 103.7
Iran 2,793 3,084 291 10.4
Switzerland 3,012 3,066 54 1.8
Pakistan 2,211 2,853 642 29
Afghanistan 2,145 2,445 300 14
Asian Auckland: The multiple meanings of diversity 13Other Migrations: Workers, Refugees, Students refugees by nationality were from Myanmar, with 1,952
Burmese refugees arriving between July 2006 and June
Workers
2013. The next largest group were 774 Bhutanese,
There is a great variety of work visas besides those mostly of Nepalese ethnicity and arriving mainly from
related to permanent residence. Most allow a migrant Nepal following their expulsion from Bhutan. The fourth
to stay and work in New Zealand for up to three years, largest group were 453 of Afghani nationality, a result
with the exception of the ‘Essential Skills’ visa, which of the ongoing conflict in Afghanistan (large numbers
may allow residence for up to five years. Most short- to had also arrived in the years before the 2006 census).
medium-term visas require the applicant to have a high
level of education or skill, have a particular skill in demand It is not possible to determine from the census how many
in New Zealand, or be the partner of someone qualifying of these refugees settled in Auckland, as immigration
in another category. They require a minimum level of status is not counted. However, considering the locations
English language competency and in many cases a job during the census of these national populations, which are
offer in New Zealand, although a more general ‘work mostly made up of refugees, it can be inferred that about
search’ visa is possible for those with high levels of half of the Burmese, two-thirds of the Afghani and almost
education or skill. none of the Bhutanese refugees settled in Auckland. Most
of the Bhutanese refugees were settled in Palmerston
Most countries of Asia have supplied work migrants in North, with other communities in Christchurch and Nelson.6
recent years, with an annual average of about 65,000
qualifying a year. Between July 2008 and June 2013 Students
India was the largest source of short- to medium-term
New Zealand has promoted itself as a destination for
work migrants, with an average of 18,100 per year,
international students since the 1990s. From the
followed by China (16,027), the Philippines (8,225),
mid-1990s the number of international students rose
South Korea (5,722), Japan (4,659), Malaysia (3,700),
steadily, peaking in 2002 at about 120,000 before
Thailand (2,899), Indonesia (1,561), Taiwan (1,273)
declining to average about 94,000 per year in the
and Sri Lanka (1,173).5
following decade. This level was maintained from 2006
to 2013, with an annual average of 56,000 originating
The ‘Working Holiday’ visa is targeted at people aged
in Asian countries.7
18 to 30 coming to New Zealand primarily for a holiday,
with work or study as a secondary purpose. For most
China has consistently been the largest source of
Asian source countries people on this visa are allowed
international students, although a significant decline
to stay up to 12 months, with the exceptions of Malaysia
occurred between 2006 and 2008, followed by a modest
and Singapore where the maximum is six months.
reversal (Figure 3). The other largest Asian sources of
Between July 2008 and June 2013 the average annual
international fee-paying students in recent years have
number of Working Holiday visa approvals was: Korea
been South Korea, Japan and India, with the first two of
1,862, Japan 1,774, Malaysia 1,196, China 951,
these declining recently and the latter increasing
Taiwan 604, Hong Kong 368, Thailand 93, Singapore
significantly (Figure 3).
91 and Vietnam 20. (Note applicants from Vietnam
and The Philippines became eligible in 2013.) Within these four countries of origin there have been
considerable variations in the types of education being
Refugees
undertaken; in 2013 35 percent of the Korean
New Zealand’s refugee quota through the United Nations students were in primary and secondary education,
High Commissioner for Refugees, of about 750 a year, Japan 22 percent, China 15 percent and India less than
has contributed to new Asian populations in New Zealand. one percent. The largest proportion of international
Since the previous census in 2006, the largest number of students was in private training establishments,
5 Original data extracted from Immigration New Zealand, www.immigration.govt.nz/migrant/general/generalinformation/statistics, accessed May 15, 2014.
6 See Department of Labour. (2011). The Bhutanese refugee resettlement journey (3 volumes). Labour and Immigration Research Centre, DOL, Wellington.
7 Original data for this paragraph extracted from Education Counts.
Asian Auckland: The multiple meanings of diversity 14with some variations between countries: India 66 percent,
Japan 49 percent, China 43 percent and Korea 41 percent.
India had the highest proportion in polytechnics at
25 percent, followed by China 15 percent, Japan seven
percent and South Korea six percent. Auckland was the
main centre of international education, with 60 percent
of all international students located there.
The political context of immigration
Although there seems to have been consensus among
most political parties in recent years that immigration
is important to the country’s future, there is still some
debate about immigration issues. The topic has entered
the public discourse through the media and politicians’
statements, with debates on subjects including the net
migration level and its impacts, especially on the price
of housing in Auckland.
In the year to mid-2014 New Zealand had close
to 100,000 permanent and long-term arrivals,
resulting in the highest net migration level for a decade
(about +38,000). This led to calls to ‘cut immigration’,
implying a reduction in the targets for permanent
residence. However, the reality was that permanent
residence levels had declined slightly in the preceding
three years, then returned to a level similar to the average
for the previous decade. The increased net migration was
a result of two factors: the Australian economic downturn
resulting in fewer New Zealanders heading there and more
coming back; and the increase in short- to medium-term
work visas, especially in relation to the post-earthquake
Christchurch rebuild and young people entering on
Working Holiday visas.
The public debate, however, illustrates that immigration
remains a sensitive issue, despite the sense that
politicians, and New Zealanders more generally, have
increasingly accepted that significant benefits result from
immigration and increased diversity. In comparison with
reactions to high immigration levels in the mid-1990s,
the public and political responses 20 years later do not
seem to have generated the same level of negativity.
Asian Auckland: The multiple meanings of diversity 15Figure 3. Number of international fee-paying students in New Zealand,
by Asian country of origin, 2006 to 2013
Figure 3. Number of international fee-paying students in New Zealand from Asian countries 2006-2013
35,000
30,000
25,000
Numbers of permits and visas
20,000
15,000
10,000
5,000
0
2006 2007 2008 2009 2010 2011 2012 2013
Calendar Year
China (incl. Hong Kong) South Korea Japan India
Thailand Taiwan Malaysia Vietnam
The Philippines Indonesia Sri Lanka
Data source: Education Counts
Asian Auckland: The multiple meanings of diversity 16Asian migration
and settlement
in Auckland
4Asian migration
and settlement
in Auckland
The timing of Asian migration to Auckland also from Malaysia, Hong Kong, Singapore, Vietnam and
Cambodia. Many of those from the last two countries
Figure 4 illustrates the relative importance to Auckland
arrived as refugees in the 1970s and 1980s.
of Asian migrants arriving after the immigration changes
of 1987. It shows the net change between censuses Figure 5 shows that some countries have a high
of migrants according to their birthplaces, so is a proportion who are ‘early new policy migrants’ (arrived
summary of both arrivals and departures (the latter 1987-1996). This is the case for Taiwan, Hong Kong and
including deaths). Malaysia, from which specific circumstances encouraged
emigration in the early 1990s, with relatively modest
While immigration from the UK and Ireland has continued
subsequent movements. In proportionate terms, ‘middle
since 1987, their total population in Auckland has
migrants’ (arrived 1997-2006) were especially significant
declined slightly owing to the ageing and possible demise
for the three largest source countries: China, India and
of earlier migrants, although with a revival after 2001
South Korea. ‘New migrants’ (arrived 2007-2013) are
with a new cohort of migrants. In the same period the
most important in relative terms for the Philippines, with
number of Pacific-born migrants has more than doubled
more than half of all the usual residents in Auckland having
and the Asia-born population has increased by about
arrived in the most recent intra-censal period.
16 times. By 2013 the Asia-born population comprised
more than 200,000 usual residents. This period was also significant for the two largest
migrant origin countries, China and India, especially
Figure 5 shows the resident population of Auckland
the latter in proportionate terms, with just over
in 2013, which is the result of immigration inflows
40 percent of all residents arriving in this period.
and outflows from Asian countries over many years.
Of the smaller migrant origin countries, ‘new migrants’
It shows the 10 Asian countries of birth with the largest
were especially significant for Japan, Pakistan and
populations in Auckland in 2013, according to the time
Myanmar (the latter two not shown in Figure 5), with
periods in which they arrived in New Zealand. These
40 percent or more of their resident populations
arrival periods are important in relation to issues of
arriving between 2007 and 2013.
settlement and integration, and have an impact on
the characteristics of migrants from each country.
Although relatively few Asia-born migrants arrived before
1987, there were some populations of note. The largest
number of ‘old immigration policy migrants’ were from
India, and it should be noted that a similar number of
Indian migrants in this period came from Fiji (not shown
on this graph). The second largest number of earlier
migrants were from China, with significant numbers
Asian Auckland: The multiple meanings of diversity 18Figure 4. Number of overseas born by area of birth, Auckland residents 1986-2013
Figure 4. Number of overseas born by area of birth, Auckland residents 1986-2013
225,000
200,000
175,000
150,000
Number in Auckland
125,000
100,000
75,000
50,000
25,000
0
Australia Pacific Islands UK and Ireland Asia Other
Birthplace
1986 1991 1996 2001 2006 2013
Data source: New Zealand censuses 1986-2013
Asian Auckland: The multiple meanings of diversity 19Figure 5. Migrants of Asian origin by period of arrival
Figure 5. Migrants born in Asian countries (10 largest sources), in Auckland 2013 by period of arrival
70,000
60,000
Auckland usually resident population in 2013
50,000
40,000
30,000
20,000
10,000
0
China India South The Malaysia Taiwan Sri Lanka Hong Kong Japan Vietnam
Korea Philippines
Birthplace
New migrant Middle migrant Early new Old policy migrant Arrival
(arrival 2007-2013) (arrival 1997-2006) policy migrant (arrival before 1987) unknown
(arrival 1987-1996)
Data source: Statistics New Zealand 2013 Census customised data
Asian Auckland: The multiple meanings of diversity 20Asians in Auckland by birthplace • For most Asian ethnicities shown in the table, a single
country of origin is predominant, even in the cases
The data discussed so far relates to ‘migrant’ populations,
where there are significant diasporas. Probably the
but it is important to note that a significant proportion of
most evident case is Filipino, which has a large diasporic
those identifying with an Asian ethnicity in the 2013
population but the great majority in New Zealand were
census were born in New Zealand (about 21 percent).
born in the Philippines. Of course this does not exclude
the possibility that some were resident in other countries
Table A (Appendix) compares country-of-birth data
before coming to New Zealand.
with ethnicity data from the 2013 census. It reveals
a number of patterns:
Geographical distribution of Asian populations
• The earlier refugee populations have relatively high
in Auckland
proportions born in New Zealand, as shown for Laotian,
Cambodian and Vietnamese. Figure 6 shows the geographical distribution of all those
who identified with an Asian ethnicity in the 2013 census.
• Over 20 percent of the Chinese and Indian populations
As mentioned earlier, this classification includes both
are New Zealand born. Some of these are descendants
migrant and New Zealand-born populations, and ‘Asian’
of much earlier migrations from the 19th century
is not the primary identity for most people. Nevertheless,
onwards, while others are the children of more recent
Figure 6 represents an aggregate impression of the
migrants. These proportions have risen since 2006 as
presence of Asians in Auckland.
a result of recent migration.
• Koreans had the lowest proportion of New Zealand- Significant clusters can be seen in the newly developed
born in 2013, due to their relatively recent immigration housing areas around Botany Downs and Dannemora,
and significant levels of out-migration and return where three Census Area Units (CAUs), which may be
migration to Korea. This proportion was about twice approximated to suburbs, have between 60 and
the level of 2006, resulting from the longer-term 80 percent of their populations classified as Asian.
average residence period since the previous census. Throughout Auckland 15 CAUs have more than
50 percent Asian populations – in the southeast, in the
• Those of Chinese ethnicity come from a diverse
central business district (CBD), in various parts of the
range of birthplaces, reflecting the global Chinese
Auckland isthmus and in central parts of the North Shore.
diaspora. As well as China and New Zealand, significant
In some cases these concentrations are largely Chinese
birthplaces for those of Chinese ethnicity in 2013
or Indian, but in others there is a considerable mixture
were Malaysia, Taiwan, Hong Kong (SAR), Singapore,
of these and other groups. Thus it is useful to consider
Cambodia, Vietnam and Indonesia, with more than
the distribution of specific migrant groups.8
800 migrants arriving from each of those places.
Pacific origins were notable for Chinese too, with The geographical distribution of Auckland’s Asian
nearly 500 each from Fiji and Samoa. population varies considerably between groups.
• In the early 1990s the birthplace origins of the Indian The largest and mostly widely dispersed migrant group
population were almost equally split between India, Fiji is from China. Figure 7 reveals several clusters of China-
and New Zealand. By 2013 ongoing immigration from born migrants, with the most obvious in the areas ranging
India had made this the largest place of origin, although from Pakuranga and Howick south towards relatively
India still only accounts for about 40 percent of the newer areas of settlement around Botany Downs and
population, with another 30 percent from Fiji. Other Dannemora, where China-born migrants comprise more
countries of the Indian diaspora, such as South Africa than 10 percent of nearly all CAUs.9 Migrants from China
and Malaysia, stand out as significant birthplaces. are widespread within the Auckland isthmus, especially
in the central and western areas and the CBD, which Xue
and colleagues at the University of Auckland identify as
distinctive ‘ethnoburbs’.10
8 Interactive maps for both ethnic groups (aggregated and detailed) and ethnicity can be found at www.censusauckland.co.nz/census-area-unit-view.
9 Note the very different keys between Figure 6 and Figure 7 and subsequent maps.
10 Xue, J., Friesen, W., & O’Sullivan, D. (2012). Diversity in Chinese Auckland: hypothesising multiple ethnoburbs. Population, Space and Place, 18(5), 579-595.
Asian Auckland: The multiple meanings of diversity 21Figure 6. Distribution of Asian population in Auckland
Asian Auckland: The multiple meanings of diversity 22Another cluster of China-born population is obvious; running The most rapidly growing Asian migrant group between
through the centre of the North Shore area, it has increased the 2006 and 2013 censuses was from The Philippines.
considerably since the 1990s and includes other Asian As Figure 10 shows, the largest cluster of Filipino
groups, especially Korean and Filipino. migrants is on the North Shore in and around the suburb of
Glenfield – an area of medium-cost housing in comparison
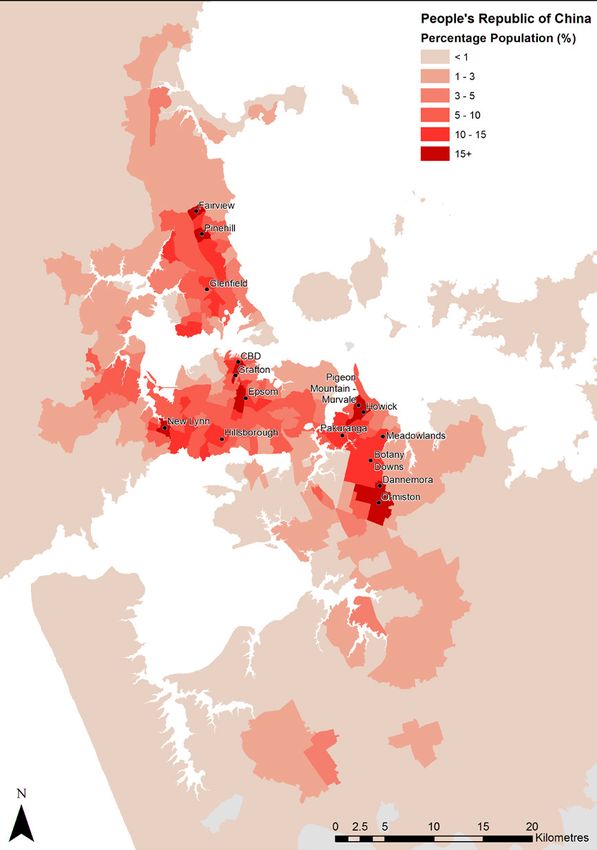
Figure 8 reveals that the distribution of migrants from with the coastal areas further east. Other clusters can be
India has similarities with and differences from that of found in suburbs such as Henderson in the west, Mount
migrants from China. There are concentrations in some Wellington in the isthmus and Donegal Park, a relatively
of the newer areas around Botany Downs and Dannemora, new suburb in the south.
although most of these comprise less than 10 percent of
the populations. In the south there are India-born clusters Smaller Asian-born groups have distinctive population
in Papatoetoe and Manurewa, which are distinctive from clusters in Auckland. Those from Taiwan and Hong Kong
the China-born patterns. On the Auckland isthmus, have settled in many of the same areas as migrants from
especially in the central western area, there are the PRC, especially the newer suburbs of South Auckland.
similarities in the distribution of migrants from India and Vietnamese and Cambodian populations have been
China, most notably in Sandringham, Mount Roskill and concentrated for many years in south-central areas
Hillsborough. These are areas of ‘middling’ cost housing, such as Ōtāhuhu, Papatoetoe and parts of Manukau.
so a range of migrant groups find these areas affordable.11
Migrants from India also make up more than five percent
of the populations of many of the adjacent areas, and
when other Indian groups are included, especially from
Fiji, the proportions exceed 10 percent in some cases.
A notable difference between Indian and other Asian
groups is that there are relatively few Indian groups in
the North Shore area.
Since the upsurge in migration from Korea in the mid-1990s,
the North Shore area has been the focus of Korean
settlement, with several CAUs near Northcross and Forrest
Hill having more than 10 percent of their populations born
in South Korea (Figure 9). These proportions are similar
to those at the 2006 census, as Korean immigration
has slowed considerably in recent years.
11 Friesen, W., Murphy, L., & Kearns, R. A. (2005). Spiced-up Sandringham: Indian transnationalism and new suburban spaces in Auckland, New Zealand. Journal of
Ethnic and Migration Studies, 31(2), 385-401.
Asian Auckland: The multiple meanings of diversity 23Figure 7. Distribution of of PRC-born in Auckland
Asian Auckland: The multiple meanings of diversity 24Figure 8. Distribution of India-born population in Auckland
Asian Auckland: The multiple meanings of diversity 25Figure 9. Distribution of Korea-born population in Auckland
Asian Auckland: The multiple meanings of diversity 26Figure 10. Distribution of Philippines-born population in Auckland
Asian Auckland: The multiple meanings of diversity 27The evolving
Asian ‘ethnoscapes’
of Auckland
5The evolving
Asian ‘ethnoscapes’
of Auckland
The ‘clustering’ of ethnic groups has been described in As larger and more diverse Asian populations settle
various ways. While this report has referred to Chinese in Auckland, its Asian ethnoscapes continue to evolve,
clusters in ‘ethnoburbs’ in the Auckland region (based on creating new and different spaces and senses of place.
their residential distribution and business activities),12 The following section presents several aspects of
other studies have used the terms ‘ethnic enclaves’ and these ethnoscapes, with brief accompanying case
‘ethnic precincts’ to describe clusters of Asian ‘ethnic’ studies as examples.
enterprises in areas or along major roads, such as
Dominion Road.13 Residential neighbourhoods
Figures 7 to 10 show that different Asian groups have
The concept of ‘ethnoscape’ is another way of viewing
settled in diverse parts of the Auckland region, with
the ways in which Asian migrants have had an impact
distinctive concentrations according to group.
in Auckland. Coined by Arjun Appadurai, an anthropologist
at New York University, it describes, “the landscape of There are several types of concentration in terms of
persons who constitute the shifting world in which we suburb age and housing type. The largest proportionate
live: tourists, migrants, refugees, exiles, guestworkers increases have been in ‘greenfields’ suburbs comprising
and other moving groups and persons”, and by implication areas of new housing and retail outlets. In south Auckland,
the phenomena associated with them.14 new suburbs have spread southward from Howick since
the early 1990s, such as Sommerville/Meadowlands,
Ethnoscapes are related to, but different from, enclaves
Botany Downs and Dannemora. Most have high proportions
and precincts. Some aspects of ethnoscapes are tangible
of Asian populations, with Chinese usually the largest
and visible in the landscape, such as people, shops,
group and Indian and Korean also significant. There has
restaurants, houses and places of worship. Also tangible,
also been a great deal of greenfields development on the
but transitory and only visible at particular times, are
North Shore since the 1990s, with migrants commonly
phenomena such as markets and festivals. Some aspects
locating in the relatively new suburbs of Albany, North
are less tangible, such as language(s) heard in the street
Harbour, Pine Hill and Northcross. In western Auckland,
and used in the media, religious affiliations, ‘public opinion’
greenfields residential growth has taken place in various
as represented by media coverage, art forms and
areas, especially around Henderson and Massey, and
transnational links to other countries.
many Asian migrants have chosen to settle there.
12 See Xue et al. (2012).
13 For example, Cain, T., Meares, C., Spoonley, P., & Peace, R. (2011). Half way house: the Dominion Road ethnic precinct. Integration of Immigrants
Programme: Massey University/University of Waikato; Spoonley, P. & Bedford, R. (2012). Welcome to our world? Immigration and the reshaping of
New Zealand. Dunmore Publishing, Auckland, pp. 241-243.
14 Appadurai, A. (1990). Disjuncture and difference in the global cultural economy. Public Culture 2(2), 1-24; quote on p. 7; this appears to be the
first reference to ‘ethnoscape’; see also Appadurai, A. (1996). Modernity at large: cultural dimensions of globalisation, University of Minnesota Press,
Minneapolis, pp. 48-65. The elaboration of ethnoscapes into physical and transitory and less tangible (metaphysical/cultural) aspects is that of the
author of this report.
Asian Auckland: The multiple meanings of diversity 29A second distinctive type of residential concentration 1980s, but demand quickly built up in the early 1990s
for Asian migrants has been existing residential areas, to drive the construction of many new apartment
notably the relatively expensive housing in eastern buildings. This development paralleled increases in
suburbs such as Epsom and Remuera. These areas both permanent residence migration and international
comprise houses built 50 or more years ago and in students in New Zealand through the 1990s and into
some cases recently built ‘in-fill’ houses facilitated by the new millennium.
subdivisions of residential sections. These suburbs are
zoned for what are seen as prestigious public schools, Case study – Dannemora and Botany Downs:
Auckland Grammar School and Epsom Girls Grammar migrant housing
School, whose reputations appear to be partly related to In the past quarter century, the greatest population
the high average socioeconomic status of the surrounding increase in the Auckland region has happened in the
neighbourhoods. Surveys of Asian migrants have shown residential development ‘corridor’ running from Howick
that, for some, education for their children has been one southward, on the southern ‘metropolitan limits’ of
of the primary motives for moving to New Zealand, Auckland.
with housing in a ‘good’ school zone often desirable.
These limits were designed in the 1990s to prevent
Another type of Asian migrant residential concentration Auckland’s residential development expanding into
are ‘middling’ suburbs, with housing that dates from the adjacent agricultural land (with the exception of some
1930s and is more affordable.15 On the Auckland isthmus lifestyle blocks). The ‘corridor’ can be broadly characterised
this includes suburbs such as Sandringham, Mount Roskill as Dannemora and Botany Downs, although there are
and Hillsborough, which have significant populations of many other suburbs within this broad area. In 1986,
Indians, Chinese and other Asian groups. Areas with before the implementation of the Immigration Act 1987,
similarly priced but more recently built houses include much of this area was agricultural land adjacent to the
North Shore’s Glenfield and Northcote. suburbs of Howick and Pakuranga to the north, and Ōtara
and Papatoetoe to the west. By 2013 about 47,000
Finally, the CBD is a unique type of residential area with
people were living in the area, with just over half being
a large Asian population. In 2013, 53 percent of the
Asian.17 About half of this population was Chinese, a
population of the three CAUs comprising the Auckland
quarter Indian, 15 percent Korean and smaller numbers
CBD identified with Asian ethnicities. The largest group
of Filipinos, Sri Lankans, Cambodians and Vietnamese.18
were Chinese with about 5,000, followed by Indian
This was in stark contrast to the neighbouring suburb
(3,000), Korean (2,000), Filipino (800) and Japanese
of Ōtara, where 80 percent of the population was of
(600). A high proportion of these populations were tertiary
Pacific origin and less than three percent were Asian.19
students at the two universities in the CBD and those
undertaking other kinds of education such as English In some countries of Chinese settlement, new migrants
language courses. have attracted considerable attention for their
architectural preferences. For example, in Vancouver,
Virtually all of the CBD population lives in apartments, the
Canada, the large houses often built by wealthy Asian
great majority of which have been converted from office
migrants – with the objective of maximising land usage
buildings or been purpose-built since 1991.16 The initial
– have been described as “large, square properties on
conversions of office buildings to apartments resulted
minimally-landscaped lots… giving rise to the
from a surplus of commercial office space in the late
uncomplimentary moniker of the ‘monster house’ ”.20
15 See Friesen et al. (2005).
16 See Friesen, W. (2009). Gentrification and reurbanisation: the demographic transformation of inner city Auckland. New Zealand Population Review,
35, 55-74.
17 These numbers are based on the 10 CAUs of Meadowland, Millhouse, Kilkenny, Dannemora, Greenmount, Point View, Beaverstock Oaks, Ormiston,
Donegal Park and Mission Heights. Total population 2013 Census: 46,968; Asian population: 23,961.
18 Friesen, W. & Kearns, R. (2010) Ōtara and Dannemora: contrasting landscapes and ethnic identities in two South Auckland suburbs, in J. Stephenson,
M, Abbott, & J. Ruru (eds), Beyond the scene: landscape and identity in Aotearoa New Zealand. Otago University Press, Dunedin, pp. 93-110.
19 Ibid p. 99.
20 Ley, D. & Murphy, P. (2001). Immigration in gateway cities: Sydney and Vancouver in comparative perspective. Progress in Planning, 55, 119-194 (quote p. 148).
Asian Auckland: The multiple meanings of diversity 30While comments like these are seemingly less prominent population in this part of the North Shore, but
in Auckland than in Vancouver, the ‘Asian’ housing in areas distinguishing features are the significant clusters
such as Botany Downs and Dannemora has drawn some of Korean and Filipino populations.
attention in the media and elsewhere.21 Houses commonly
feature large pillared entryways (said to be an element Since the increase in Korean immigration to New Zealand
of feng shui) and occupy large proportions of the sections in the early 1990s (Figure 1), the North Shore has had
on which they sit – a feature that is noticeable in many the greatest concentration of Koreans, and this was still
new residential developments occupied by a range of the case in 2013 (Figure 9). This reflects a kind of ‘chain
ethnicities. Nevertheless, a visit to these suburbs (and
22 migration’, in which the establishment of facilities catering
some scrutiny of real estate agency windows) reveals a to a specific ethnic group in turn attracts more members
range of housing styles and prices, including many modest, of that group. For example, Christian churches in a number
stand-alone houses and terraced housing and apartments. of denominations have been an important aspect of
Korean settlement on the North Shore.
Dannemora housing
Korean Jehovah’s Witness Church, North Shore
Case study – Glenfield and Northcote:
Diversifying North Shore As has already been shown, migrants from the
Philippines made up the greatest relative increase
In 1986 more than 90 percent of the North Shore
in Asian immigration to New Zealand between the
population was European/Pākehā;23 and the Asian
2006 and 2013 censuses.
population made up less than two percent. By 2013
the European percentage had declined to less than
Although Filipino migrants have settled more widely
70 percent and the Asian population was 24 percent.
in New Zealand than most other Asian groups, there
is still a significant settlement in Auckland: 50 percent
Figure 6 shows the noticeable concentration of Asian
of the Philippines-born population were ‘usually resident’
populations through the centre of the North Shore,
there in 2013. The greatest proportionate concentration
particularly in Northcote and Glenfield, where the Asian
was in the two CAUs of Glenfield, with just over
population ranges from 30 to 45 percent of the total
10 percent of the total population of those areas born
population by CAU. In contrast to the new housing
in The Philippines. When four adjacent CAUs are included,
development of Dannemora in south-eastern Auckland,
there were more than 2,000 Filipino migrants in this area
these are areas of older, affordable housing, much of it
of the North Shore, an increase of about three times since
built from the 1960s onwards after the completion of the
the previous census.24
Auckland Harbour Bridge. There is a substantial Chinese
21 See Spoonley & Bedford (2012), p. 237.
22 Friesen & Kearns (2010), pp. 107-108.
23 Pākehā is the Māori term commonly used to describe people of European origin, although there has been some contestation recently as to whether other
non-Maori migrant groups might also be described in this way.
24 Adjacent CAUs are Kaipatiki, Target Road, Witheford and Glendhu. Including Glenfield Central and Glenfield North, the 2013 Filipino population was
2,130 compared with 765 in 2006.
Asian Auckland: The multiple meanings of diversity 31The Filipino ethnoscape is less obvious than some of Earlier studies have estimated the number of Asian
the other Asian groups because of three factors: restaurants and cafes (but not including food courts)
in Auckland at about 200 in 1996 and nearly 400 in
• Many work in medical and other services rather
2007.25 However, this counting exercise has become
than as entrepreneurs establishing small businesses,
increasingly problematic as there is no definitive list
a feature that is more characteristic of Chinese,
of restaurants by region of origin, and defining ‘Asian’
Indian and Korean groups.
restaurants is difficult as there are often fusions
• The Filipino cuisine is not well known in New Zealand, of cuisines within and beyond the ‘Asian’ category. One
so there are few Filipino restaurants in Auckland. website that lists eating options (www.menumania.co.nz )
• Filipinos’ widespread use of English means that the has 406 ‘Asian’ restaurants and cafes in Auckland in
signage of existing enterprises and churches is not 2014, and while this may be assumed to be an
distinctive. undercount, the breakdown by national/ethnic type is
interesting: Chinese 240 (including three Taiwanese),
Nevertheless, Filipinos are increasingly visible at cultural Japanese 155, Indian 144, Thai 101, Korean 44,
events such as festivals and in other ways. Malaysian 37, Vietnamese 25, Singaporean six,
Indonesian two and Filipino two.
Another way to consider the impacts of Asian food on
Auckland ethnoscapes is to look at Metro, an Auckland
lifestyle magazine in which food is an important topic.
Since 2012 the magazine has published an annual list of
the ‘100 Best Cheap Eats in Auckland’ which purports to
show the 100 best restaurants and cafes (mostly the latter)
where you can get “… a decent feed for less than $20”.
While Metro may be seen as catering to middle-class
Aucklanders, the food outlets’ patrons come from a
diverse range of socioeconomic and ethnic groups.
Glenfield night market 2014 Out of the 100 outlets listed in 2013, 75 were
Restaurants, cafes, food courts, food markets identifiably ‘Asian’ with a further six Middle Eastern,
Turkish or Lebanese (also ‘Asian’ by some geographical
The proliferation of Asian food outlets is perhaps one of
classifications). Figure 11 shows a ‘simplified’ breakdown
the most noticeable, and most frequently commented on,
of these food venues, with Chinese comprising the largest
aspects of the changing Asian ethnoscapes of Auckland.
outlet group and showing the greatest increase since
It is sometimes described as part of a ‘diversity dividend’
2012. Although the distribution shown in Figure 11 is
resulting from the increased number and diversity of
similar to the overall numbers mentioned above, Metro
migrants coming to New Zealand. This ‘dividend’ tends to
notes that some cafes have fallen off the list since the
refer to the benefits of immigration for the wider
previous year (e.g. Indian and Malaysian) because their
population, and in the case of food is made conspicuous
prices have risen a little above the $20 benchmark.
by the increasing adoption of Asian cuisines by non-Asian
populations. However, while some Asian food outlets are
‘shared’ by Asians and non-Asians alike, others tend to
serve the needs of specific Asian groups.
25 Yoon, H.-k. (2003). Recent East Asian immigrants and their contribution to multi-culturalism in Auckland, New Zealand. Human Geography, 55, 95-106;
Friesen, W. (2008). Diverse Auckland: the face of New Zealand in the 21st century? Asia New Zealand Foundation, Wellington, p. 14.
Asian Auckland: The multiple meanings of diversity 32The distribution in Figure 11 is said to be ‘simplified’ Mexican food. Central Auckland also has a number of food
because it hides a great deal of diversity: courts that are independent of malls, and the larger ones
have a range of Asian outlets not usually included in the
• Some cafes have hyphenated identities such as
considerations of restaurants and cafes discussed above.
‘Chinese-Malaysian’, ‘Korean-Chinese’, ‘Malaysian-
A sense of their diversity is apparent in the Asian options
South Indian’ and even ‘Chinese-Indian’, and have
that make up about two-thirds of the outlets in three of
been allocated to the category listed first.
the more popular central food courts:
• Some categories have a great deal of regional
• Atrium on Elliott has two Chinese and one each
diversification. For example: ‘Chinese’ includes
of Thai, Malaysian, Indian, Indonesian, Vietnamese
cuisines from Taiwan, Sichuan, North China, Canton,
and Japanese.
Shanghai, Xi’an, Hunan and regional specialisations
not identifiable from websites or published reviews; • Food Alley (in Albert Street) has two Chinese
and Indian restaurants tend to be identified as North (pork buns, hot pot), three Thai (including Northern),
or South Indian, vegetarian or not, and halal or not. two Malaysian and one each of Indian, Indonesian,
On-the-ground research also shows a diversity within Korean, Japanese and Vietnamese.
these categories.
• International Food Court (Ponsonby Road) has one
each of Vietnamese, Japanese, Malaysian, Chinese,
It is notable that only a limited range of the cuisines
Indonesian, Thai, Laotian and Indian. 27
featuring in the ‘cheap eats’ are also represented at the
‘top end’ of the dining market. Using Metro as the measure,
Asian supermarkets and smaller shops selling Asian food
three of the top five restaurants of 2014 had a strong
ingredients are spread throughout Auckland, although
Japanese influence: Masu (in Skycity) was the ‘supreme
they are concentrated in the central city and other areas
winner’, with runners-up including Cocoro (in Ponsonby)
with large Asian populations. Some are stand-alone
with ‘finalist, best chef’ and “exquisite Japanese food”,
operations while others trade under chain brands.
and Kazuyu (in Eden Terrace) a finalist in several
For example, Tai Ping Trading Company has a warehouse
categories, with chef Kazuyu Yamauchi offering “dining
and eight retail outlets in Auckland, of which four are
that is largely, and sublimely European”.26
franchises. Although the Asian supermarkets offer
predominantly Chinese products, there is also a
At this end of the market there is much fusion between
significant presence of Indian and Japanese outlets.
cuisines as well as an emphasis on an innovative food
Some carry pan-Asian selections of goods.28
and restaurant ambience, often facilitated by considerable
corporate investment. Of Metro’s ‘top 50’ restaurants
Day markets have been a feature of Auckland for many
in 2014, only four were identifiably ‘Asian’ (all Japanese),
years, with the best known being:
so the Asian impact tends to be more indirect, with
restaurants incorporating elements with Asian origins. • Ōtara Market, which has operated every Saturday
At the same time, it should be noted that there are many since 1977. Originally a largely Pacific island market
‘fine dining’ Asian restaurants that fall between Metro’s selling raw and cooked food as well as crafts and other
‘cheap eats’ and ‘top 50’ categories. products, it has diversified in the past 20 years to
feature Asian stallholders and customers – a reflection
All of Auckland’s larger suburban shopping malls have of the increasing Asian population in nearby suburbs.
food courts, which in recent years have become A 2004 survey estimated that about half of the
dominated by Asian food outlets, with other options stallholders were Asian.29
including hamburgers, fish and chips, and Italian and
26
Metro, May 2014, pp. 81-102.
27 For more detail on other food courts, see ‘A guide to Auckland’s food courts’, The New Zealand Herald February 1, 2011.
28 Forty (mostly) Asian Auckland ‘supermarkets’ are listed at www.yelp.co.nz/search?find_desc=asian+supermarket&find_loc=Auckland#.
29 Bruce Ringer, ‘The origins of the Otara Market’, Auckland Council Libraries, www.aucklandlibraries.govt.nz/EN/heritage/localhistory/countiesmanukau/
communities/Pages/originsoftheotaramarket.aspx.
Asian Auckland: The multiple meanings of diversity 33Figure 11. Metro Magazine’s ‘100 Best
Figure 11. Metro Cheap
Magazine’s Eats
“100 in Auckland
Best Cheap Eats2013’ (by ethnic
in Auckland 2013, origin of cuisine)
by ethnic specialty of café/restaurant”
19
25
6
1
1
2
3 12
6
6
11
8
Chinese Japanese Indian Thai Korean Malaysian
Vietnamese Pan-Asian Sri Lankan Filipino Middle Others
Eastern
Data source: Metro magazine, October 2013
Asian Auckland: The multiple meanings of diversity 34• Avondale Market, which is known as New Zealand’s and a proportionate decline in the overseas born
largest one-day market. It attracts 15,000 to 20,000 (from 45 percent to 43 percent), counter to the trends
people each Sunday and sells a large range of fruit, in many other parts of Auckland.
vegetables, fish, cooked food, crafts, electronics, ‘car
boot items’ and more.30 Its origins go back at least It was perhaps this combination of a greater Indian
30 years, but the influence of Asian sellers and buyers population and ongoing gentrification that resulted in
has been particularly notable in the past two decades. the establishment of a distinctive ‘Indian food neighbourhood’
along Sandringham Road, especially in the main retail
Night markets are relatively new in Auckland. The first area. South Asian cuisines represented in this small
was established by a Chinese business woman in Pakuranga cluster of popular restaurants and cafes include Gujarati
in 2010, and she and her husband now run five more vegetarian (Jai Jalaram), Mughlai (Bawarchi), Punjabi
in Glenfield, Papatoetoe, Onehunga, Whangaparaoa (Shubh), South Indian (Satya), Indo-Fijian (Taste of Fiji)
and Waitakere. Each operates for one night of the week and Sri Lankan (7 Siri), as well as several takeaway
in a shopping mall parking lot.31 On a typical evening at outlets, some attached to these restaurants and others
the Glenfield night market, about 100 of the stalls sell separate. Some of the restaurants are halal, and some
food; about two-thirds are Asian food stalls, covering explicitly ‘alcohol-free’.
the spectrum of national and sub-national cuisines.
This cluster of shops also has three well stocked
Case study – Sandringham: Indian food neighbourhood Indian supermarkets, a ‘Sri Lankan, Indian, Malaysian,
Singaporean products trader’, two halal butchers, small
British names feature throughout the Sandringham area,
Indian dairies and other shops. The appeal of this food
from the suburb name itself to nearby Dominion and
neighbourhood (called Little India by some) is reflected in
Balmoral Roads. However, the area’s population has
the regular oversubscription to the monthly ‘Sandringham
become decreasingly ‘British’ since the 1987 immigration
Food and Spice Tour’ of restaurants and supermarkets.34
changes: in the 2006 census about half of the population
identified as European and about a third were Asian.32
While Pacific and Māori populations have been settled
in Sandringham for some decades, the most significant
change has been the increase in Asian populations,
especially Indian and Chinese. In the intra-censal period
to 2013 the Chinese population was static but the Indian
population continued to grow. One reason for this was
that Sandringham and adjacent areas to the west and
south had become increasingly identified as ‘Indian’,
with significant numbers of others from South Asia
also resident.33
Paradise Restaurant and takeaway Sandringham
Another process that became apparent between the
Case study – Dominion Road: elongated Chinatown?
2006 and 2013 censuses was increasing gentrification,
especially in the north next to gentrifying areas such as Perhaps the most prominent ethnoscape in Auckland runs
Kingsland and Grey Lynn. Demographically this change along Dominion Road, an arterial road bridging Mount
was evident in a proportionate increase in those who Eden, Sandringham, Mount Albert and Mount Roskill.
identified as European (from 50 percent to 55 percent), ‘Asian’ shops are densely clustered along several
30 Avondale market website: www.avondalesundaymarkets.co.nz/aboutus.html.
31 Based on fieldwork and Tan, L. (2014). Auckland’s night markets: night fever. The New Zealand Herald, April 29.
32 See Friesen et al. (2005).
33 Sandringham here is considered to be the three CAUs with Sandringham in their name (North, West and East). Sources of information for this section are
the 2013 and earlier censuses, as well as the article by Friesen et al. (2005).
34 Calder, P. (2014) Venturing beyond butter chicken. The New Zealand Herald April 2, www.nzherald.co.nz/lifestyle/news/article.cfm?c_
id=6&objectid=11230370.
Asian Auckland: The multiple meanings of diversity 35You can also read