Asian Journal of Medical and Biological Research
←
→
Page content transcription
If your browser does not render page correctly, please read the page content below
Asian J. Med. Biol. Res. 2021, 7 (1), 21-32; doi: 10.3329/ajmbr.v7i1.53305
                                                                                  Asian Journal of
                                                                   Medical and Biological Research
                                                                   ISSN 2411-4472 (Print) 2412-5571 (Online)
                                                                            www.ebupress.com/journal/ajmbr

Article
Forecasting the spread of COVID-19 pandemic in Bangladesh using ARIMA
model
Lakshmi Rani Kundu1, Most. Zannatul Ferdous1*, Ummay Soumayia Islam1 and Marjia Sultana2
1
    Department of Public Health and Informatics, Jahangirnagar University, Savar, Dhaka-1342, Bangladesh
2
    Department of Computer Science and Engineering, Begum Rokeya University, Rangpur-5400, Bangladesh

*Corresponding author: Most. Zannatul Ferdous, Lecturer, Department of Public Health and Informatics,
Jahangirnaagar University, Savar, Dhaka-1342, Bangladesh. Phone: +8801768894096; E-mail:
m.zannatul.ferdous@juniv.edu

Received: 22 February 2021/Accepted: 20 March 2021/ Published: 31 March 2021

Abstract: COVID-19 is one of the most serious global public health threats creating an alarming situation.
Therefore, there is an urgent need for investigating and predicting COVID-19 incidence to control its spread
more effectively. This study aim to forecast the expected number of daily total confirmed cases, total confirmed
new cases, total deaths and total new deaths of COVID-19 in Bangladesh for next 3 weeks. The number of daily
total confirmed cases, total confirmed new cases, total deaths and total new deaths of COVID-19 from 8
March2020 to 4 February, 2021 was collected to fit an Autoregressive Integrated Moving Average (ARIMA)
model to forecast the spread of COVID-19 in Bangladesh from 5th February 2021 to 25th February 2021. All
statistical analyses were conducted using R-3.6.3 software with a significant level of p< 0.05. The ARIMA
(1,2,1), ARIMA (1,1,1), ARIMA (1,2,2) and ARIMA (1,1,2) model was adopted for forecasting the number of
daily total confirmed cases, total confirmed new cases, total deaths and new deaths of COVID-19, respectively.
The results showed that an upward trend for the total confirmed cases and total deaths, while total confirmed
new cases and total new death, will become stable in the next 3 weeks if prevention measures are strictly
followed to limit the spread of COVID-19. The forecasting results of COVID-19 will not be dreadful for
upcoming days in Bangladesh. However, the government and health authorities should take new approaches and
keep strong monitoring of the existing strategies to control the further spread of this pandemic.

Keywords: COVID-19; confirmed cases; deaths; forecast; ARIMA; Bangladesh

1. Introduction
The COVID-19 pandemic is an ongoing public health threat which is caused by severe acute respiratory
syndrome coronavirus 2 (SARS-CoV-2) (WHO, 2020b). It is a viral infection and highly infectious disease
considering to be transmitted from wild animals (bats) to human and first identified in Wuhan city of China (De
Wit et al., 2016; Paules et al., 2020). The disease was then a local epidemic of China, but soon it became
expanded all over the world by international travelers (Chintalapudi et al., 2020). Previously SARS-CoV
emerged from China in 2003, respectively MERS-CoV emerged from Middle East in 2012, developed severe
symptoms (Azhar et al., 2019; Hui and Zumla, 2019). Now this virus is the 7th of coronaviruses that represents a
serious public health threat for which World Health Organization (WHO) declared COVID-19 as a pandemic in
March 2020 (Cascella et al., 2020). Since then, the pandemic has spread all over the globe as days go by.
Approximately, 190 countries have been affected, where major outbreaks occurred in USA, Italy, Spain, France,
China (Chintalapudi et al., 2020). As of 14th February, 2021, COVID-19 cases have been exceeded 108 million
including 2,381,295 deaths worldwide (WHO, 2021). According to a study conducted in China, COVID-19 can
be asymptomatic including mild or moderate symptoms (Hua et al., 2020). Hence, by looking into these facts,
we should have to imagine the heaviness of this pandemic globally and its impacts on public health.
Asian J. Med. Biol. Res. 2021, 7 (1)
22
In Bangladesh, Institute of Epidemiology, Disease Control and Research (IEDCR), declared the first three
confirmed cases of COVID-19 on 8th March, 2020 (Paul, 2020). The present scenario of coronavirus cases in
Bangladesh is 540,592confirmed cases, with 8,274 deaths, and 487,229 recoveries on 14 th February 2021
(Worldometer, 2021). As Bangladesh is one of the most densely populated countries around the world, it has a
great risk of exposure due to COVID-19. Like other countries, government of Bangladesh has also already
adopted several measures such as informing COVID-19 hotspot areas, maintaining social distance and
increasing mass awareness by social media or televisions, setting lockdown of school, college and office
(Haque, 2020) to minimize the situation. However, these available control measures are significantly influenced
by the knowledge, attitudes, and practices (KAP) towards COVID-19 (Ferdous et al., 2020a). Furthermore, it is
really a challenging task for the people of overcrowded Bangladesh where the chance of the COVID-19
spreading is much more than non-crowded place and in a Bangladesh survey from March 29 to April 29 found
that 98.7% reported wearing a face mask in crowded places(Ferdous and Islam, 2020). As the incubation period
of COVID-19 is up to 14 days, the virus can be transmitted to other people during this time period (Al-Qaness et
al., 2020; Moftakhar and Seif, 2020). Again, there is ambiguity about the proper decline and fall of the
contagious disease (Yousaf et al., 2020). Moreover, there is a noticeable proportion of cases that reported
persistent COVID-like symptoms after recovering from the disease (Islam et al. 2021). Therefore, in this critical
time, smart planning with sufficient preparation for mitigating the incidence and prevalence of disease including
designing the future prospect is very important. Because evidence on the management approaches of current
COVID-19 pandemic is still limited though the numbers of affected countries are increasing as the days go by
(Ferdous et al., 2020b). By modeling a future forecast which estimates the regular number of confirmed cases
might help to implement new rules. Further, a statistical forecast model might also be beneficial for predicting
future epidemic threat as well as better management of societal, economic, cultural and public health matters
(Dehesh et al., 2020; Petropoulos and Makridakis, 2020).
The aim of this study is to predict the spread and the final size of COVID-19 epidemic in Bangladesh by using
Auto Regressive Integrated Moving Average (ARIMA) model. The ARIMA model is generally known as Box-
Jenkins methodology used to forecast and analysis in a time series modeling approach (Inoue et al., 2011).
Recently this model has been used in the mostly affected 15 countries of the world to forecast the flow of
COVID-19 which revealed similar number according to the current situation of those countries (Kumar et al.,
2020). Another study conducted in Italy and Spain showed accurate regular number of cases in these countries
(Monllor et al., 2020). Though modeling cannot always forecast the accurate number of cases it may help to
summarize the future prospect of the pandemic by showing the acceptable number of occurrence happening for
the next 3 weeks.
2. Methods and Materials
2.1. Data source and data description
The data extracted from the official website of the World Health Organization COVID-19 situation reports
(WHO, 2020a) and website of the Humanitarian Data Exchange (https://data.humdata.org/dataset/coronavirus-
COVID-19-cases-and-death).
This study considered the daily total confirmed cases, daily total confirmed new cases, total deaths and total
new deaths of COVID-19 from 8th March 2020 to 4th February 2021 in Bangladesh. Then, this data were used to
fit a best ARIMA model for forecasting next 3 weeks total confirmed cases or new cases as well as total deaths
or new deaths from 5th February to 25thFebruary of COVID-19 in Bangladesh.
2.2. Statistical analysis
All analyses were done with R software (version 3.6.2), the stationary check was conducted using ‘tseries’
package and ARIMA model was fitted using ‘forecast’ package. A p-value of less than 0.05 was considered
statistically significant.
2.3. ARIMA model description
In this study, a linear parametric Autoregressive Integrated Moving Average (ARIMA) model was applied for
prediction purpose. If a time series Yt is followed by Yt 1Yt 1 2Yt 2 ... pYt p ut , where ut is a
white noise with mean zero and variance 2 , then it is called an autoregressive process of order p and is denoted
byAR(p).If Yt is defined by Yt 1ut 1 2ut 2 ... put q , then it is called a moving average process of
order qandis denoted by MA(q).Asian J. Med. Biol. Res. 2021, 7 (1)
23
The combination of AR and MA models are known as ARMA model. An ARMA(p,q) model is given by
(Gujarati and Porter, 2008). A time seriesYt is said to follow an Autoregressive Integrated Moving Average
(ARIMA) model if the d th difference Wt Yt is a stationary ARMA process. If Wt follows an ARMA (p,q)
d
model, then we say that Yt is an ARIMA(p,d,q) process. For practical purposes, taking d=1 or at most 2 (Kane et
al., 2014).
Thus, an ARIMA (p, 1, q) process with Wt Yt Yt 1 can be written as
Wt 1Wt 1 2Wt 2 ... pWt p ut 1ut 1 2ut 2 ... put q .
2.4. Box-Jenkins method
ARIMA model also known as Box-Jenkins method which is widely used for the analysis of time series and
forecasting (Box and Jenkins, 1976). In recent years, this model has been widely used in the prediction of
epidemic trend of infectious diseases (Duan et al., 2016). The fitting of the ARIMA model or Box-Jenkins
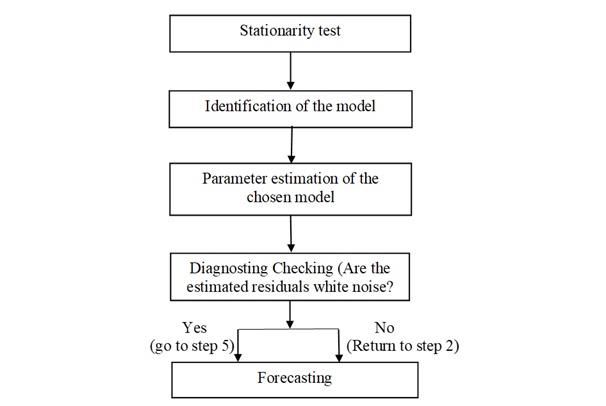
methodology consists of the following steps (Figure 1):
2.4.1. Test of stationary
An Augmented Dickey-Fuller (ADF) test was conducted for testing whether the original series is stationary or
not (Dickey and Fuller, 1979). Difference or logarithmic transformation was adapted to transformed
nonstationary time series into a stationary time series. Achieving stationary is a precondition for establishing an
ARIMA model.
2.4.2. Model identification
An appropriate value of p, d and q of ARIMA model was identified. The value of d was identified according to
the number of differentials. From the autocorrelation function (ACF) and partial autocorrelation function
(PACF) plot against the lag length, the AR and MA parameters was selected. Nevertheless, there have been
some model selection criteria such as Akaike information criterion (AIC), Bayesian information criteria (BIC).
The optimal model was chosen based on smallest value of AIC and BIC (Akaike, 1974).
2.4.3. Estimation of the fitted model
After the identification of the appropriate values of p and q, the next stage was to estimate the parameter of the
autoregressive and moving average terms included in the model. This was done using the maximum likelihood
estimation method.
2.4.4. Diagnosting checking
Having identified the fitted ARIMA model and parameter estimate, the Ljung-Box Q test was applied to check
whether the residual series is a white noise. If so, then the fitted model was accepted. The Ljung-Box Q statistics
is defined as
s
Q T (T 2) (T k ) 1rk2
k 1
where, T is the number of observations, s is length of coefficients to test autocorrelation, rk is autocorrelation
coefficient for lag k. This statistic Q approximately follows the chi-square distribution with(k-q) degrees of
freedom, where q is the number of parameter should be estimated in the model (Ljung and Box, 1978).
2.4.5. Forecasting
Finally, the future value was predicted by using the fitted model. The steps are presented in the following
diagram:
2.5. Ethics
As all data were obtained from secondary data collection source, no formal ethical assessment was required.Asian J. Med. Biol. Res. 2021, 7 (1)
24
3. Results
The time series plot of daily COVID-19 total confirmed new cases (A1), total confirmed cases (A2), total new
deaths (B1) and total deaths (B2) in Bangladesh from March 8 to February 4, 2021 are presented in Figure 2.
During the study period, a total of 536,545 confirmed cases and 8,162 deaths were detected and there were
maximum cases in 3rd July 2020 of 4019 cases and maximum deaths in 1st July 2020of 64 deaths. The graphical
inspection showed that the original series are in increasing trend and sometimes are in decreasing trend and the
variance is not stable which leads the variables were nonstationary and need to be transformed into a stationary
process.
Before fitting the ARIMA model, it is necessary to confirmed that the series must be stationary. Augmented
Dickey Fuller (ADF) test was applied to check the stationarity of the series. The ADF unit root test results are
presented in Table 1.
The findings indicated that all the series are nonstationary at their level (p-value>0.05), but after taking 1st
difference, total confirmed new cases and deaths achieved stable variance. On the other hand, total confirmed
cases and deaths achieved stable variance after 2nd differences. This ensured that the series are stationary at 5%
level of significance and ready for modeling with the Box-Jenkins ARIMA modeling approach.
After achieving the stationary series, a list of potential models was formulated based on the significant spikes
observed from the ACF and PACF plot. The result of the different probable models is presented in Table 2. The
order of the model was determined according to the ACF and PACF plots (Figure 3a-d) for the differenced
stationary time series.
Among the candidate models, the best ARIMA model was selected based on minimum AICc value.
Accordingly, ARIMA(1,2,1), ARIMA(1,1,1), ARIMA(1,2,2) and ARIMA(1,1,2) were chosen as the best model
for total confirmed cases, total confirmed new cases, total deaths and total new deaths, respectively. The fitted
model produces least AICc value 4798.08, 4811.51, 2192.83 and 2198.4 for total confirmed cases, total
confirmed new cases, total deaths and total new deaths, respectively. The estimated best ARIMA models are
demonstrated in Table 3.
The Ljung-Box Q test suggested that the residuals series of the ARIMA(1,2,1), ARIMA(1,1,1), ARIMA(1,2,2)
and ARIMA(1,1,2) models are purely white noise (p-value>0.05) at 95% confidence level. Therefore, these
selected models are probably adequate for the data. Then these models were applied to forecast the daily
confirmed cases and deaths of COVID-19 in Bangladesh.
Table 4 and Figure 4 showed the predicted values from 5th February to 25th February 2021 for all variables using
the fitted ARIMA(1,2,1), ARIMA(1,1,1), ARIMA(1,2,2) and ARIMA(1,1,2) model with 95% confidence
interval (CI). The forecasted value (in blue) based on fitted ARIMA model for daily confirmed cases or new
cases and deaths or new deaths of COVID-19 for the next 3 weeks and the current number of confirmed cases
and deaths from March 8, 2020 to February 4, 2021 (in black) are shown in figure 4. The results showed that an
upward trend for daily total confirmed cases and total deaths in Bangladesh by 25 th February, 2021 has a point
forecast of 546097 (95% CI 531024-561142) and 8421(95% CI 8179-8663), while total confirmed new cases
and total new death, possible become stable. However, Bangladesh is hopeful to control this pandemic in the
upcoming days.
Table 1. Results of Augmented Dickey Fuller unit root test.
Original data At 1st difference At 2nd difference
Variables
ADF p-value ADF p-value ADF p-value
Total confirmed new cases -0.973 0.942 -9.972 0.01* - -
Total new Deaths -1.209 0.904 -10.024 0.01* - -
Total confirmed cases -3.259 0.078 -0.999 0.938 -9.961 0.01*
Total Deaths -2.696 0.283 -1.229 0.901 -10.012 0.01*
The null hypothesis is that the series is non-stationary, or contain a unit root. Decision Rule: Reject the null
hypothesis if the p-value < α =0.05;* indicates the rejection of the null hypothesis.Asian J. Med. Biol. Res. 2021, 7 (1)
25
Table 2. Comparison of different ARIMA models.
Variables Candidate Models Selection Criterion Best Model
AICc
Total confirmed cases ARIMA(2,2,2) 4801.231 ARIMA(1,2,1)
ARIMA(0,2,0) 4886.962
ARIMA(1,2,0) 4831.89
ARIMA(0,2,1) 4799.088
ARIMA(1,2,1) 4798.083
ARIMA(1,2,2) 4800.125
ARIMA(0,2,2) 4798.328
ARIMA(2,2,0) 4824.272
Total confirmed new ARIMA(2,1,2) with drift 4816.685 ARIMA(1,1,1)
cases ARIMA(0,1,0) with drift 4902.694
ARIMA(0,1,1) with drift 4814.523
ARIMA(0,1,0) 4900.674
ARIMA(1,1,1) with drift 4813.516
ARIMA(1,1,2) with drift 4815.57
ARIMA(0,1,2) with drift 4813.762
ARIMA(2,1,0) with drift 4839.817
ARIMA(1,1,1) 4811.514
ARIMA(0,1,1) 4812.528
ARIMA(1,1,0) 4845.429
ARIMA(0,1,2) 4811.759
ARIMA(2,1,0) 4837.782
ARIMA(2,1,2) 4814.659
Total deaths ARIMA(2,2,2) 2194.431 ARIMA(1,2,2)
ARIMA(0,2,0) 2361.237
ARIMA(1,2,0) 2259.571
ARIMA(0,2,1) 2194.614
ARIMA(1,2,2) 2192.825
ARIMA(1,2,1) 2194.667
ARIMA(1,2,3) 2194.604
ARIMA(0,2,3) 2195.689
ARIMA(2,2,1) 2196.527
ARIMA(2,2,3) 2196.959
Total new deaths ARIMA(2,1,2) with drift 2201.966 ARIMA(1,1,2)
ARIMA(0,1,0) with drift 2369.359
ARIMA(0,1,0) 2367.342
ARIMA(1,1,2) with drift 2200.346
ARIMA(0,1,2) with drift 2201.94
ARIMA(1,1,1) with drift 2202.112
ARIMA(0,1,3) with drift 2203.166
ARIMA(2,1,1) with drift 2203.989
ARIMA(2,1,3) with drift 2204.507
ARIMA(1,1,2) 2198.401
ARIMA(0,1,2) 2200.079
ARIMA(1,1,1) 2200.255
ARIMA(2,1,2) 2200.006
ARIMA(1,1,3) 2200.178
ARIMA(0,1,1) 2200.208
ARIMA(0,1,3) 2201.273
ARIMA(2,1,1) 2202.114
ARIMA(2,1,3) 2202.535Asian J. Med. Biol. Res. 2021, 7 (1)
26
Table 3. Results of each selected ARIMA model and Ljung-Box test.
Coefficients
ARIMA model ar1 ma1 ma2 AIC AICc BIC p-value
(s.e.) (s.e.) (s.e.)
Total confirmed cases 0.132 -0.695 - 4798.01 4798.08 4809.43 0.959
ARIMA(1,2,1) (0.074) (0.048)
Total confirmed new 0.132 -0.695 4811.44 4811.51 4822.87 0.959
cases (0.075) (0.047) -
ARIMA(1,1,1)
Total deaths 0.626 -1.470 0.585 2192.7 2192.83 2207.92 0.846
ARIMA(1,2,2) (0.168) (0.149) (0.109)
Total new deaths 0.626 -1.470 0.585 2198.28 2198.4 2213.51 0.847
ARIMA(1,1,2) (0.169) (0.149) (0.109)
Table 4. Forecasting of daily total confirmed cases, total confirmed new cases, total deaths, and total new
deaths in Bangladesh for the next 3 weeks according to ARIMA models with 95% CI.
Total confirmed
Total confirmed cases Total deaths Total new deaths
Date new cases
ARIMA(1,2,1) ARIMA(1,2,2) ARIMA(1,1,2)
ARIMA(1,1,1)
05/02/2021 536997 (536348,537644) 452 (-193,1099) 8174 (8162,8187) 12 (0,25)
06/02/2021 537452(536320, 538581) 454 (-250,1160) 8187 (8167,8207) 12 (0,25)
07/02/2021 537907 (536289, 539521) 454(-288,1198) 8200 (8173,8226) 12 (0,25)
08/02/2021 538362 (536232,540486) 454(-320,1228) 8212(8179,8245) 12 (-1,26)
09/02/2021 538817 (536145, 541482) 454(-352,1261) 8224(8183,8265) 12 (-2,26)
10/02/2021 539272 (536027, 542509) 454(-384,1293) 8237(8187,8286) 12 (-2,27)
11/02/2021 539727 (535878, 543567) 454(-414,1323) 8249(8190,8308) 12 (-3,27)
12/02/2021 540182 (535698, 544655) 454(-444,1353) 8261(8193,8330) 12 (-3,28)
13/02/2021 540637 (535490, 545772) 454(-472,1381) 8274(8195,8353) 12 (-4,28)
14/02/2021 541092 (535253, 546917) 454(-500,1409) 8286(8196,8376) 12 (-4,29)
15/02/2021 541547 (534990, 548089) 454(-527,1435) 8298(8197,8400) 12 (-4,29)
16/02/2021 542002 (534700, 549288) 454(-553,1462) 8311(8197,8424) 12 (-5,29)
17/02/2021 542457 (534385, 550512) 454(-578,1487) 8323(8197,8449) 12 (-5,30)
18/02/2021 542912 (534044, 551761) 454(-603,1512) 8335(8196,8474) 12 (-6,30)
19/02/2021 543367(533680, 553034) 454(-628,1536) 8347(8195,8500) 12 (-6,31)
20/02/2021 543822 (533293, 554330) 454(-651,1560) 8360(8193,8526) 12 (-7,31)
21/02/2021 544277 (532883, 555649) 454(-675,1583) 8372 (8191,8553) 12 (-7,32)
22/02/2021 544732 (532450, 556990) 454(-697,1606) 8384(8189,8580) 12 (-7,32)
23/02/2021 545187 (531996,558353) 454(-720,1628) 8397(8186,8607) 12 (-8,32)
24/02/2021 545642 (531521, 559737) 454(-742,1650) 8409(8183,8635) 12 (-8,32)
25/02/2021 546097 (531024,561142) 454(-763,1672) 8421(8179,8663) 12 (-8,33)Asian J. Med. Biol. Res. 2021, 7 (1)
27
Figure 1. Scheme for the use of Box-Jenkins methodology (Makridakis et al., 1997).
Figure 2. Time series plot displays for confirmed new cases (A1), total confirmed cases (A2), new deaths
(B1) and total deaths (B2) of COVID-19 in Bangladesh.Asian J. Med. Biol. Res. 2021, 7 (1)
28
Figure 3a. ACF and PACF for daily confirmed new cases.
Figure 3b. ACF and PACF for daily new deaths.
Figure 3c. ACF and PACF for total confirmed cases.Asian J. Med. Biol. Res. 2021, 7 (1)
29
Figure 3d. ACF and PACF for total deaths.
Figure 4. Predictive and confidence intervals of daily total confirmed cases, total confirmed new cases,
total deaths, total new deaths of COVID-19 using fitted model (Black line: actual data, Blue line: 3 weeks
forecast, Gray zone: 80% of CI, White zone: 95% of CI).
4. Discussion
It is alarming that the number of novel coronavirus (SARS-Cov-2) cases continues to escalate across the globe.
The estimation of infectious disease like COVID-19 management by developing hypothesis for interpreting the
observed situation can be done via time series analysis (Sato, 2013). Time series health researchers widely use
ARIMA model because of the importance of ‘time’ for disease management studies (Choi and Thacker, 1981;
Haines et al., 1989). Previous study revealed that ARIMA is one of the most suitable models as it has higherAsian J. Med. Biol. Res. 2021, 7 (1)
30
fitting and forecasting accuracy (Chen et al., 2008; Hue et al., 2018). In recent years, it is also an useful model
for predicting the incidence of infectious disease (Inoue et al., 2011). The main purpose of this work is to
monitor and forecast the expected number of the new COVID-19 patients in Bangladesh by applying a
commonly used time series model, known as an ARIMA model, based on the data of the total confirmed daily
cases and deaths and the new confirmed cases and new deaths officially announced by the Institute of
Epidemiology, Disease Control and Research.
The prediction indicates an upward trend for daily total confirmed cases along with total deaths. At the same
time, total confirmed new cases, and total new deaths most probably become stable. According to the study the
total confirmed cases of coronavirus in 14thFebruary, 2021 was estimated 541,092 and total death was estimated
8,286 which was slightly higher than the actual scenario (Worldometer, 2021). The present study also revealed,
total confirmed new cases and total new deaths were in stable conditions that almost follow the real scenario.
However, Bangladesh is hopeful for controlling the pandemic in the upcoming days if the spreading pattern of
the disease remains the same. A study conducted in Iran reported that, an upward trend for total confirmed case
and total death while the other variables such as total confirmed new cases, total new deaths possibly became
steady which is similar to our study (Tran et al., 2020). Another study conducted for forecasting different
countries COVID-19 trend demonstrated stable condition for China, stationary trend for South Korea while
Thailand showed controlled condition (Dehesh et al., 2020). Based on a study, for predicting the end of
COVID-19 by using this model expected that top countries COVID-19 infection would slow down by October,
2020 while there is a possibility to a second rebound of the infection in a year time if the situation are not under
control (Ewis et al., 2020). In contrast, in Saudi Arabia and Nigeria this model forecasts highly increased of
daily case with cumulative daily cases within one month (Alzahrani et al., 2020; Ibrahim and OLADIPO, 2020).
Similarly another study conducted India revealed explicit rising of infection especially in west and south Indian
regions were more at risk (Roy et al., 2020; Verma et al., 2020). Furthermore, after the initiation of vaccination,
in Bangladesh, till now more than five lakh people were vaccinated around fourteen lakh people with
registration for COVID-19 vaccine, which indicates a positive outcome for slowing-down the infection (The
Daily Star, 20201).
Although, ARIMA model usually gives better forecast, few drawbacks exits. Firstly, it does not have automatic
updates. Secondly, if more data added in the study then model gives different forecast results. Thirdly, the
prediction accuracy has a direct relation with the number of observation.
5. Conclusions
In this study, the trend of COVID-19 outbreak in Bangladesh was observed. The results found that the best
prediction model is ARIMA (1,1,1) and ARIMA(1,1,2) for forecasting the trend of the number of daily new
confirmed cases and deaths in Bangladesh. In this model the number of daily confirmed cases and deaths
showed upward trend. But surprisingly model presents the number of new confirmed cases and new deaths will
become stable in next 3 weeks. It is hopeful for Bangladesh, a developing country, though having inadequate
medical facilities, becoming successful to control this pandemic within last few days. However, to prevent the
COVID-19 pandemic permanently until all people are properly vaccinated or medicine is developed, public
health authorities, government, and non-government should take hard decisions to control the further increase of
this pandemic. Besides all the authorities, the general public should maintain social distance and undertake all
necessary preventive measures to stay free from the disease and control its spread.
Conflict of interest
None to declare.
References
Akaike H, 1974. A New Look at the Statistical Model Identification. IEEE Transactions on Automatic Control,
19: 716–723.
Al-Qaness MAA, AA Ewees, H Fan and MA El Aziz, 2020. Optimization method for forecasting confirmed
cases of COVID-19 in China. Appl. Sci., 9: 674.
Alzahrani SI, IA Aljamaan and EA Al-Fakih, 2020. Forecasting the spread of the COVID-19 pandemic in Saudi
Arabia using ARIMA prediction model under current public health interventions. J. Infect. Public Health, 13:
914–919.
Azhar EI, DSC Hui, ZA Memish, C Drosten and A Zumla, 2019. The Middle East Respiratory Syndrome
(MERS). Infectious Disease Clinics of North America. W.B. Saunders.
Box GEP and GM Jenkins, 1976. Time Series Analysis: Forecasting and Control Revised ed. Holden Day, SanAsian J. Med. Biol. Res. 2021, 7 (1)
31
Francisco (575 pages).
Cascella M, M Rajnik, A Cuomo, SC Dulebohn and R Di Napoli, 2020. Features, Evaluation and Treatment
Coronavirus (COVID-19). StatPearls. StatPearls Publishing. Retrieved from http://www.ncbi.nlm.nih.gov/
pubmed/32150360
Chen P, H Yuan and X Shu, 2008. Forecasting crime using the ARIMA model. Forecasting crime using the
ARIMA model. Proceedings - 5th International Conference on Fuzzy Systems and Knowledge Discovery,
FSKD 2008 Vol. 5.
Chintalapudi N, G Battineni and F Amenta, 2020. COVID-19 virus outbreak forecasting of registered and
recovered cases after sixty day lockdown in Italy: a data driven model approach. J. Microbiol. Immunol.
Infect., 53: 396–403.
Choi K and SB Thacker, 1981. An evaluation of influenza mortality surveillance, 1962-1979: I. Time series
forecasts of expected pneumonia and influenza deaths. Am. J. Epidemiol., 113: 215–226.
De Wit E, N Van Doremalen, D Falzarano and VJ Munster, 2016. SARS and MERS: recent insights into
emerging coronaviruses. Nat. Rev. Microbiol., 14: 523–534.
Dehesh T, HA Mardani-Fard and P Dehesh, 2020. Forecasting of COVID-19 confirmed cases in different
countries with ARIMA models. MedRxiv, 1–12.
Dickey DA and WA Fuller, 1979. Distribution of the estimators for autoregressive time series with a unit root.
Journal of the American Statistical Association, 74: 427.
Duan Y, X lei Huang, Y jie Wang, J qing Zhang, Q Zhang, Y wen Dang and J Wang, 2016. Impact of
meteorological changes on the incidence of scarlet fever in Hefei City, China. Int. J. Biometeorol., 60: 1543–
1550.
Ewis A, G Dagnew, A Reda, G Elmarhomy, M Elhosseini, AE Hassanien and I Gad, 2020. ARIMA Models for
Predicting the End of COVID-19 Pandemic and the Risk of a Second Rebound. The Lancet Infectious
Diseases.
Ferdous MZ, MS Islam, T Sikder and A Syed, 2020a. COVID-19 outbreak in Bangladesh : an online- based
cross-sectional study, 1–17.
Ferdous MZ, LR Kundu, M Sultana and SJ Jafrin, 2020b. Regional differences in COVID-19 attack and case
fatality rates in the first quarter of 2020 : a comparative study. IMC Journal of Medical Science, 14: 3–10.
Gujarati DN and DC Porter, 2008. Basic Econometrics Fifth edit. McGraw-Hill, New York.
Haines LM, WP Munoz and CJ Van Gelderen, 1989. ARIMA modelling of birth data. J. Appl. Stat., 16: 55–67.
Haque A, 2020. The COVID-19 pandemic and the public health challenges in Bangladesh: a commentary. J.
Health Res., 34: 563–567.
Hua W, L Xiaofeng, B Zhenqiang, R Jun, W Ban and L Liming, 2020. Consideration on the strategies during
epidemic stage changing from emergency response to continuous prevention and control. Chinese Journal of
Endemiology, 41: 297–300.
Hue HTT, S Pradit, A Lim, C Goncalo and T Nitiratsuwan, 2018. Shrimp and fish catch landing trends in
songkhla lagoon, Thailand during 2003-2016. Appl. Ecol. Environ. Res., 16: 3061–3078.
Hui DSC and A Zumla, 2019. Severe Acute Respiratory Syndrome: Historical, Epidemiologic, and Clinical
Features. Infectious Disease Clinics of North America. W.B. Saunders.
Ibrahim RR and OH Oladipo, 2020. Forecasting the spread of COVID-19 in Nigeria using Box-Jenkins
Modeling Procedure. MedRxiv, 2020.05.05.20091686.
Inoue M, S Hasegawa, and A Suyama, 2011. P1-177 Development and evaluation of a forecasting model for
infectious diseases in Japan using time-series analysis. J. Epidemiol. Community Health, 65: A115–A115.
Islam MS, MZ Ferdous, US Islam, ASM Mosaddek, MN Potenza and S Pardhan, 2021. Treatment, Persistent
Symptoms, and Depression in People Infected with COVID-19 in Bangladesh. Int. J. Environ. Res. Public
Health, 18: 1–16.
Kane MJ, N Price, M Scotch and P Rabinowitz, 2014. Comparison of ARIMA and Random Forest time series
models for prediction of avian influenza H5N1 outbreaks. BMC Bioinformatics, 15(1).
Kumar P, H Kalita, S Patairiya, YD Sharma, C Nanda, M Rani, J Rahmani and AS Bhagavathula, 2020.
Forecasting the dynamics of COVID-19 Pandemic in Top 15 countries in April 2020: ARIMA Model with
Machine Learning Approach. MedRxiv (April).
Ljung GM and GEP Box, 1978. On a measure of lack of fit in time series models. Biometrika, 65: 297–303.
Makridakis SG, SC Wheelwright and RJ Hyndman, 1997. Forecasting methods and applications. Wiley 3rd ed.
Wiley, New York.
Moftakhar L and M Seif, 2020. The exponentially increasing rate of patients infected with COVID-19 in Iran.
Arch. Iran. Med., 23: 235–238.Asian J. Med. Biol. Res. 2021, 7 (1)
32
Monllor P, Z Su, L Gabrieli, A Montoro and M de la P Taltavull de La Paz, 2020. COVID-19 Infection Process
in Italy and Spain: Are the Data Talking? SSRN Electronic Journal (January).
Paul R, 2020. Bangladesh confirms its first three cases of coronavirus Reuters. https://www.reuters.com/
article/us-health-coronavirus-bangladesh-idUSKBN20V0FS (accessed September 24, 2020)
Paules CI, HD Marston and AS Fauci, 2020. Coronavirus Infections-More Than Just the Common Cold. JAMA
- Journal of the American Medical Association. American Medical Association.
Petropoulos F and S Makridakis, 2020. Forecasting the novel coronavirus COVID-19. PLOS ONE, 15:
e0231236.
Roy S, GS Bhunia and PK Shit, 2020. Spatial prediction of COVID-19 epidemic using ARIMA techniques in
India. Modeling Earth Systems and Environment, 1(3).
Sato RC esa., 2013. Disease management with ARIMA model in time series. Einstein (São Paulo, Brazil), 11:
128–131.
The Daily Star, 20201. Covid-19 vaccination on-the-spot registration flexibility for senior citizens?
https://www.thedailystar.net/coronavirus-deadly-new-threat/news/covid-19-vaccination-govt-considering-
the-spot-registration-senior-citizens-says-health-services-2044177 (accessed February 15, 2021)
Tran TT, LT Pham and QX Ngo, 2020. Forecasting epidemic spread of SARS-CoV-2 using ARIMA model
(Case study: Iran). Global Journal of Environmental Science and Management-Gjesm, 6: 1–10.
Verma P, M Khetan, S Dwivedi, S Dixit, N Mumbai and M Maharashtra, 2020. Forecasting the covid-19
outbreak: an application of arima and fuzzy time series models. Research Square, 1–15.
WHO, 2020a. Coronavirus Disease (COVID-19) Situation Reports.
WHO, 2020b. Naming the coronavirus disease (COVID-19) and the virus that causes it.
https://www.who.int/emergencies/diseases/novel-coronavirus-2019/technical-guidance/naming-the-
coronavirus-disease-(covid-2019)-and-the-virus-that-causes-it (accessed September 23, 2020)
WHO, 2021. WHO Coronavirus Disease (COVID-19) Dashboard | WHO Coronavirus Disease (COVID-19)
Dashboard.
https://covid19.who.int/?gclid=CjwKCAiAsaOBBhA4EiwAo0_AnEYvueuQJZZ4QncGF7qgsMbofR1Ciye2
bvYgYGq3Y4HNAE_qZxVMOhoC0DIQAvD_BwE (accessed February 15, 2021)
Worldometer, 2021. Bangladesh Coronavirus: 540,592 Cases and 8,274 Deaths - Worldometer.
https://www.worldometers.info/coronavirus/country/bangladesh/ (accessed February 15, 2021)
Yousaf M, S Zahir, M Riaz, SM Hussain and K Shah, 2020. Statistical Analysis of Forecasting COVID-19 for
Upcoming Month in Pakistan. Chaos, Solitons and Fractals.You can also read