Assessing the Fish Stock Status in Lake Trichonis: A Hydroacoustic Approach - MDPI
←
→
Page content transcription
If your browser does not render page correctly, please read the page content below
water
Article
Assessing the Fish Stock Status in Lake Trichonis:
A Hydroacoustic Approach
Triantafyllia-Maria Perivolioti 1, *, Jaroslava Frouzova 2,3 , Michal Tušer 2        and Dimitra Bobori 1
 1   Department of Zoology, School of Biology, Aristotle University of Thessaloniki, 54124 Thessaloniki, Greece;
     bobori@bio.auth.gr
 2   Institute of Hydrobiology, Biology Centre of the Czech Academy of Sciences,
     370 05 České Budějovice, Czech Republic; jaroslava.frouzova@hbu.cas.cz (J.F.);
     michal.tuser@hbu.cas.cz (M.T.)
 3   Institute for Environmental Studies, Faculty of Science, Charles University, Benátská 2,
     128 43 Prague, Czech Republic
 *   Correspondence: triaperi@bio.auth.gr

 Received: 13 April 2020; Accepted: 23 June 2020; Published: 25 June 2020

 Abstract: Fish stock monitoring is an important element for the sustainable management of inland
 water resources. A scarcity of data and the lack of systematic monitoring for Lake Trichonis precludes
 an up-to-date assessment. To assess the current status of pelagic fish stock, a hydroacousting survey
 was conducted for the first time in Lake Trichonis, Greece. In October 2019, the lake was acoustically
 surveyed with two, horizontally and vertically mounted, 120 kHz transducers during day and night.
 A decreasing gradient in pelagic fish density from the western to the eastern shores of the lake was
 observed. Fish density was significantly higher in the intermediate layers of the water column, in the
 eastern region, compared to the western region. The lake appears to host primarily communities of
 small-sized fish (TL: 0–5 cm), whereas larger fish (TL: 5–50 cm) are a small minority of the total fish
 stock. The overall average estimated fish length was approximately 2.4 cm. The adoption of routine
 inland fish stock monitoring through hydroacoustic methods could be a promising step in the effort
 to improve the understanding of unique inland water ecosystems with minimum impact on endemic
 species, as well as to mitigate human impact and achieve long-term sustainable management.

 Keywords: acoustics; fish density; fish distribution; Mediterranean lake

1. Introduction
      Within Europe, in order to eliminate or mitigate freshwater degradation, the Water Framework
Directive (WFD) calls for all the natural aquatic ecosystems to achieve a “good” ecological status.
To date, inland fisheries management is focused on improving the aquatic environment for biodiversity,
allowing the sustainable exploitation of the resources and verifying conservation and protection of
fish and fisheries [1]. However, the methodologies adopted by researchers for the monitoring of
freshwater fish stocks, such as gillnetting, are often unable to support an ecosystem–based management
approach [2], as they fail to comprehensively address the spatiotemporal variability of fish stocks [3],
require high effort [4] and often result in a reduction of fish biomass [5].
      In this context and considering the proposed WFD goals, there is a strong demand for standardized,
reliable, reproducible and non-invasive methods for routine monitoring programs. Satellite-based
Earth Observation data provide safe and cost-effective approaches for the systematic monitoring of
water bodies [6] and fish environmental preferences but fail when it comes to the direct detection
of fish [7]. On the other hand, hydroacoustic methods have been applied in all kinds of aquatic
ecosystems in order to acquire detailed information about aquatic fauna, and especially about fish [8].

Water 2020, 12, 1823; doi:10.3390/w12061823                                         www.mdpi.com/journal/water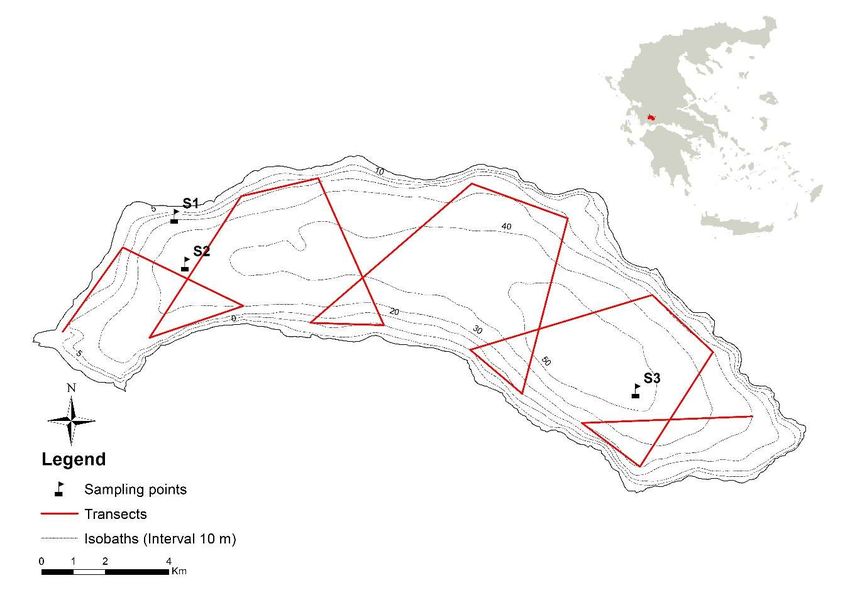
Water 2020, 12, 1823                                                                                  2 of 19

In freshwater ecosystems, hydroacoustic methods are used for assessing fish biomass, fish behaviour,
stock abundance and fish size distribution [8]. The most widely used scientific echosounders in
freshwaters operate at single frequencies of 38, 70, 120 and 200 kHz [9]. The main advantage of
hydroacoustics is the capability to remotely sample large volumes of water in a relatively short amount
of time, providing high spatial resolution in both the horizontal and the vertical domain. In addition,
acoustic measurements are non-invasive and non-extractive [8,10]. Moreover, the technological
improvements in this field and their increased precision have contributed to their extensive use in
both marine and freshwater ecosystems [11–13]. Although there are several limitations of current
hydroacoustic methods, e.g., lack of species identification, difficulties in shallow waters, and limitations
in noisy environments, and despite the considerable need for further research, the application of
hydroacoustics is based on a well-established, standardized methodology for inland fishery production
assessment and management [14].
      Geographically, hydroacoustics research in freshwater ecosystems has so far been concentrated in
North America and Northern and Central Europe (83% of the studies reviewed in [15]). Although the
Mediterranean Basin is found to be globally important for its freshwater biodiversity [16], few studies
have been published with respect to the application of hydroacoustic methods (e.g., [17]). In Greece,
hydroacoustics research has so far been applied in marine systems, mostly focusing on the application
of acoustic techniques to monitor marine fisheries resources (e.g., [18,19]). Nevertheless, hydroacoustic
research on Greek inland waters has not been conducted before.
      Inland fishery production in Greece is impacted by overfishing and habitat alteration, as well as
pollution [20]. Professional fisheries are operated primarily in large lakes. Lake Trichonis, the largest
natural lake in Greece, bears very high economic, cultural and ecological significance. The lake
is important for its fish fauna since 20 species have been recorded in its waters, 11 of which are
endemic (see detailed list in [21,22]), among which there are unique species such as Economidichthys
trichonis. The species present in the lake are classified into 8 different systematic families, which,
ecologically, span all available ecological niches (herbivores, benthivores, planktivores and carnivores).
Among them, there are carnivorous species such as Anguilla anguilla and Silurus aristotelis that feed
at night, predominantly on fish [23,24]. The majority of fish species inhabiting Lake Trichonis
belong to Cyprinidae and spawn during spring to early summer [25–28]. Moreover, small gobies are
reproducing in the same period [25]. Additionally, the lake belongs to one of the most important
fishing attractions of the country. In fact, a land-locked, not overexploited population [29] of Atherina
boyeri is also present in the lake, which offers, with the exploitation of other species such as Rutilus
panosi and Scardinius acarnanicus, economical support for professional fishers. According to the local
Fisheries Department, the primary catch composition for the period of 1989–1998 is made up of small
species. In particular, in October 1989, A. boyeri (Lmax = 13.5 cm [30]; Lm = 5.8 cm [31]) comprised
approximately 64%, while Tropidophoxinellus hellenicus (Lmax = 9.3 cm [31]) and Scardinius acarnanicus
(Lmax = 35.4 cm [32]; Lm = 14–18 cm [31]) contributed each 17% of fisheries production (calculated as
the percentage, per weight, of all catches). In 1990, 47% of the production consisted of T. hellenicus
(Lmax = 9.3 cm [31]), while 22% of production was R. panosi (SL = 12.0–14.0 cm [31]). In 1998, 56%
of the annual production of the lake consisted of Atherina boyeri while 20% of the production was
Scardinius acarnanicus (Lmax = 35.4 cm [32]; Lm = 14–18 cm [31]). Other species (Silurus aristotelis,
Luciobarbus albanicus, Carassius gibelio, Tropidophoxinellus hellenicus) comprised approximately 3% of the
total production. A similar species composition was found to occur during the contemporary fishing
catches (local professional fishermen, pers. comm).
      Despite its significance, because of limited staff, management authorities are having a hard
time monitoring fish harvests of individuals for the prevention of illegal fishing in Lake Trichonis.
Furthermore, the lack of comprehensive long-term studies has resulted in the limited availability of
information about fish stock status in the lake. Although historical data exist as a result of research
projects carried out by universities, institutes and organizations, it is scarce and, in practice, the status
of inland fisheries is largely unknown. Taking all the aforementioned into account, it is important to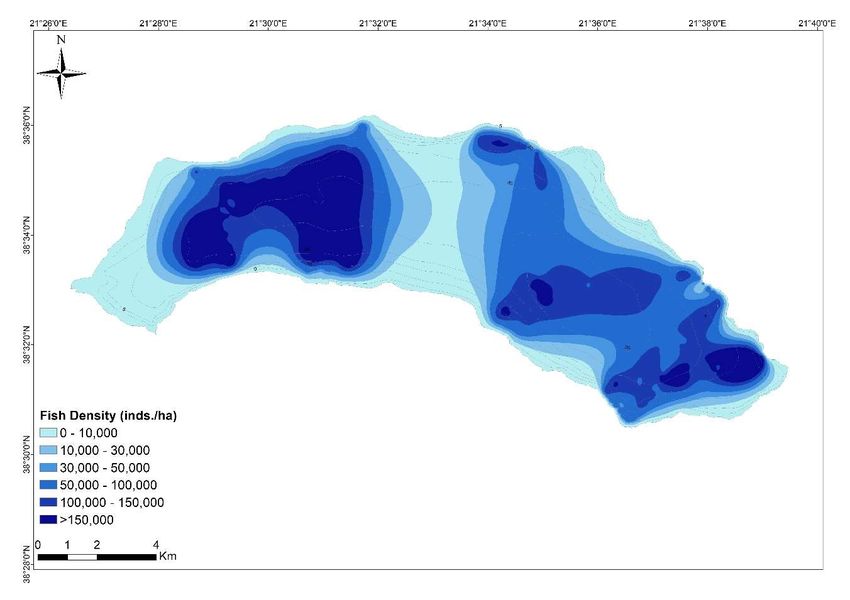
Water 2020, 12, 1823                                                                                                   3 of 21

adopt    a standardized,
 Water 2020, 12, 1823           effective and non-invasive method for the assessment and monitoring                     3 ofof
                                                                                                                             19

inland fish stocks.
 adoptHydroacoustic
         a standardized,   techniques     could
                              effective and       serve as a non-destructive
                                                non-invasive                     tool for inland
                                                                method for the assessment      andfish   monitoring.
                                                                                                    monitoring           The
                                                                                                                   of inland
purpose     of
 fish stocks.   this  study    is to   use  a  hydroacoustic     method    for obtaining   a  detailed   overview     of  the
freshwater     fish stock techniques
       Hydroacoustic         status in Lake couldTrichonis
                                                     serve asanda highlight  the hindrances
                                                                   non-destructive    tool for and   improvements
                                                                                                inland                   that
                                                                                                          fish monitoring.
need
 The purpose of this study is to use a hydroacoustic method for obtaining a detailed overview In
       to be   considered,     in  order   to  adopt   this methodology     as a common      practice  in  Greek  lakes.    of
particular,
 the freshwaterwe aimed       to (i)status
                     fish stock       quantify    freshwater
                                            in Lake   Trichonis fish biomass
                                                                   and         andthe
                                                                       highlight     fish density, (ii)
                                                                                       hindrances     andassess   fish size
                                                                                                            improvements
distributions,
 that need to be   and   (iii) studyinthe
                     considered,         ordervariation
                                                 to adopt ofthis
                                                             fishmethodology
                                                                   vertical distribution   in relation
                                                                                 as a common     practiceto in
                                                                                                             water
                                                                                                               Greek abiotic
                                                                                                                       lakes.
parameters.      Therefore,     despite   ongoing     progress    in hydroacoustics,    the  present  work
 In particular, we aimed to (i) quantify freshwater fish biomass and fish density, (ii) assess fish size      comprises      a
first-step    towards
 distributions,            the study
                    and (iii)     attempts      that should
                                         the variation           bevertical
                                                           of fish   made distribution
                                                                             for fish stock      assessment
                                                                                            in relation          in abiotic
                                                                                                          to water    larger
biogeographical
 parameters. Therefore, despite ongoing progress in hydroacoustics, the present work comprisesofa
                       scales   [15],  and    especially   in  the  Mediterranean    countries,   where     high  levels
endemicity      are observed.
 first-step towards     the attempts that should be made for fish stock assessment in larger biogeographical
 scales [15], and especially in the Mediterranean countries, where high levels of endemicity are observed.
2. Study Area
 2. Study
     Lake Area
            Trichonis, located in the central-western part of Greece, has a surface area of 96.9 km2, a
maximum      length of 19
      Lake Trichonis,       km, and
                         located       is the
                                  in the      deepest (maximum
                                           central-western  part ofdepth
                                                                     Greece, of has
                                                                                58 m,  averagearea
                                                                                    a surface   depth  of 30km
                                                                                                    of 96.9   m)2 ,
natural  lake  in Greece  (Figure  1).  The trophic status of  the lake  is characterized  as
 a maximum length of 19 km, and is the deepest (maximum depth of 58 m, average depth of 30 m) oligotrophic  [33].
Lake   Trichonis
 natural            belongs
          lake in Greece      to the1).Natura
                           (Figure              2000 status
                                         The trophic  network    established
                                                            of the              under the as
                                                                    lake is characterized    Habitats Directive
                                                                                               oligotrophic  [33].
92/43/EEC   and   is characterized  as  an area with high potential   research   value [34]. Responsible
 Lake Trichonis belongs to the Natura 2000 network established under the Habitats Directive 92/43/EEC    for the
protection,   management     and  monitoring    of the lake is  the Management      Authority   of Messolonghi
 and is characterized as an area with high potential research value [34]. Responsible for the protection,
Lagoon.
 management and monitoring of the lake is the Management Authority of Messolonghi Lagoon.

       Figure 1. Depiction of the study area and lake bathymetry (derived from the digitization of 1:50,000 scale
      Figure  1. Depiction
       topographic  maps,ofwhich
                              the study  area and
                                     constitute an lake bathymetry
                                                    appropriate     (derived
                                                                reference     fromfor
                                                                           source  the such
                                                                                        digitization of 1:50,000
                                                                                              geomorphometric
      scale topographic  maps,  which   constitute an appropriate reference source for such
       information [35,36]) with the hydroacoustic survey and the sampling points overlaid.  geomorphometric
      information [35–36]) with the hydroacoustic survey and the sampling points overlaid.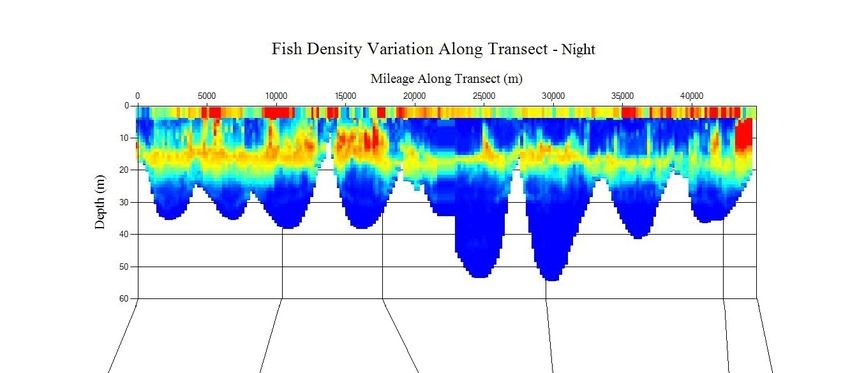
Water 2020, 12, 1823                                                                                 4 of 19

3. Materials and Methods

3.1. Hydroacoustic Survey Design
      The hydroacoustic survey was carried out in Lake Trichonis during the period of 3–10 October
2019. The pattern of the survey transects was designed in such a way, as to include fish communities
along areas of identical or similar depths (i.e., along depth contours) (Figure 1). Horizontal and vertical
recordings were carried out simultaneously using a suitable arrangement.
      In order to assess the variation in diurnal estimates of fish biomass and distribution, the survey
was conducted during both day and night [37]. The day survey commenced one hour after local
sunrise, whereas the night survey commenced one hour after local sunset. Considering the high
sensitivity of horizontal recording to the noise introduction into the hydroacoustic records, the survey
was carried out on windless days. In total, two hydroacoustic surveys were needed to cover the whole
lake; one during daytime and one during nighttime. The total length of each survey was ~40 km,
resulting in a coverage coefficient of 4 per survey [38,39]. Surveys were grouped per time of day,
into daytime and nighttime surveys.
      A Simrad EK60 echosounder with a frequency of 120 kHz, equipped with two simultaneously
operating transducers (SIMRAD ES120-7C), was used to collect the acoustic data. The transducers were
mounted at a depth of about 1 m, at the front of the boat. The first transducer was vertically oriented
and the second one horizontally oriented, enabling fish detection in the surface zone. The horizontal
transducer was oriented perpendicularly with respect to the vertically oriented transducer and was
facing towards the side of the vessel (perpendicular to the sailing direction). The echosounder was
driven by the Simrad ER software. The ping interval was set to 0.2 s. Each transducer transmitted
2–3 pings per second, alternating between transducers (known as multiplexing), for a total ping rate of
5–6 pings per second. During surveying, the boat maintained a constant speed of 6 km/h and a volume
of 3.7 × 10⁶ m3 of water was explored. For the full calibration of the system, a standard copper sphere of
23 mm in diameter was used and gains were calculated according to Demer et al., 2015 [40]. The sphere
was placed at approximately 9.4 m of depth from the transducer, which was aimed vertically towards
the sphere. The calibration was performed before starting with the first day survey. The effect of
background (passive) noise was removed from all files by subtracting passive listening data collected
before the survey. The background noise was checked by stopping pulse transmission and putting the
equipment into a passive listening mode. Passive listening was performed on a windless day before
the acoustic survey.
      Survey positioning was assisted by a Garmin GPSMAP 60CSx GPS receiver (Geolocation/horizontal
accuracy of 3–5m—95%).

3.2. Hydroacoustic Data Processing
     Acoustic raw data were converted to compatible formats and processed using the Sonar5 Pro
software (CageEye A/S, Oslo, Norway). Fish density values (number of individuals per hectare) were
calculated using the SV /TS scaling method [8], which uses volume back-scattering strength, SV , and the
mean target strength (TS) to calculate fish density.
     Acoustic biomass was expressed as the volume backscattering strength (SV ), which is the equivalent
logarithmic measure of the volume backscattering coefficient (sV ) obtained through echo-integration [8].
SV has been found to be a good expression of biomass distributions, especially for small targets [8].
     Mean target strength (TS) was estimated based on single echo detections (SED) [41]. In order to
express TS into total length measurements (cm) rather than dB, empirical TS-length relationships were
used. Equations for a 120 kHz echosounder given by [42] in the case of vertical and [43] in the case of
horizontal recordings were applied. Fish Total Length distribution was categorized into 50 classes by
1 cm step, starting from zero.
     During the data post-processing, the threshold for target strength (TS) was set to −65 dB and for
SV to −71 dB, in order to cover the entire possible size spectrum of fish targets [44]. The collected data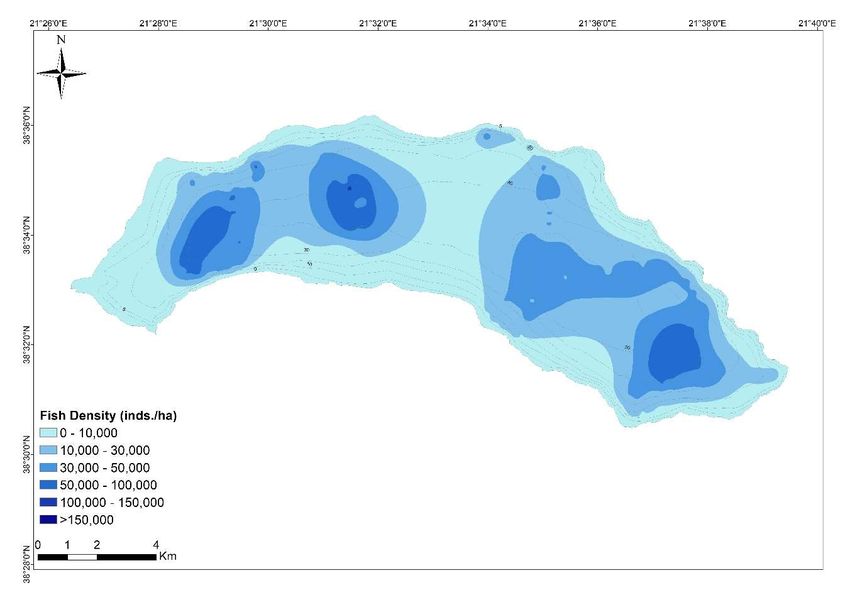
Water 2020, 12, 1823                                                                                      5 of 19

were visually examined to remove subsets with noise and non-fish targets, in order to improve the
signal-to-noise ratio of the dataset. A layer of 0.5 m above the detected bottom layer was excluded in
order to eliminate the effects of bottom back-scattering. A surface layer of 4 m was applied in horizontal
and vertical recordings in order to exclude the near field. Each transect in both the horizontal and the
vertical survey was divided into 200-m segments. In order to assess the vertical distribution of fish, the
water column recorded in the vertical survey was divided into 1-m thick depth layers. The vertical
data were processed up to a depth limit equal to the maximum depth up to the bottom, depending
on the position of the segment within the transect. The horizontal data were processed up to a range
equal to the maximum depth of the lake. The surface layer ranging from 0–4 m was covered by the
horizontally-aimed transducer and compensates for the lack of data in the near field of the vertical
transducer. Data recorded horizontally were processed using deconvolution procedure. Deconvolution
is a procedure employed in the processing of horizontally recorded data and is especially used for the
determination of target size. It is based on stochastic assumptions of random aspect orientation [45].
      The data were taken along the transect, which was divided in segments. In charts of vertical
distribution, the horizontal layer was taken to describe the entire surface layer and is represented
by a single depth range. The rest of the vertical layers have been accordingly matched and aligned,
below the horizontal layers. The overall arrangement represents a division of the total insonified
lake volume in cells, each of which spans 200 m × 1 m (along-transectx vertically), with a variable
athwart dimension for each depth, as a result of the conically-shaped beam. Exceptionally, the cells of
the surface layer were sized 200 m × 4 m (along-transect x vertically). The data were either summed
or averaged vertically (for vertical analyses) and averaged or summed horizontally (i.e., along the
transect) for horizontal or lengthwise analyses.
      Due to the potential effects of multiple scattering and acoustic shadowing caused by very
dense aggregations of fish on TS and the consequent density estimates, additional measures were
checked and examined. These include the share of single echoes (the ratio between volume
backscattering strength resolved as single echoes and the total volume backscattered strength) and
the Sawada index NV (the number of fish per acoustic sampling volume where TS is estimated) [46]
(see Supplementary Materials).

3.3. Environmental Parameters
      In situ measurements of physico-chemical parameters were conducted during the day survey in
Lake Trichonis at three sampling stations (Table 1 and Figure 1). In order to estimate the temperature
(◦ C) and dissolved oxygen (DO) (mg/L) vertical profiles, the measurements were carried out at 1-m
depth intervals using a YSI multiparameter probe (YSI Incorporated, Ohio, USA).

                          Table 1. Locations of the 3 sampling stations in Lake Trichonis.

          Lake Location           Latitude (deg)         Longitude (deg)        Sampled Depth Range (m)
        Sampling point S1            38.58625                21.48000                        22
        Sampling point S2            38.57250                21.48301                        34
        Sampling point S3            38.53671                21.61033                        50

3.4. Statistical Analysis
     The calculated parameters were mapped along the transect, as well as depth-wise, and were
explored for differences between day and night. Mean SV (dB), share of single echoes (%) and fish
density (inds./ha) were averaged per layer, mapped by depth and compared for differences between
day and night. Cross-correlation analysis was performed on the average fish density depth-wise
distributions using depth-lag to determine the mean depth difference between day and night fish
density distributions. Fish density was explored for spatial distribution differences, while it was also
color-mapped both along transect and depth-wise, in the West-East direction, in order to visualize the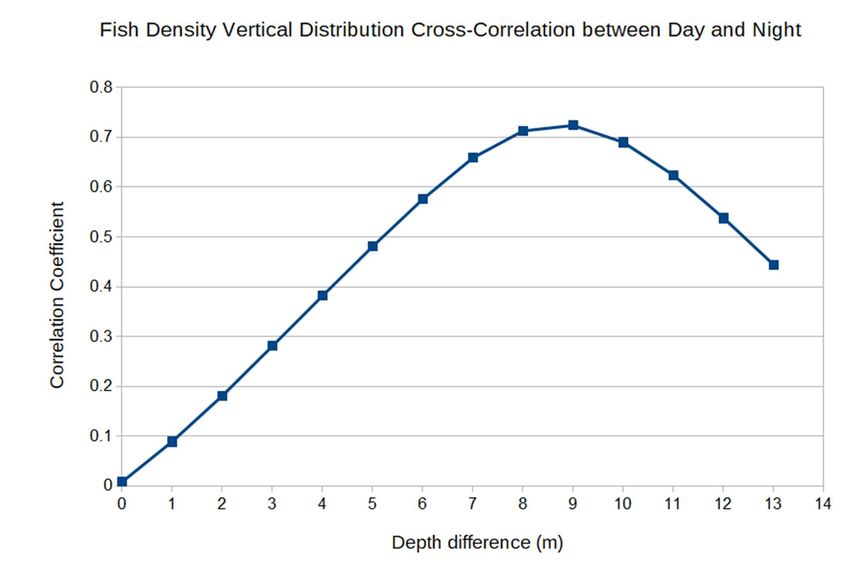
Water 2020, 12, 1823                                                                                6 of 19

variation in both dimensions at the same time, where transect mileages were matched to lake regions
based on the transect path. Finally, fish density was also summed depth-wise at each segment and
interpolated spatially to create total-water-column fish density maps for day and night.
      To study fish density in combination with size composition, the targets were separated in two
classes, ≤5 cm (small fish) and >5 cm (large fish) and density was re-calculated for small and large fish,
respectively, using the corresponding target count ratios. The target count proportions for small and
large fish were also mapped independently as stacked absolute values vs. depth (excluding layers
with a total of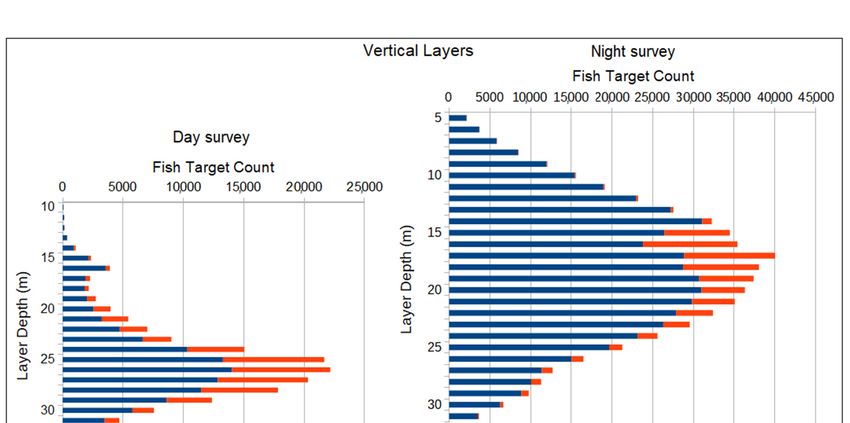
Water 2020, 12, 1823                                                                                                                        7 of 19

a p-value of 0.05 for the t-test, meaning that this is a marginal difference that could be statistically
accepted. Moreover, average fish density is more than double at night than during the day in the
surface layer (0–4 m) and 5 times higher at 15 m (Figure 4). Application of a cross-correlation model
between day and night vertical distributions and using depth as the lag parameter, reveals an average
depth-wise offset of ~9 m between the two distributions, with a maximum correlation coefficient of
0.724 at dh = 9 m (Figure 5). This means that the distributions are very similar but translated with
respect to each other by approximately 9 m of depth.
                            Water 2020, 12, 1823                                                                                  7 of 21

                       Water 2020, 12, 1823                                                                                 8 of 21
            Figure 2. SV (dB) vertical
                               Figure 2. SVdistribution        during
                                           (dB) vertical distribution     thetheday
                                                                      during          and
                                                                                 day and    night
                                                                                         night surveysurvey     in Lake Trichonis.
                                                                                                      in Lake Trichonis.

                                  The share of single echoes did not exhibit large fluctuations comparing between acquisition
                            times (Figure 3). Specifically, the day average was 17 % ± 20.2 %, ranging from 0 % to 91.9 %, while
                            the night average was 15 % ± 11.3 %, ranging from 0 % to 44.8 %. Day-to-night difference was not
                            statistically significant (p = 0.39). Most of the values were relatively low, typically less than 40% in
                            most layers, during both day and night. The layers close to the surface (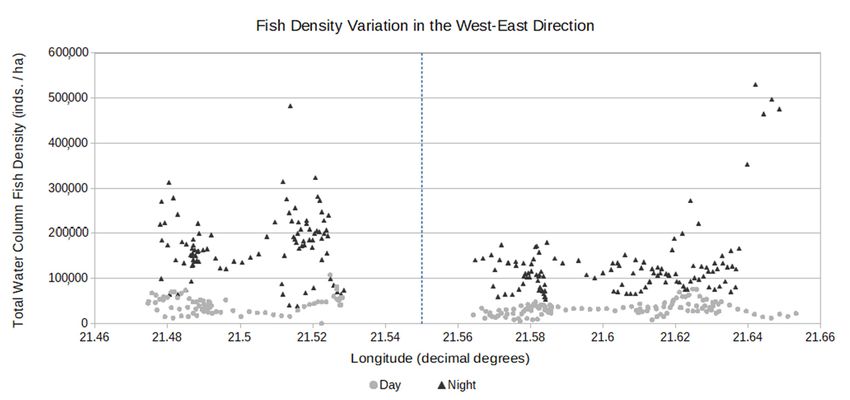
Water 2020, 12, 1823                                                                                                               8 of 19

                   Water 2020, 12, 1823                                                                         10 of 21

      Figure 4. Vertical distribution
                              4       of average density (inds./ha) for each water column layer during day
      and night surveys.

                                          6

                                                                             1

      Figure 5. Cross-correlation             between
                     Figure 5. Cross-correlation           day
                                                 between day     vs. using
                                                             vs. night,   night,
                                                                               depthusing
                                                                                     (h) as thedepth    (h) as
                                                                                                lag parameter.    the lag parameter.
                                                                                                               A depth
                     difference
      A depth difference      ofofdhdh =
                                       = ~9~9
                                            mm produces the maximum
                                                  produces             correlation between
                                                               the maximum                   day and night
                                                                                     correlation           fish density
                                                                                                      between     day and night fish
                     distributions.
      density distributions.
                         Total water column fish density exhibited significant differences between the shallow and the
                deep
      Total water     areas of fish
                   column        the lake,  separating
                                      density           at a longitude
                                                   exhibited            decimal differences
                                                                 significant     degree of 21.55between
                                                                                                   (p < 0.0001,the
                                                                                                                 Figure 6).
                                                                                                                    shallow   and the deep
                Average fish density during the day was 41925 ± 18735 inds./ha in the shallow areas (western side of
areas of the lake,   separating
                the lake) and 32424 at    a longitude
                                      ± 13548                decimal
                                                inds./ha in the         degree
                                                                deep areas          of (eastern
                                                                           of the lake  21.55 (p   < (total
                                                                                                area) 0.0001,
                                                                                                            waterFigure
                                                                                                                   column 6). Average fish
density duringsums).    During
                  the day     wasthe night,
                                     41,925 fish±density
                                                   18,735 wasinds./ha
                                                              174986 ± 69521  inds./ha
                                                                         in the        in the western
                                                                                   shallow     areasregion   and 127930
                                                                                                       (western      side± of the lake) and
                79934 inds./ha in the eastern region (total water column sums). An assumed mean day fish density
32,424 ± 13,548difference
                  inds./ha     in the deep areas of the lake (eastern area) (total water column sums). During
                           of 8880 inds./ha between regions produces a marginal value of p = 0.05, while for the night,
                a marginalwas
the night, fish density      p = 0.05 value is±produced
                                   174,986        69,521by     an assumed
                                                            inds./ha        meanwestern
                                                                        in the    night fish density
                                                                                              regiondifference   of ~45750
                                                                                                       and 127,930       ± 79,934 inds./ha
in the eastern inds./ha.
                 regionThe      fish density depth-wise and spatial distribution along the transect, as well as the
                            (total    water column sums). An assumed mean day fish density difference of
                differences between day and night are shown in detail in Figures 7 and 8. A horizontally interpolated
8880 inds./ha between         regions
                spatial distribution       produces
                                      of fish             a marginal
                                              density is shown             9 and 10.of p = 0.05, while for the night, a marginal
                                                                in Figures value
p = 0.05 value is produced by an assumed mean night fish density difference of ~45,750 inds./ha. The
fish density depth-wise and spatial distribution along the transect, as well as the differences between
day and night are shown in detail in Figures 7 and 8. A horizontally interpolated spatial distribution
of fish density is shown in Figures 9 and 10.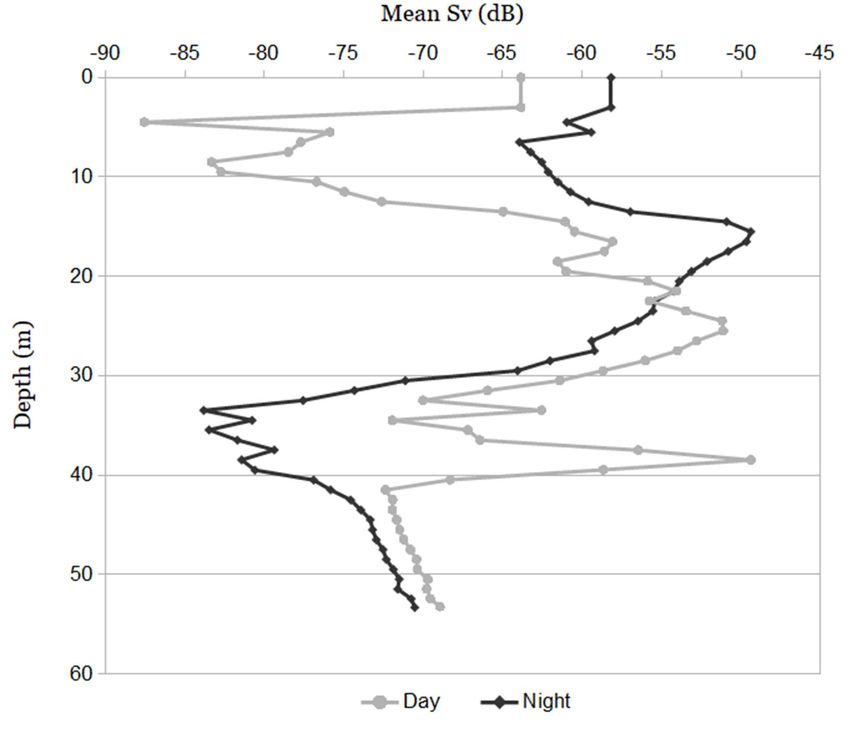
Water 2020, 12, 1823 9 of 19
4
Figure 6. Total water column fish density vs. longitude of averaged-cell midpoint. Significantly
6
different fish density clusters are visible between the regions for both day and night.
1
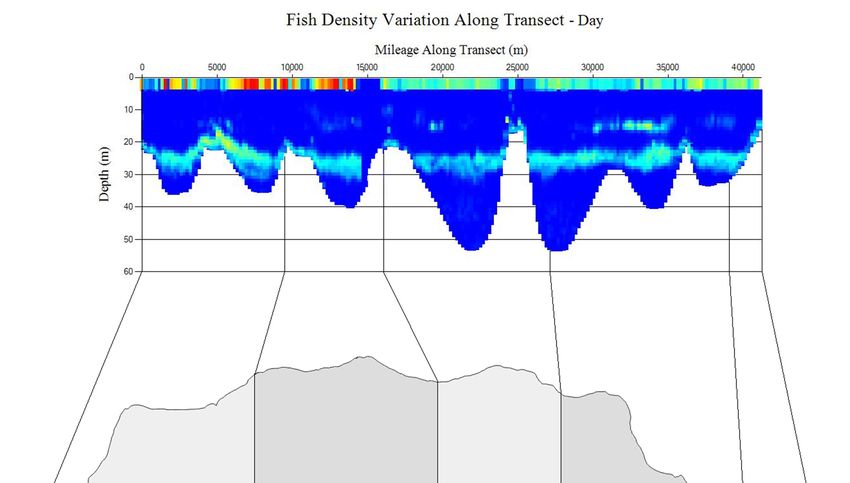
Figure 7. Color map of daytime fish density depth-wise and along transect variations. Figure is
7
spatially referenced with respect to the lake.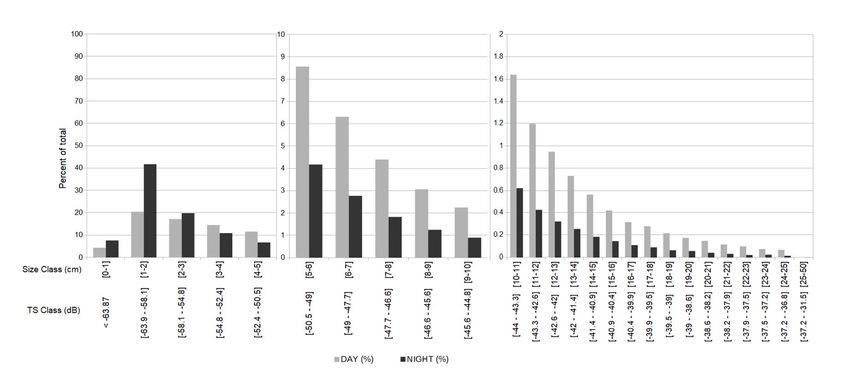
Water 2020, 12, 1823                                                                                             10 of 19

      Figure 8. Color map of nighttime fish density depth-wise and along transect variations. Figure is
8          Water 2020, 12, 1823                                                            13 of 21
      spatially referenced with respect to the lake.

13                        Fish9.density
               Figure 9.Figure           (inds./ha) distribution during the day survey in lake Trichonis.
                                 Fish density (inds./ha) distribution during the day survey in lake Trichonis.

                                                             3
Water 2020, 12, 1823 11 of 19
Figure 9. Fish density (inds./ha) distribution during the day survey in lake Trichonis.
Water 2020, 12, 1823 14 of 21
Figure 10. Fish density (inds./ha) distribution during the night survey in lake Trichonis.
Figure 10. Fish density (inds./ha) distribution during the night survey in lake Trichonis.
4.2. Fish Size Composition and Distribution
4.2. Fish Size Composition and Distribution
Individual fish lengths, converted from TS data, ranged up to 50 cm. The length of most of the
detected fish isfish
Individual notlengths, converted
larger than from TS11
5 cm (Figures data,
andranged up to 50
12). Smaller cm.with
fish, Thelengths
length of most
less thanof5the
cm
detected
dominate the total counts and observed fish density diminishes as target size increases. 5After
fish is not larger than 5 cm (Figures 11 and 12). Smaller fish, with lengths less than cm
dominate
separating theby
total counts and
orientation observed
(surface fishvs.
layer density diminishes
vertical as target
data layers) andsize
timeincreases.
of day andAfter separating
weighing for
by orientation (surface layer vs. vertical data layers) and time of day and weighing
class size, weighted mean fish size for the surface layer was ~1.6 cm for the day survey and ~2 cm for for class size,
weighted
the nightmean
survey,fishwhile
size for
for the
the surface
layers fromlayer4was
m to~1.6
the cm for the
bottom, day fish
mean survey
sizeand
was~2 cmcm
~4.5 forfor
thethe
night
day
survey, while for the layers from
survey and 2.9 cm for the night survey. 4 m to the bottom, mean fish size was ~4.5 cm for the day survey and
2.9 cm for the night survey.
Figure11.
Figure 11.The
Thesize
size(total
(totallength,
length,cm)
cm)and
andTarget
TargetStrength
Strength(dB)
(dB)distribution
distributionofofpelagic
pelagicfish
fishrecorded
recorded
duringnight
during nightand
andday
dayvertical
verticalsurveys
surveysininLake
LakeTrichonis.
Trichonis.Figure 11. The size (total length, cm) and Target Strength (dB) distribution of pelagic fish recorded
Water 2020, 12, 1823 12 of 19
during night and day vertical surveys in Lake Trichonis.
Figure 12.12.The
Figure Thesize
size(total
(totallength,
length, cm)
cm) and Target Strength
and Target Strength(dB)
(dB)distribution
distributionofof pelagic
pelagic fish
fish recorded
recorded
during night and day horizontal surveys in Lake Trichonis.
during night and day horizontal surveys in Lake Trichonis.
Small fish density during the day was 922 ± 1324 inds./ha, while during the night, it was
Small fish density during the day was 922 ± 1324 inds./ha, while during the night, it was 3068 ±
3068
3496± 3496 inds./ha.
inds./ha. Correspondingly,
Correspondingly, large
large fish fish during
density densitythe during the 304
day was day± was 304 ± 463
463 inds./ha, inds./ha,
whereas
whereas during the night, large fish density was 405 ± 808 inds./ha. Small fish density was
during the night, large fish density was 405 ± 808 inds./ha. Small fish density was significantly larger significantly
larger during
during the night
the night (p < with
(p < 0.001), 0.001), with a marginal
a marginal p = 0.05
p = 0.05 being being by
produced produced
an assumedby an assumed
mean mean
difference
difference equal to 1220 inds./ha (of size <
equal to 1220 inds./ha (of size < 5 cm). Large-fish density distribution by depth was not significantlynot
5 cm). Large-fish density distribution by depth was
different between
significantly daybetween
different and night (Figure
day 13). Horizontal
and night (Figure 13).layer fish density
Horizontal exhibits
layer fish fish density
density valuesfish
exhibits
more than
density valuesanmore
orderthan
of magnitude
an order ofhigher than the
magnitude vertical
higher thanlayers, for bothlayers,
the vertical day andfornight
both (Figure
day and14).
night
8
(Figure 14).
Figure 13. Vertical distribution of density (inds./ha) of the detected target size classes (small:Water 2020, 12, 1823 13 of 19 was almost constant up to a depth of 14 m, after which it exhibited a noticeable gradual drop, reaching its lowest value (14.3 ◦ C) at 22 m. 14 14 Figure 14. Proportional fish distribution by size, depth and time of day. Layers with
Water 2020, 12, 1823                                                                                     14 of 19

of depth than in the surface layer (approximately 8.3 mg/L). In the deep point of the western region,
the highest concentration of DO (approximately 11.9 mg/L) was recorded at a depth around 15–27 m.
An anoxic layer was also recorded after the depth of 32 m.
     The vertical distribution of fish during the day survey varied according to thermal stratification
and seemed to roughly follow the vertical variations of DO concentrations (Table 2). Based on the
results of correlations between fish density and dissolved oxygen, it appears that as the depth of the
sampled water column increases, a strong correlation manifests as the relationship between these two
parameters. An apparent rise in correlation coefficient absolute values was observed between fish
density and dissolved oxygen, especially around the area of the deepest point of the lake, whereas
anoxic conditions occurred in the bottom layers.

      Table 2. Correlation coefficients between fish density (inds./ha) and DO (mg/L)/Temperature (◦ C) for
      the three sampling points in Lake Trichonis.

                       Sampling Point S1             Sampling Point S2              Sampling Point S3
                                 Dissolved                       Dissolved                       Dissolved
                 Temperature                    Temperature                     Temperature
                                  Oxygen                          Oxygen                          Oxygen
       R               −0.56         0.54          −0.52            0.53           0.018            0.61
      R2                0.31         0.29           0.27            0.28          0.00032           0.37
    p-value            0.013        0.018          0.0026          0.0023           0.91         5.9 × 10⁻⁶
      DF                 17           17             29              29              45              45

5. Discussion
      Volume backscattering strength (SV ), was used in this study as a proxy variable for fish biomass [8].
The calculation of biomass based on acoustic recordings requires knowledge of an overall fish SL–W
(Standard Length to Weight) relationship, particularly for a mixed-species community, as well as TS
estimates for fish fauna [49]. Given that this was the first hydroacoustic survey in Lake Trichonis,
it was not feasible to obtain the aforementioned values. SV values were compared among the different
layers of the water column [50]. The average SV values in Lake Trichonis −66.1 dB in the night and
−65.9 dB in the day were slightly lower than in other 18 European lakes (on average −62.8 dB) [51].
The recorded range of SV values in the different layers was also comparable with values of monomictic
alpine lakes with similar morphology (ranges from −62.3 to −67.4 dB in different layers and lakes) [9]
and with the results of Cech et al. [52], who studied distributions of juvenile fish (range of SV was
measured from −71.3 to −45.7 dB). Similarly to this last study, in Lake Trichonis, fish formed more or
less dense layers; the type of aggregations is probably dependent on the kind of species.
      Fish density was found to be lower in the deep areas (eastern area) than the shallow areas
(western area) of the lake. Additionally, fish density was higher in intermediate depth locations,
indicating that fish targets are generally distributed in the water column at larger depths. An offset
between day and night was observed in the vertical distribution of fish, estimated at approximately
9m (fish were located deeper during the day). Fish were more closely aggregated during the day and
more dispersed at night. Vertical migration behavior with diel periodicity is well described [53] and is
linked to predation avoidance and reduction of competition [54].
      A statistically significant difference was observed in vertical distribution between day and night
in the pelagic zone. The overall recordings revealed a relatively high degree of fish aggregation
(low share of single echoes), especially during daytime, which, in turn, makes it harder to discern and
count single targets and decreases the reliability of density estimations. According to Appenzeller
and Leggett [55], the estimation of the number of targets can be biased towards smaller values when
fish form dense aggregations, due to acoustic shadowing. Precise determination of fish target counts
should coincide with the time of their maximal dispersion [37]. The share of single echoes did not
present significant changes in depth distribution between day and night. Nevertheless, during the
night, significantly larger fish densities were observed at smaller depths, thereby observing a wider
Water 2020, 12, 1823 15 of 19
size spectrum of fish living in the lake. In this respect, it may suggest that night hydroacoustic surveys
in Lake Trichonis could be more suitable. Nonetheless, we recommend that diel differences be further
investigated by carrying out additional day-night comparisons, also using fish catches. The use of
hydroacoustics in a future setting over the same study area would be useful to investigate the possible
bias and aggregation-related behavior and simultaneously also the true size composition by the use of
appropriate fishing gear.
In relation to higher fish densities, values of the Sawada index were also taken into account to
consider reliability of the density estimates. In most of the analyzed cells, values of NV were below
the commonly accepted limit of 0.1 by Parker-Stetter et al. [56], only exceeding 0.1 in the layers with
the densest aggregations, with a few or no single echo detections. Nevertheless, TS distribution was
examined. There was no statistically significant difference in the two distributions (TS for all NV and
TS only for NV < 0.1) in the lake, neither for the day (K-S D-value = 0.2143, p = 0.9205), nor for the
night (K-S D-value = 0.167, p = 0.9985) (for details, see Supplementary Materials).
The majority of all detected targets have a small size, while larger targets only comprise a minimal
fraction. The presence of small-sized fish [21] is also a reason for the threshold used in this study, which
may seem to be lower than other hydroacoustic studies using a frequency of 120 kHz. The lake hosts
20 fish species [21], most of which are of small size, such as the big-scale sand smelt Atherina boyeri,
which occupies the pelagic regions of the lake and its population is extremely abundant, supporting a
valuable commercial purse-seines fishery [29]. It is important to note that the targets observed could
not be other than fish, as no big zooplankton, which could overlap with small fish, was observed in
the lake [22], nor invertebrates [57] could be expected in this autumn time. Nevertheless, we cannot
exclude the possibility of juvenile fish being mixed into the composition of the recorded populations.
However, due to the lack of catch data in the present study, as well as due to the lack of corresponding
historical data, it is not possible to identify the smaller fish target species, thus precluding a conclusive
interpretation of the results. Consequently, provided that the detected fish target species composition,
biology and behavior are not known, further investigation into the variations in acoustic parameters
across an annual cycle is warranted [58]. It is also necessary to use control catches to enable proper
interpretation of acoustic targets.
A general estimation of the fish length, even roughly, is crucial to the understanding of an
aquatic ecosystem [9]. Fish length from TS data can be calculated based on an equation that expresses
this relationship [8]. The most important factor affecting acoustic estimates appears to be the
appropriate relationship between the fish length and TS for a given population. Equations of Love [42]
and Frouzova et al. [43] were derived from different fish species and size ranges, and therefore,
the estimation of fish length based on those equations ought to be further assessed with data from
catches regarding their use for the endemic species of the lake.
The vertical distribution of the fish in the lake appears to have been primarily driven by water
temperature and oxygen stratification. In the present study, the surface layer density does not seem
to be correlated to dissolved oxygen and water temperature, but other factors, such as predation
risk, may play an important role. Similarly to Doulka and Kechayias [59], Lake Trichonis showed
a minimum saturation value of dissolved oxygen in the lower hypolimnion in autumn. However,
in contrast to the study of Doulka and Kechayias [59], in the present study anoxic conditions were
recorded in the lake’s hypolimnion, rendering the DO concentration a limiting factor for the vertical
dispersion of fish. As a result, in the vertical domain, fish distribution was highly correlated with
oxygen stratification, i.e., it decreased as the dissolved oxygen also decreased. This correlation between
density and dissolved oxygen is well established, while the relation can be explained, in part, by the fact
that there is a natural threshold of oxygen, beyond which survival very quickly becomes non-viable [60].
It is also important to note that the presence of larger abundances of large fish in intermediate layers is
in agreement with the results of Breitburg et al. [61], according to which the response of predators
and prey to oxygen distribution variations strongly influenced the spatial focus of trophic interactions.Water 2020, 12, 1823 16 of 19
Consequently, the metalimnion in Lake Trichonis is the most productive depth stratum, due to the
intense variation of abiotic and biotic variables [59].
The methodology presented and the results obtained through this research were the first step to
present and analyze the challenges for optimizing a hydroacoustic approach for monitoring freshwater
fish stock in Greek lakes. This methodology could be incorporated in the decision-making process
towards the improvement of the implementation of the EU Water Framework Directive 2000/60.
The use of hydroacoustic techniques can eliminate some distortions traditionally contained in censuses
and studies of fish fauna in lakes. Lake Trichonis is traditionally exploited by commercial fishermen,
most of which use purse-seine fishing. The knowledge of feeding and nursery grounds where fish are
gathered during their vertical and horizontal movements through the day will help and support local
authorities and contribute to decision making in applying restrictions for a more sustainable fisheries
management. The potential adjunct usage of common fishing gear might not be able to adequately
reveal the potentially essential role of small fish in the open waters of Lake Trichonis. As a result,
the proposed methodology can provide new insights for enhancing fisheries monitoring.
Supplementary Materials: The following are available online at http://www.mdpi.com/2073-4441/12/6/1823/s1.
Figure S1: Empirical distribution functions for TS, categorized in 2-dB bins separately for day and night, as well as
for the sets of all sampled cells, and of only cells with NV < 0.1. Figure S2: Sawada NV index vertical distribution
with 1-sigma confidence intervals (left) and day-night difference, i.e., day values minus night values (right).
Author Contributions: Conceptualization, T.-M.P. and D.B.; methodology T.-M.P., M.T. and J.F.; formal analysis,
T.-M.P.; investigation, T.-M.P., M.T. and J.F.; data curation, T.-M.P., M.T. and J.F.; writing—original draft preparation,
T.-M.P.; writing—review and editing, M.T., J.F. and D.B.; visualization, T.-M.P.; supervision, M.T., J.F. and D.B.;
funding acquisition, T.-M.P. All authors have read and agreed to the published version of the manuscript.
Funding: This research is co-financed by Greece and the European Union (European Social Fund–ESF) through
the Operational Programme “Human Resources Development, Education and Lifelong Learning” in the context of
the project “Strengthening Human Resources Research Potential via Doctorate Research–2nd Cycle (MIS–5000432),
implemented by the State Scholarships Foundation (IKY). The hydroacoustic equipment used and J. Frouzova
and M. Tušer were partly supported by the Czech Science Foundation (project P504/12/1186), the SoWa
Research Infrastructure funded by MEYS CZ grant LM2015075, program “Project of Large Infrastructure for
Research, Development, and Innovations” and Operational Programme Research, Development and Education
(CZ.02.1.01/0.0/0.0/16_013/0001782).
Acknowledgments: The authors would like to thank Jan Kubečka, Vladislav Draštík and Antonios Mouratidis
for their invaluable comments and suggestions, which have been of significant help for improving the quality of
this study. Last but not least, the authors would like to thank George Perivoliotis for providing a robust adaptable
frame construction and helping during the fieldwork.
Conflicts of Interest: The authors declare no conflict of interest.
References
1. Arlinghaus, R.; Mehner, T.; Cowx, I.G. Reconciling traditional inland fisheries management and sustainability
in industrialized countries, with emphasis on Europe. Fish Fish. 2002, 3, 261–316. [CrossRef]
2. FAO. Fisheries Management. The Ecosystem Approach to Fisheries; FAO Technical Guidelines for Responsible
Fisheries No. 4; FAO: Rome, Italy, 2003.
3. Oliveira, A.G.; Gomes, L.C.; Latin, J.D.; Agostinho, A.A. Implications of using a variety of fishing strategies
and sampling techniques across different biotopes to determine fish species composition and diversity.
Nat. Conserv. 2014, 12, 112–117. [CrossRef]
4. Jackson, D.A.; Harvey, H.H. Qualitative and quantitative sampling of lake fish communities. Can. J. Fish.
Aquat. Sci. 1997, 54, 2807–2813. [CrossRef]
5. Winfield, I.J.; Fletcher, J.M.; James, J.B.; Bean, C.W. Assessment of fish populations in still waters using
hydroacoustics and survey gill netting: Experiences with Arctic charr (Salvelinus alpinus) in the UK. Fish. Res.
2009, 96, 30–38. [CrossRef]
6. Mouratidis, A.; Sarti, F. Flash-flood monitoring and damage assessment with SAR data: Issues and future
challenges for earth observation from space sustained by case studies from the Balkans and Eastern Europe.
Lect. Notes Geoinf. Cartogr. 2013, 199659, 125–136.Water 2020, 12, 1823 17 of 19
7. Perivolioti, T.M.; Tušer, M.; Frouzova, J.; Znachor, P.; Rychtecký, P.; Mouratidis, A.; Terzopoulos, D.; Bobori, D.
Estimating Environmental Preferences of Freshwater Pelagic Fish Using Hydroacoustics and Satellite Remote
Sensing. Water 2019, 11, 2226. [CrossRef]
8. Simmonds, J.; MacLennan, D. Fisheries Acoustics. Theory and Practice, 2nd ed.; Blackwell Publishing: Oxford,
UK, 2005.
9. Guillard, J.; Lebourges-Daussy, A.; Balk, H.; Colon, M.; Jóźwik, A.; Godlewska, M. Comparing hydroacoustic
fish stock estimates in the pelagic zone of temperate deep lakes using three sound frequencies (70, 120, 200
kHz). Inland Waters 2014, 4, 435–444. [CrossRef]
10. Godlewska, M.; Swierzowski, A.; Winfield, I.J. Hydroacoustics as a tool for studies of fish and their habitat.
Int. J. Ecohydrol. Hydrobiol. 2004, 4, 417–427.
11. Baran, R.; Jůza, T.; Tušer, M.; Balk, H.; Blabolil, P.; Čech, M.; Draštík, V.; Frouzova, J.; Jayasinghe, A.; Koliada, I.;
et al. A novel upward-looking hydroacoustic method for improving pelagic fish surveys. Sci. Rep. 2017, 7,
1–12. [CrossRef]
12. Draštík, V.; Godlewska, M.; Balk, H.; Clabburn, P.; Kubečka, J.; Morrissey, E.; Hatley, J.; Winfield, I.;
Mrkvička, T.; Guillard, J. Fish hydroacoustic survey standardization: A step forward based on comparisons
of methods and systems from vertical surveys of a large deep lake. Limnol. Oceanogr. Methods 2007, 15,
836–846. [CrossRef]
13. Edgerton, J.P.; Johnson, A.F.; Turner, J.; LeVay, L.; Mascareñas-Osorio, I.; Aburto-Oropeza, O. Hydroacoustics
as a tool to examine the effects of Marine Protected Areas and habitat type on marine fish communities.
Sci. Rep. 2018, 8, 47. [CrossRef] [PubMed]
14. Water Quality—Guidance on the Estimation of Fish Abundance with Mobile Hydroacoustic Methods; CEN. 2014.
CEN/TC 230 EN 15910:2014; Comité Européen de Normalisation (European Committee for Standardization):
Brussels, Belgium, 2014; 42p.
15. Pollom, R.A.; Rose, G.A. A global review of the spatial, taxonomic, and temporal scope of freshwater fisheries
hydroacoustics research. Environ. Rev. 2016, 24, 333–347. [CrossRef]
16. Darwall, W.; Carrizo, S.; Numa, C.; Barrios, V.; Freyhof, J.; Smith, K. Freshwater Key Biodiversity Areas in the
Mediterranean Basin Hotspot: Informing Species Conservation and Development Planning in Freshwater Ecosystems;
IUCN: Cambridge, UK, 2014.
17. Encina, L.; Rodriguez-Ruiz, A.; Granado-Lorencio, C. Distribution of common carp in a Spanish reservoir in
relation to thermal loading from a nuclear power plant. J. Therm. Biol. 2008, 33, 444–450. [CrossRef]
18. Georgakarakos, S.; Kitsiou, D. Mapping abundance distribution of small pelagic species applying
hydroacoustics and Co-Kriging techniques. In Essential Fish Habitat Mapping in the Mediterranean; Springer:
Dordrecht, The Netherlands, 2018.
19. Tsagkarakis, K.; Giannoulaki, M.; Pyrounaki, M.M.; Machias, A. Species identification of small pelagic fish
schools by means of hydroacoustics in the Eastern Mediterranean Sea. Mediterr. Mar. Sci. 2015, 16, 151–161.
[CrossRef]
20. Bobori, D.C.; Economidis, P.S. Freshwater fishes of Greece: Their biodiversity, fisheries and habitats.
Aquat. Ecosyst. Health Manag. 2006, 9, 407–418. [CrossRef]
21. Economou, A.N.; Giakoumi, S.; Vardaka, L.; Barbieri, R.; Stoumboudi, M.T.; Zogaris, S. The freshwater
ichthyofauna of Greece-an update based on a hydrographic basin survey. Mediterr. Mar. Sci. 2007, 8, 91–166.
[CrossRef]
22. Economidis, P.S. Check List of Freshwater Fishes of Greece: Recent Status of Threats and Protection; Hellenic Society
for the Protection of Nature: Athens, Greece, 1991.
23. Golani, D.; Shefler, D.; Gelman, A. Aspects of growth and feeding habits of the adult European eel
(Anguilla anguilla) in Lake Kinneret (Lake Tiberias), Israel. Aquaculture 1988, 74, 349–354. [CrossRef]
24. Iliadou, K.; Ondrias, I. Biology and morphology of Parasilurus aristotelis (Agassiz, 1856) (Pisces Cypriniformes,
Siluridae) in lakes Lysimachia and Trichonis of western Greece. Biol. GalloHellenica 1986, 11, 207–238.
(In Greek)
25. Daoulas, C.; Kattoulas, M. Reproductive biology of Rutilus rubilio (Bonaparte, 1837) in Lake Trichonis.
Hydrobiology 1985, 124, 49–55. [CrossRef]
26. Daoulas, C.; Economou, A.N.; Psarras, T.; Barbieri-Tseliki, R. Reproductive strategies and early development
of three freshwater gobies. J. Fish Biol. 1993, 42, 749–776. [CrossRef]Water 2020, 12, 1823 18 of 19
27. Leonardos, I.D. Life history traits of Scardinius acarnanicus (Economidis, 1991) (Pisces: Cyprinidae) in two
Greek lakes (Lysimachia and Trichonis). J. Appl. Ichthyol. 2004, 20, 258–264. [CrossRef]
28. Leonardos, I.D.; Kagalou, I.; Triantafyllidis, A.; Sinis, A. Life history traits of ylikiensis roach (Rutilus ylikiensis)
in two Greek lakes of different trophic state. J. Freshw. Ecol. 2005, 20, 715–722. [CrossRef]
29. Leonardos, I.D. Ecology and exploitation pattern of a landlocked population of sand smelt, Atherina boyeri
(Risso 1810), in Trichonis Lake (western Greece). J. Appl. Ichthyol. 2001, 17, 262–266. [CrossRef]
30. Economou, A.N.; Daoulas, C.H.; Psarras, T.; Barbieri-Tseliki, R. Freshwater larval fish from lake Trichonis
(Greece). J. Fish Biol. 1994, 45, 17–35. [CrossRef]
31. Froese, R.; Pauly, D. Fishbase. Available online: www.fishbase.in (accessed on 1 April 2020).
32. Leonardos, I.; Kokkinidou, A.; Agiannitopoulos, A.; Giris, S. Population structure and reproductive strategy
of an endemic species Scardinius acarnanicus (Stephanidis, 1939) in two W. Greece Lakes (Lysimachia and
Trichonis). In Proceedings of the Ninth Ichthyological Congress, Messolonghi, Greece, 20–23 January 2000;
pp. 137–140, (In Greek with English Abstract).
33. Kehayias, G.; Doulka, E. Trophic state evaluation of a large Mediterranean lake utilizing abiotic and biotic
elements. J. Environ. Prot. 2014, 5, 17–28. [CrossRef]
34. Luther, H.; Rzoska, J. Project Aqua: (A Source Book of Inland Waters Proposed for Conservation); Blackwell
Scientific Publications: Oxford & Edinburgh, UK, 1972.
35. Mouratidis, A.; Ampatzidis, D. European Digital Elevation Model Validation against Extensive Global
Navigation Satellite Systems Data and Comparison with SRTM DEM and ASTER GDEM in Central Macedonia
(Greece). ISPRS Int. J. Geo-Inf. 2019, 8, 108. [CrossRef]
36. Mouratidis, A.; Karadimou, G.; Ampatzidis, D. Extraction and Validation of Geomorphological Features
from EU-DEM in the Vicinity of the Mygdonia Basin, Northern Greece. Proc. IOP Conf. Ser. Earth Environ.
Sci. 2017, 95, 032009. [CrossRef]
37. Draštík, V.; Kubečka, J.; Čech, M.; Frouzova, J.; Říha, M.; Juza, T.; Tušer, M.; Jarolím, O.; Prchalová, M.;
Peterka, J.; et al. Hydroacoustic estimates of fish stocks in temperate reservoirs: Day or night surveys?
Aquat. Living Resour. 2009, 22, 69–77.
38. Aglen, A. Random errors of acoustic fish abundance estimates in relation to the survey grid density applied.
FAO Fish. Rep. 1983, 300, 293–298.
39. Guillard, J.; Vergès, C. The repeatability of fish biomass and size distribution estimates obtained by
hydroacoustic surveys using various sampling strategies and statistical analyses. Int. Rev. Hydrobiol. 2007,
92, 605–617. [CrossRef]
40. Demer, D.A.; Berger, L.; Bernasconi, M.; Bethke, E.; Boswell, K.; Chu, D.; Domokos, R.; Dunford, A.; Fassler, S.;
Gauthier, S.; et al. Calibration of Acoustic Instruments; ICES Cooperative Research Report, No. 326; ICES:
Copenhagen, Denmark, 2015; p. 133.
41. Balk, H.; Lindem, T. Sonar4, Sonar5, Sonar6 Post Processing Systems, Operator Manual Version (5.9.6); SIMRAD:
Oslo, Norway, 2006.
42. Love, R.H. Dorsal-aspect target strength of an individual fish. J. Acoust. Soc. Am. 1971, 49, 816–823.
[CrossRef]
43. Frouzova, J.; Kubecka, J.; Balk, H.; Frouz, J. Target strength of some European fish species and its dependence
on fish body parameters. Fish. Res. 2005, 75, 86–96. [CrossRef]
44. Frouzova, J.; Kubečka, J.; Matěna, J. Acoustic scattering properties of freshwater invertebrates. In Proceedings
of the Seventh European Conference on Underwater Acoustic (ECUA 2004), Delft University of Technology,
Delft, The Netherlands, 5–8 July 2004; pp. 319–324.
45. Kubečka, J.; Wittingerová, M. Horizontal beaming as a crucial component of acoustic fish stock assessment
in freshwater reservoirs. Fish. Res. 1998, 35, 99–106. [CrossRef]
46. Sawada, K.; Furusawa, M.; Williamson, N.J. Conditions for the precise measurement of fish target strength in
situ. J. Mar. Acoust. Soc. Jpn. 1993, 2, 73–79. [CrossRef]
47. Lee, S.; Wolberg, G.; Shin, S.Y. Scattered data interpolation with multilevel B-splines. IEEE Trans. Vis. Comput.
Graph. 1997, 3, 228–244. [CrossRef]
48. Nürnberg, G.K. Quantified hypoxia and anoxia in lakes and reservoirs. Sci. World J. 2004, 4, 42–54. [CrossRef]
49. Johannesson, K.A.; Mitson, R.B. Fisheries Acoustics. A Practical Manual for Aquatic Biomass Estimation; FAO
Fisheries Technical Paper: Rome, Italy, 1992.Water 2020, 12, 1823 19 of 19
50. Boswell, K.M.; Wilson, M.P.; Wilson, C.A. Hydroacoustics as a tool for assessing fish biomass and size
distribution associated with discrete shallow water estuarine habitats in Louisiana. Estuaries Coasts 2007, 30,
607–617. [CrossRef]
51. Emmrich, M.; Winfield, I.J.; Guillard, J.; Rustadbakken, A.; Verges, C.; Volta, P.; Jeppesen, E.; Lauridsen, T.L.;
Brucet, S.; Holmgren, K.; et al. Strong correspondence between gillnet catch per unit effort and
hydroacoustically derived fish biomass in stratified lakes. Freshw. Biol. 2012, 57, 2436–2448. [CrossRef]
52. Čech, M.; Kubečka, J.; Frouzová, J.; Draštík, V.; Kratochvíl, M.; Matěna, J.; Hejzlar, J. Distribution of the
bathypelagic perch fry layer along the longitudinal profile of two large canyon-shaped reservoirs. J. Fish Biol.
2007, 70, 141–154.
53. Neilson, J.D.; Perry, R.I. Diel vertical migrations of marine fishes: An obligate or facultative process? Adv. Mar.
Biol. 1990, 26, 115–168.
54. Helfman, G.S.; Winkelman, D.L. Threat sensitivity in bicolor damselfish: Effects of sociality and body size.
Ethology 1997, 103, 369–383. [CrossRef]
55. Appenzeller, A.R.; Leggett, W.C. Bias in hydroacoustic estimates of fish abundance due to acoustic shadowing:
Evidence from day–night surveys of vertically migrating fish. Can. J. Fish. Aquat. Sci. 1992, 49, 2179–2189.
[CrossRef]
56. Parker-Stetter, S.L. Standard Operating Procedures for Fisheries Acoustic Surveys in the Great Lakes; Great Lakes
Fisheries Commission Special Publication, 09–01: Ann Arbor, MI, USA, 2009.
57. Kagalou, I.; Economidis, G.; Leonardos, I.; Papaloukas, C. Assessment of a Mediterranean shallow lentic
ecosystem (Lake Pamvotis, Greece) using benthic community diversity: Response to environmental
parameters. Limnologica 2006, 36, 269–278. [CrossRef]
58. Wheeland, L.J.; Rose, G.A. Quantifying fish avoidance of small acoustic survey vessels in boreal lakes and
reservoirs. Ecol. Freshw. Fish 2015, 24, 67–76. [CrossRef]
59. Doulka, E.; Kehayias, G. Seasonal vertical distribution and diel migration of zooplankton in a temperate
stratified lake. Biologia 2011, 66, 308–319. [CrossRef]
60. Godlewska, M.; Świerzowski, A. Hydroacoustical parameters of fish in reservoirs with contrasting levels of
eutrophication. Aquat. Living Resour. 2003, 16, 167–173. [CrossRef]
61. Breitburg, D.L.; Rose, K.A.; Cowan, J.H., Jr. Linking water quality to larval survival: Predation mortality of
fish larvae in an oxygen-stratified water column. Mar. Ecol. Prog. Ser. 1999, 178, 39–54. [CrossRef]
© 2020 by the authors. Licensee MDPI, Basel, Switzerland. This article is an open access
article distributed under the terms and conditions of the Creative Commons Attribution
(CC BY) license (http://creativecommons.org/licenses/by/4.0/).You can also read