ASSESSING THE RISK OF COVID-19 IN FEED THE FUTURE COUNTRIES
←
→
Page content transcription
If your browser does not render page correctly, please read the page content below
Gender, Climate Change, and Nutrition Integration Initiative (GCAN)              GCAN Policy Note 13 • February 2021

                       ASSESSING THE RISK OF COVID-19
                       IN FEED THE FUTURE COUNTRIES
                          Jawoo Koo, Carlo Azzarri, Aniruddha Ghosh, and Wahid Quabili

In anticipation of the development of a safe and effective     Overall Country-Level Risk
COVID-19 vaccine—the distribution of which will be a           Four of the 12 target Feed the Future countries face
complex and sensitive issue—governments will need to           the highest levels of Covid-19 risk: Nepal, Bangladesh,
assess the number and location of the most vulnerable          Honduras, and Guatemala (Table 1). These countries
people within their populations. Problematically, however,     ranked high in both age- and obesity-related risk. Ghana
tracking data for most low- and middle-income countries        recorded the highest risk among the SSA countries,
are only available at the national level. The most widely      followed by Senegal, Kenya, and Niger. The remaining four
used dataset by the Johns Hopkins University Center for
Systems Science and Engineering (Dong, Du, and Gardner          METHODOLOGY
2020), for example, does not include subnational data for
                                                                The study involved analyzing high-resolution geospatial
Feed the Future’s 12 target countries in Africa south of the    data for each risk indicator at the second-level subnational
Sahara (SSA) and South Asia: Bangladesh, Ethiopia, Ghana,       administrative unit for each country. The risk factors
Guatemala, Honduras, Kenya, Nepal, Niger, Nigeria,              included were (1) age, with the greatest risk occurring
Mali, Senegal, and Uganda. For this reason, the Gender,         among those 85 years or older; (2) sex, with evidence
Climate Change, and Nutrition Integration Initiative            suggesting that men are at higher risk based on greater
(GCAN) was commissioned to correlate Demographic                prevalence of certain enzymes and hormones, combined
                                                                with higher incidence of smoking and alcohol use (Bwire
and Health Survey data from the United States Agency for        2020); and (3) obesity, which is associated with an impaired
International Development (USAID) with geospatial data in       immune system and is known to increase the risk of severe
order to develop a subnational dataset of key COVID-19          illness from COVID-19 (for example, Sattar, McInnes, and
risk indicators based on which potential risk hotspots were     McMurray 2020). Data on other co-morbidity factors (past
identified. This policy note summarizes the study’s analysis    respiratory illness and cardiovascular disease) were not
in the 12 Feed the Future countries and across subnational      available at the subnational level and hence could not be
                                                                included. A composite index that includes all risk factors
administrative units within each country.                       for the second-level subnational administrative units was
                                                                constructed using exploratory factor analysis (a statistical
  Based on patient data compiled and analyzed worldwide,        technique that reduces the number of variables). The
  the science community’s consensus is that key                 resulting values were categorized as low, medium, or high
  COVID-19 risk factors include age, sex, obesity, past         risk leading to (1) an overall risk index for the districts
  respiratory illness, and cardiovascular disease. Hence,       in the Feed the Future countries used for cross-country
  being old, male, and obese increases both vulnerability       comparisons, and (2) a country-specific risk index for the
  to infection and the likelihood of negative outcomes.         purpose of ranking districts within each country.

                                                   www.feedthefuture.gov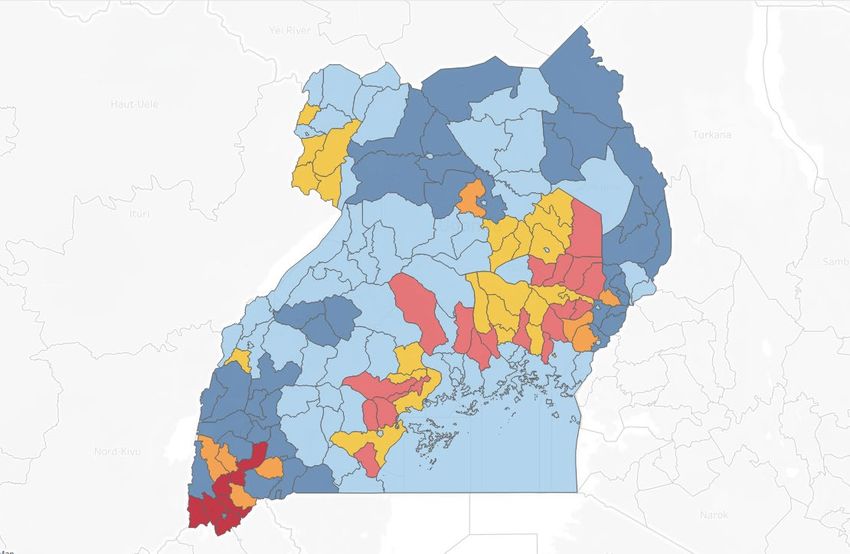
2 | GCAN Policy Note 13
TABLE 1. Country-level ranking of risk values. Variation in subnational risk factors
is most pronounced in SSA—and especially
Age-related Sex-related Obesity-related Overall
Country
risk risk risk risk index in Kenya, Ethiopia, and Uganda—indicating
that location-specific interventions will
Nepal 1.22 0.92 1.01 2.45 likely be needed, even though the overall
Bangladesh 1.26 0.98 1.00 1.83 risk in these countries appears to be
Honduras 1.02 0.93 1.04 1.32
comparatively low.
Guatemala 1.05 1.01 Almost all (99 percent) of the adult
1.04 0.98
population of Honduras is located in areas
Ghana 0.86 1.04 1.02 0.69
classified as being under medium to high
Senegal 0.76 0.96 1.01 0.43 risk (Figure 1). Significant shares of the
Kenya 0.77 1.03 1.02 0.34 populations of Nepal, Bangladesh, and
Guatemala are also located in medium
Niger 0.71 0.96 1.01 0.05 to high risk areas. These countries show
Mali 0.65 0.91 1.01 –0.03 relatively high values of age-related risk.
Nigeria 0.78 1.02 1.02 –0.04
Within SSA, Ghana and Kenya report
relatively high shares of their populations
Ethiopia 0.73 1.00 1.00 –0.04 at risk, followed by Senegal and Ethiopia.
Uganda 0.67 1.03 1.01 –0.34 Conversely, Uganda and Mali showed
the lowest shares of adult populations at
Source: Authors.
risk. And while large shares of the urban
Note: Values indicate each country’s level of medium to high risk based on subnational
analysis at the 70th percentile.
populations in some countries (such as
Honduras and Nepal) are under medium
to high risk, rural populations in several
SSA countries (Mali, Nigeria, Ethiopia, and Uganda) countries (Bangladesh, Ghana, Kenya, Senegal, and Ethiopia)
all recorded comparatively lower overall risk. show comparatively higher risk than urban populations
(Figure 2). Among all Feed the Future target countries,
Most of the subnational administrative units in the four the highest values of age-related and obesity-related risk
top-ranked countries (Nepal, Bangladesh, Honduras, and are reported in rural Bangladesh and rural Honduras,
Guatemala) recorded relatively high COVID-19 risk index respectively.
FIGURE 1. Share of the adult population
FIGURE 2. Urban versus rural share of the adult population at risk (%)
at risk (%)
Urban Rural
Honduras 1 26 73 Honduras 39 61 1 23 76
Nepal 12 18 70 Nepal 100 15 24 61
Bangladesh 29 24 47 Bangladesh 31 25 44 11 14 75
Guatemala 33 47 20 Guatemala 15 72 13 40 38 22
Ghana 74 9 17 Ghana 90 8 2 66 10 24
Kenya 80 6 14 Kenya 93 26 76 8 16
Senegal 78 31 9 Senegal 100 71 18 12
Ethiopia 79 13 8 Ethiopia 100 78 13 9
Niger 95 23 Niger 100 95 23
Nigeria 93 5 2 Nigeria 95 5 92 5 3
Uganda 98 2 Uganda 100 98 2
Mali 100 Mali 100 100
0% 20% 40% 60% 80% 100% 0% 20% 40% 60% 80% 100% 0% 20% 40% 60% 80% 100%
Share of adult population (%) Share of adult population (%) Share of adult population (%)
Low Medium High Low Medium High
Source: Authors.
Notes: Classes of risk are based on the overall risk index. Adult population includes individuals over 18 years old.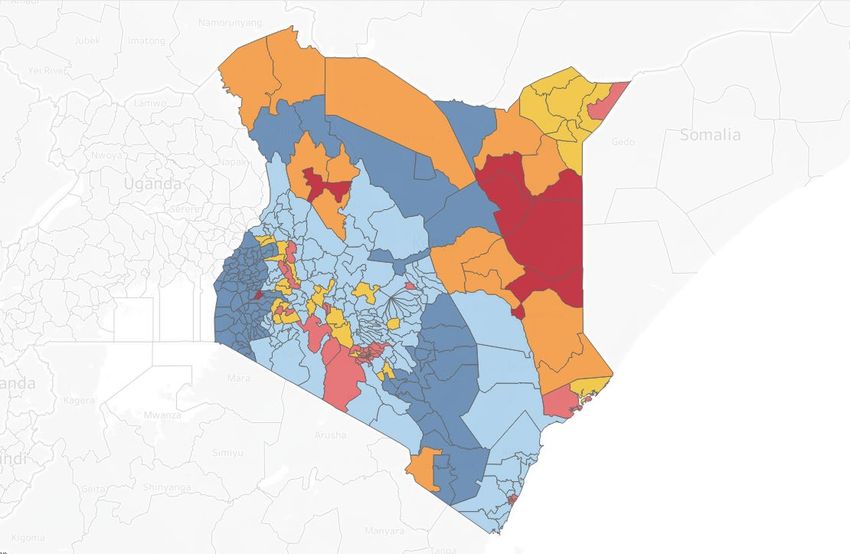
February 2017 | 3
May 2021
Subnational Risk Hotspots indicating hotspots (the redder colors) and cold spots (the
bluer colors) in each country. ZOI indicates the zone of
The country-specific subnational risk index—categorizing influence of the U.S. Government’s Feed the Future
low, medium, or high risk—is visually presented in Figure 3, program.
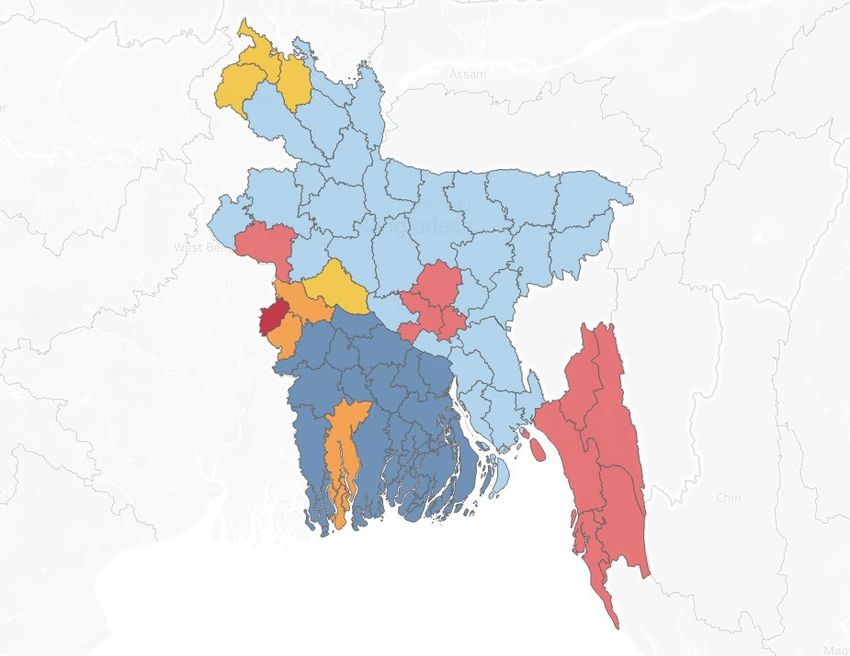
FIGURE 3. Subnational hotspots
a. Bangladesh b. Ethiopia
Areas of high risk are Bandarban, Chittagong, Cox’s Bazar, Dhaka, Gazipur, Khagrachhari, Areas of high risk are the Afar Zone 1/2/3/4/5, Afder, Agnuak, the Bahir Dar Special
Meherpur, Narayanganj, Rajshahi, and Rangamati. The total population in the high risk Zone, Doolo, Fafan, Jarar, Kemashi, Korahe, Majang, Nogob, and Shabelle. The total
areas is about 27.6 million. population in the high risk areas is about 3.5 million
c. Ghana d. Guatemala
Areas of high risk are Accra, Ahafo Ano South, Ahanta West, Aowin-Suaman, Asunafo Areas of high risk are Chahal, Chisec, Cobán, Dolores, Escuintla, Flores, Fray Bartolomé
North, Asunafo South, Asutifi, Atebubu-Amantin, Bia, Bibiani Anhwiaso Bekwai, Dangbe de las Casas, Guanagazapa, Iztapa, La Democracia, La Gomera, La Libertad, Lanquín, Los
East, Dangbe West, Ga East, Ga West, Jomoro, Juabeso, Kintampo North, Kintampo Amates, Masagua, Melchor de Mencos, Nueva Concepción, Palín, Panajachel, Panzós,
South, Mpohor Wassa East, Nkoranza, Nzema East, Pru, Sefwi Wiawso, Sekyere East, Pastores, Poptún, Puerto Barrios, San Andrés, San Benito, San Cristóbal Verapaz, San
Sene, Shama Ahanta East, Sunyani, Tain, Techiman, Tema, Wasa Amenfi East, Wasa Amenfi Francisco, San José, San José Pinula, San Juan Chamelco, San Luis, San Pedro Carchá, San
West, and Wassa West. The total population in the high risk areas is about 6.5 million. Vicente Pacaya, Santa Ana, Santa Cruz Verapaz, Santa Lucía Cotzumalguapa, Santa María
Cahabón, Sayaxché, Senahú, Siquinalá, Tactic, Tamahú, Tiquisate, Tucurú, and Villa Canales.
The total population in the high risk areas is about 2 million.
ZOI, High risk ZOI, Medium risk ZOI, Low risk Non-ZOI, High risk Non-ZOI, Medium risk Non-ZOI, Low risk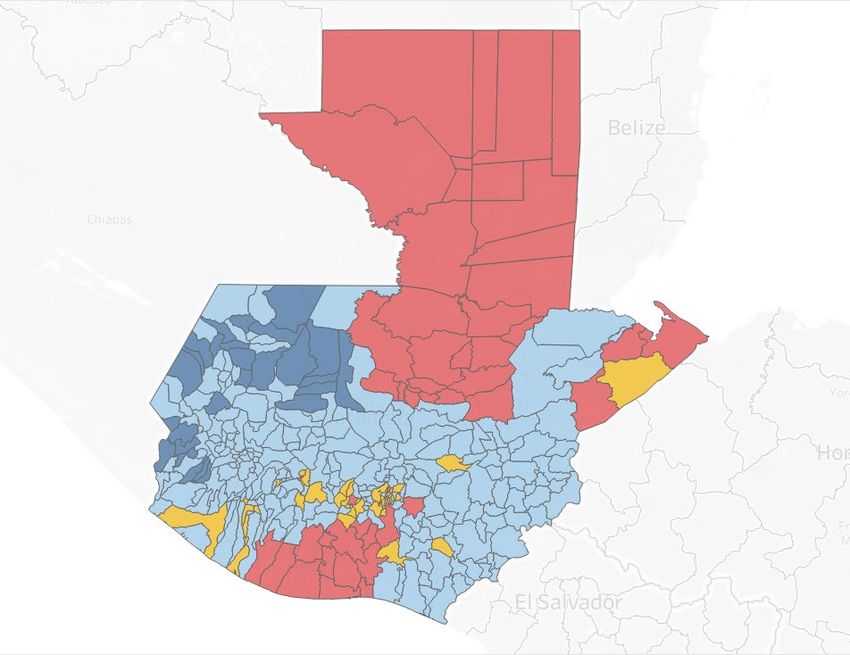
4 | GCAN Policy Note 13
FIGURE 3. Subnational hotspots (continued)
e. Honduras f. Kenya
Areas of high risk are Apacilagua, Arada, Atima, Azacualpa, Belen, Caridad, Ceguaca, Areas of high risk are Belgut, Changamwe, Daadab, Dagoretti North, Dagoretti South,
Chinda, Cololaca, Concepción de Maria, Concepción del Norte, Concepción del Sur, Eldas, Embakasi Central, Embakasi East, Embakasi North, Embakasi South, Embakasi
Duyure, El Corpus, El Nispero, Gualala, Gualcince, Guarita, Ilama, Jacaleapa, La Campa, West, Garissa Township, Jomvu, Juja, Kajiado North, Kajiado West, Kamukunji, Kapseret,
Las Vegas, Lepaera, Liure, Macuelizo, Namasigue, Naranjito, Nueva Frontera, Nuevo Kasarani, Kesses, Kiambaa, Kiambu, Kibra, Kisauni, Kisumu Central, Kisumu East,
Celilac, Orocuina, Petoa, Piraera, Potrerillos, Protección, Quimistán, San Andrés, San Lamu West, Langata, Likoni, Limuru, Makadara, Mandera East, Mathare, Moiben, Mvita,
Antonio de Flores, San Francisco de Ojuera, San Isidro, San José de Colinas, San Luis, Nakuru Town East, Nakuru Town West, Narok East, Narok North, North Imenti, Nyali,
San Marcos, San Marcos de Caiquín, San Nicolás, San Pedro Zacapa, San Sebastian, Roysambu, Ruaraka, Ruiru, Starehe, Thika Town, Wajir East, Wajir South, Wajir West, and
San Vicente Centenario, Santa Ana de Yusguare, Santa Bárbara, Santa Rita, Soledad, Westlands. The total population in the high risk areas is about 7 million.
Teupasenti, Texiguat and, Trinidad de Copán. The total population in the high risk areas is
about 0.5 million.
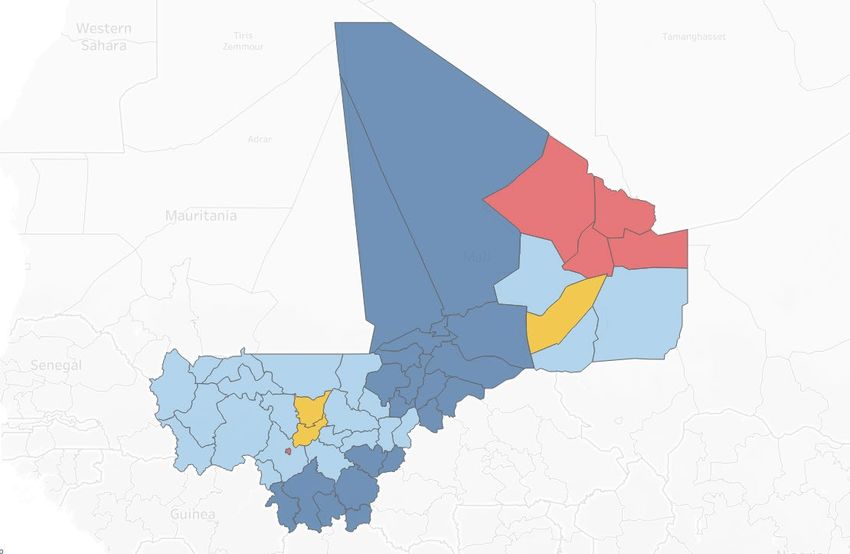
g. Mali h. Nepal
Areas of high risk are Abeïbara, Bamako, Kidal, Tessalit, and Tin-Essako. The total Areas of high risk are Bagmati, Dhaualagiri, Gandaki, and Mechi. The total population in
population in the high risk areas is about 1.7 million. the high risk areas is 7.8 million.
ZOI, High risk ZOI, Medium risk ZOI, Low risk Non-ZOI, High risk Non-ZOI, Medium risk Non-ZOI, Low risk
Comparison of Overall Risk Index with Actual Country Status (As of January 2021)
The data underlying this study were sourced from existing literature and databases; unfolding trends of confirmed cases and
deaths were not included. Nevertheless, as of early January 2021, the ranking of the four countries reporting the most severe
spread of infection matched the study’s estimated national ranking based on the COVID-19 risk index, with the ranking of the
remaining eight countries following a similar overall pattern. Correlating this study’s risk index with the number of confirmed
COVID-19 cases per million people, the linear trend shows a statistically significant correlation (R2=0.54; p=0.006).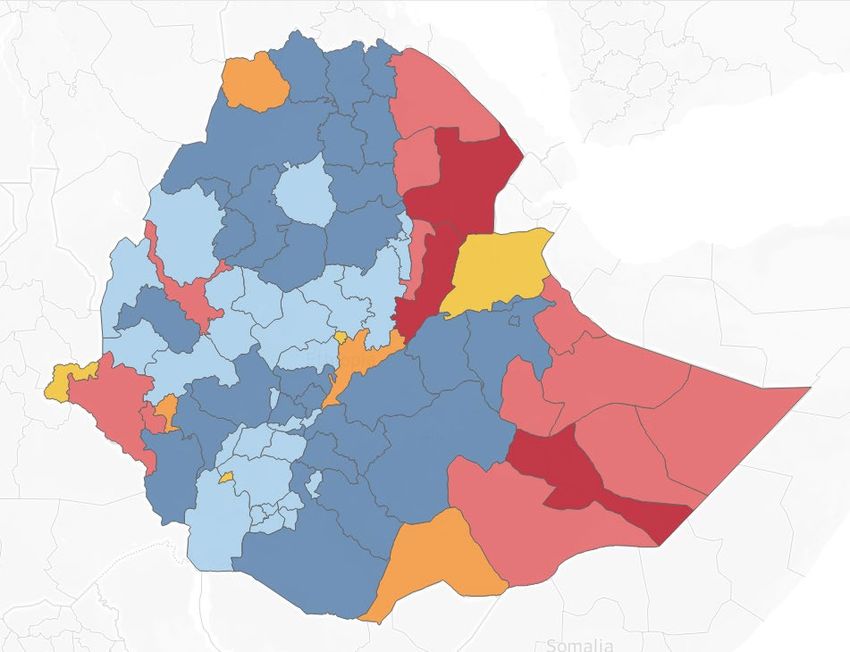
February 2021 | 5
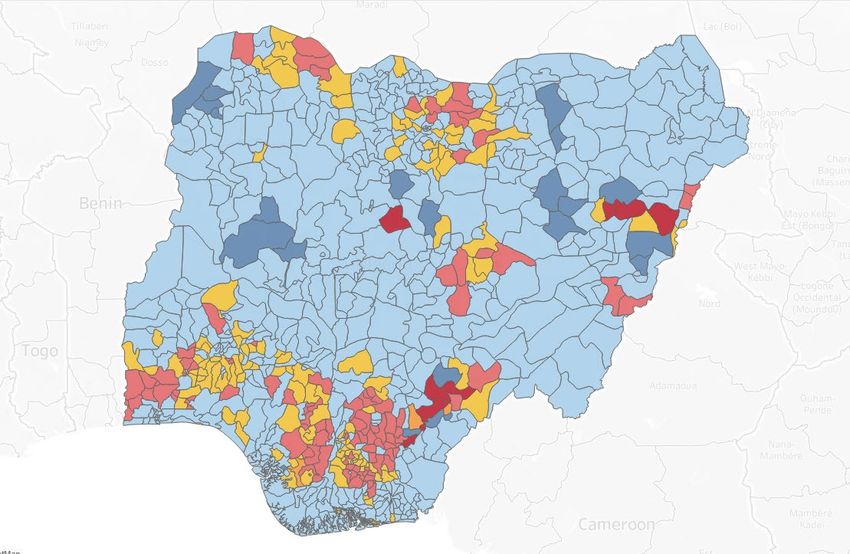
FIGURE 3. Subnational hotspots (continued)
i. Niger j. Nigeria
Areas of high risk are Arlit, Bilma, Diffa, N’Guigmi, Niamey, and Tchighozerine. The total Areas of high risk are Abeokuta South/North, Aboh-Mba, Afijio, Afikpo, AfikpoSo,
population in the high risk areas is about 1.1 million. Akinyele, Aninri, AniochaN, AniochaS, Asa, Awgu, Bende, Bogoro, Bokkos, Dambatta,
EgbadoNorth, EgbadoSouth, EsanCent, EsanNort, EtsakoEa, Ewekoro, Ezeagu, Ezinihit,
Ezza North, Ezza South, Garki, Hawul, Hong, IbadanSouth-East, IbadanSouth-West, Igbo-
eze North, Igbo-eze South, Igueben, Ijebu North-East, IjebuOde, Ikeduru, Ikenne, Ikwo,
Ilejemeje, Ilesha East, Ilesha West, Ipokia, Isa, Ishielu, Isi-Uzo, Isiala Ngwa North, Isiala
Ngwa South, IsokoNor, Isuikwua, Jada, Kajuru, Kanam, Katsina (Benue), Kiyawa, Konshish,
Kunchi, Kwaya Kusar, Lagelu, Madagali, Mangu, Mayo-Bel, Mbaitoli, Michika, Minjibir,
Ndokwa East, Ndokwa West, Ngor-Okp, Njikoka, Nkanu East, Nkanu West, Nsukka,
Obafemi-Owode, Oboma Ngwa, Obowo, Odeda, Ohafia Abia, Ohaozara, Ohaukwu,
Oji-River, Ondo West, Onicha, Orhionmw, Orlu, Oru East, OrumbaNo, Oshimili North,
OwanWest, Owerri North, Owerri West, Owo, Oyo East, Qua’anpa, Remo-North,
Ringim, Sabon Birni, Shinkafi, Sule-Tan, Takai, Tangazar, Taura, Udenu, Udi, Ukwuani,
Umu-Nneochi, Umuahia South, Ushongo, Uzo-Uwani, Vandeiky, and Yala Cross. The total
population in the high risk areas is about 13.2 million.
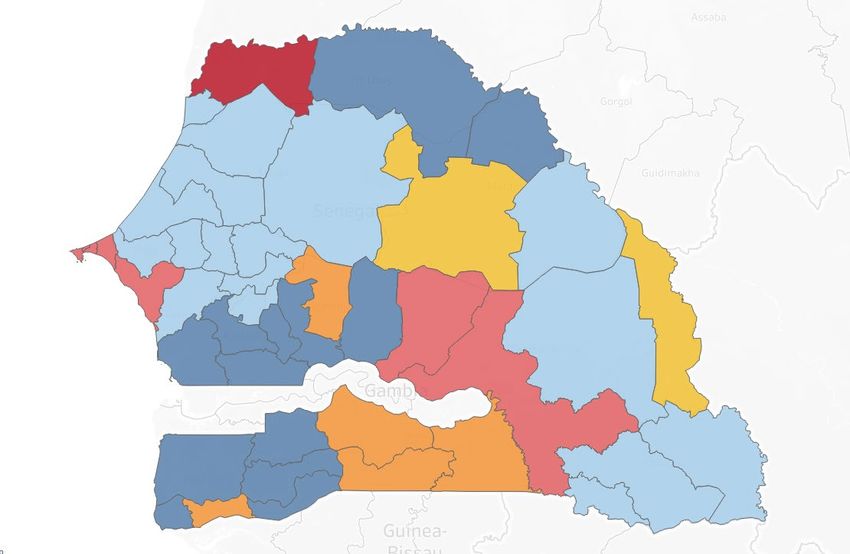
k. Senegal l. Uganda
Areas of high risk are Dagana, Dakar, Guédiawaye, Koupentoum, Mbour, Pikine, Rufisque, Areas of high risk are Bamunanika, Budaka, Bugweri, Bukedea, Bukomansimbi, Busiki,
and Tambacounda. The total population in the high risk areas is about 2.7 million. Butambala, Gomba, Kajara, Kalungu, Kibuku, Kisoro, Kumi, Kyotera, Luuka, Nakaseke,
Nakifuma, Ndorwa, Ngora, Ntenjeru, Rubabo, Rubanda, Rukiga, Serere, Sheema, and
Usuk. The total population in the high risk areas is about 2.2 million.
ZOI, High risk ZOI, Medium risk ZOI, Low risk Non-ZOI, High risk Non-ZOI, Medium risk Non-ZOI, Low risk
Source: Authors.
Note: Classes of risk are based on the overall risk index. All maps © Mapbox © Open Street Map.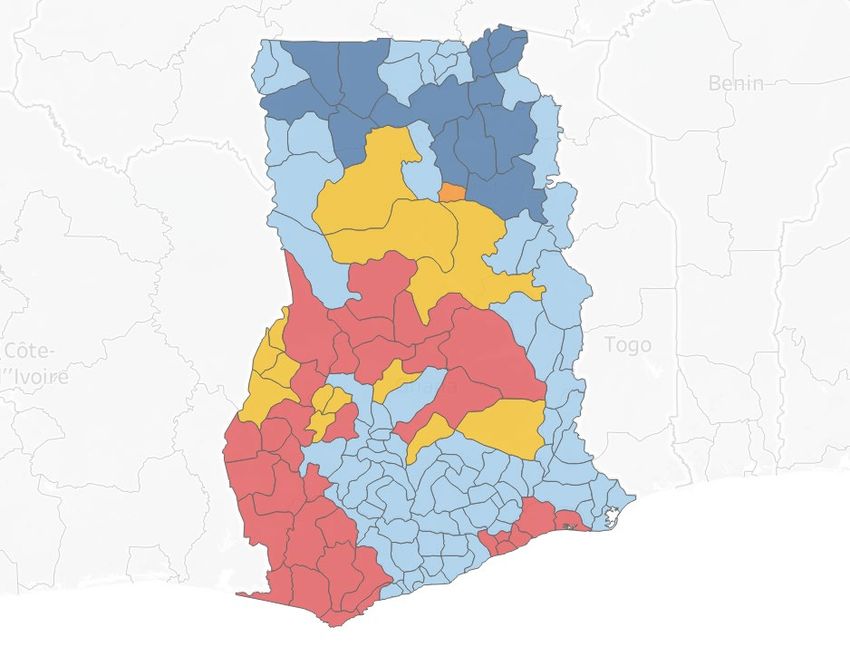
6 | GCAN Policy Note 13

Specific Implications for Rural Areas                                           References
Given the relatively high estimated COVID-19 risk in rural                      Bwire, G. 2020. “Coronavirus: Why Men Are More Vulnerable
areas in most of the countries analyzed, supporting interven-                       to Covid-19 Than Women.” SN Comprehensive Clinical
tions targeting agricultural laborers should be encouraged.                         Medicine: 1–3. https://doi.org/10.1007/s42399-020-00341-w.
Recently published studies also underscore that, across low-                    CDC (Centers for Disease Control and Prevention). 2020.
and middle-income countries, rural areas still show lower                         “Agriculture Workers and Employers: Interim Guidance
accessibility to safe water for personal hygiene (Deshpande                       from CDC and the U.S. Department of Labor.” www.cdc.
et al. 2020) and to healthcare facilities (Weiss et al. 2020),                    gov/coronavirus/2019-ncov/community/guidance-agricultural-
with low rates of improvement. Another notable vulner-                            workers.html (accessed November 11, 2020).
ability in rural areas relates to household composition. In
analyzing nationally representative household survey data                       Deshpande, A., M. Miller-Petrie, P. Lindstedt, M. Baumann, K.
                                                                                   Johnson, B. Blacker, H. Abbastabar, et al. 2020. “Mapping
from nine Feed the Future target countries, Nico and
                                                                                   Geographical Inequalities in Access to Drinking Water
Azzarri (2020) found that, on average, rural households have
                                                                                   and Sanitation Facilities in Low-Income and Middle-Income
25 percent more elder members (those older than 65 years)                          Countries, 2000–17.” The Lancet Global Health 8 (9): e1162–
than urban areas. While shares are higher in nonagricultural                       e1185. https://doi.org/10.1016/S2214-109X(20)30278-3.
households (73 percent on average, with peaks in Uganda
and Kenya), the higher shares of elder members across                           Dong, E., H. Du, and L. Gardner. 2020. “An Interactive
larger, rural households may render rural areas particularly                       Web-Based Dashboard to Track COVID-19 in Real Time.”
vulnerable to the spread of COVID-19.                                              The Lancet Infectious Diseases 20 (5): 533–534. https://doi.
                                                                                   org/10.1016/S1473-3099(20)30120-1.
In order to reduce the risk of COVID-19 transmission
                                                                                Morgan, D., J. Inoi, G. Di Paolantonioi, and F. Murtini. 2020.
across the agricultural sector, the U.S. Centers for Disease
                                                                                   Excess Mortality: Measuring the Direct and Indirect Impact of
Control and Prevention has provided guidelines for grouping
                                                                                   COVID-19. OECD Health Working Papers 122. Paris: OECD
agricultural workers into cohorts for shifts or tasks, while                       Publishing. https://doi.org/10.1787/c5dc0c50-en.
keeping a minimum precautionary distance among individuals
(CDC 2020). In India, local governments are disseminating                       Nico, G., and C. Azzarri. 2020. “Reassessing Global Estimates
guidelines for socially distanced farming practices, as well as                     of Employment and Dependence on Agriculture.” Paper
encouraging younger, less vulnerable farmers to participate                         prepared for the 2021 Agricultural and Applied Economics
in labor-intensive field activities in which distancing might                       Association Conference. Food and Agriculture Organization
be more challenging, such as planting and harvesting. Other                         of the United Nations, Rome, and International Food Policy
                                                                                    Research Institute, Washington, DC.
potential mitigating interventions promoted in India include
collecting harvested grain at the farm gate, to minimize                        Sattar, N., I. McInnes, and J. McMurray. 2020. “Obesity Is a
the need for farmers to travel to markets, and establishing                            Risk Factor for Severe COVID-19 Infection: Multiple
informal social networks to coordinate fieldwork on                                    Potential Mechanisms.” Circulation 142 (1): 4–6. https://doi.
rotating days. Additionally, given the high level of variability                       org/10.1161/CIRCULATIONAHA.120.047659.
in COVID-19 risk factors between urban and rural areas,
                                                                                Weiss, D., A. Nelson, C. Vargas-Ruiz, K. Gligorić, S. Bavadekar,
all countries are urged to monitor the COVID-19 situation
                                                                                     E. Gabrilovich , A. Bertozzi-Villa, et al. 2020. “Global Maps
at the subnational level and make data publicly available
                                                                                     of Travel Time to Healthcare Facilities.” Nature Medicine
for targeted interventions and vaccine distribution. Where                           26: 1835–1838. https://doi.org/10.1038/s41591-020-1059-1.
testing is limited, statistics on excess subnational mortality
can be used as a proxy (Morgan et al. 2020).

Jawoo Koo, Carlo Azzarri, and Wahid Quabili are employed by the International Food Policy Research Institute (IFPRI); Aniruddha Ghosh
is employed by the Alliance of Bioversity International and the International Center for Tropical Agriculture (CIAT). This publication was prepared
under the Gender, Climate Change, and Nutrition Initiative (GCAN). GCAN was made possible with support from Feed the Future through the
U.S. Agency for International Development (USAID) and is associated with the CGIAR Research Program on Climate Change, Agriculture and Food
Security, which is carried out with support from CGIAR Fund Donors and through bilateral funding agreements. The policy note has not been peer
reviewed. Any opinions are those of the authors and do not necessarily reflect the views of IFPRI, USAID, or Feed the Future.

Copyright © 2021 International Food Policy Research Institute. Licensed for use under a Creative Commons Attribution 4.0 International License (CC BY 4.0)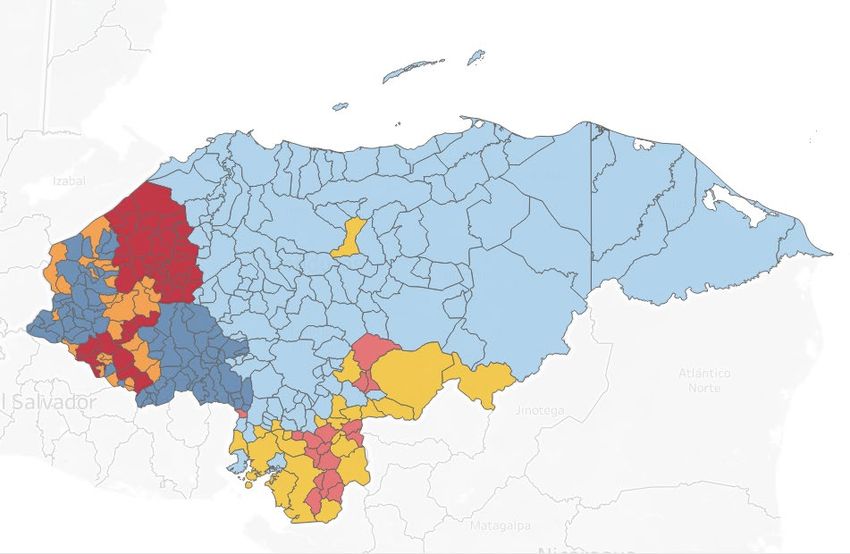
You can also read