Assessment of Angular Spectral Distributions of Laser Accelerated Particles for Simulation of Radiation Dose Map in Target Normal Sheath ...
←
→
Page content transcription
If your browser does not render page correctly, please read the page content below
applied
           sciences
Article
Assessment of Angular Spectral Distributions of
Laser Accelerated Particles for Simulation of
Radiation Dose Map in Target Normal Sheath
Acceleration Regime of High Power Laser-Thin Solid
Target Interaction—Comparison with Experiments
Andreea Groza 1 , Alecsandru Chirosca 2, *, Elena Stancu 3 , Bogdan Butoi 1 , Mihai Serbanescu 4,5 ,
Dragana B. Dreghici 1,2 and Mihai Ganciu 1
 1    Low Temperature Plasma Department, National Institute for Laser, Plasma and Radiation Physics (INFLPR),
      Atomistilor Str. No. 409, 077125 Magurele, Ilfov County, Romania; andreea.groza@inflpr.ro (A.G.);
      ro_medeus@yahoo.com (B.B.); dragana.dreghici@inflpr.ro (D.B.D.); mihai.ganciu@inflpr.ro (M.G.)
 2    Nuclear Physics Department, Faculty of Physics, University of Bucharest, 077125 Magurele, Romania
 3    STARDOOR Department, National Institute for Laser, Plasma and Radiation Physics, Atomistilor Str.
      No. 409, 077125 Magurele, Romania; elena.stancu@inflpr.ro
 4    Centre for Advanced Laser Technology (CETAL-PW), National Institute for Laser, Plasma and
      Radiation Physics, Atomistilor Str. No. 409, 077125 Magurele, Ilfov County, Romania;
      mihai.serbanescu@inflpr.ro
 5    Faculty of Electronics, Telecommunications and Information Technology, Politehnica University
      of Bucharest (UPB), Splaiul Independentei 313, 060042 Bucharest, Romania
 *    Correspondence: alecsandru.chirosca@ccpr.ro

 Received: 27 April 2020; Accepted: 23 June 2020; Published: 26 June 2020

 Abstract: An adequate simulation model has been used for the calculation of angular and energy
 distributions of electrons, protons, and photons emitted during a high-power laser, 5-µm thick Ag
 target interaction. Their energy spectra and fluencies have been calculated between 0 and 360 degrees
 around the interaction point with a step angle of five degrees. Thus, the contribution of each
 ionizing species to the total fluency value has been established. Considering the geometry of the
 experimental set-up, a map of the radiation dose inside the target vacuum chamber has been simulated,
 using the Geant4 General Particle Source code, and further compared with the experimental one.
 Maximum values of the measured dose of the order of tens of mGy per laser shot have been obtained
 in the direction normal to the target at about 30 cm from the interaction point.

 Keywords:  spectra of laser accelerated particle beams;                    mapping of radiation dose;
 GEANT4 simulations

1. Introduction
     High-intensity lasers have progressively been used in contemporary research for the study of
matter under extreme conditions and to generate beams of accelerated particles [1–6].
     As result of the interaction of high-power laser pulses (I > 1019 W/cm2 , fs to ps pulse duration)
with solid micrometer flat [1,2] or structured thin targets [2,6], by the target normal sheath acceleration
(TNSA) mechanism, electron and proton beams with high directionality, small divergence, and energies
up to tens of MeV [1–6] are generated.
     The TNSA regime involves complex physical phenomena and is usually considered to be the main
rear surface ion acceleration mechanism. When the laser pre-pulse interacts with the target’s front side,

Appl. Sci. 2020, 10, 4390; doi:10.3390/app10124390                               www.mdpi.com/journal/applsci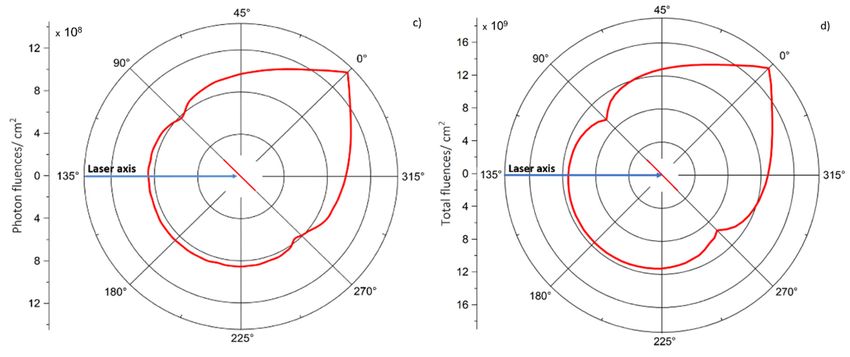
Appl. Sci. 2020, 10, 4390                                                                            2 of 15

it produces a pre-plasma. The subsequent arrival of the main laser pulse leads to the generation of
hot electrons, as the pre-plasma electrons absorb a percentage of laser pulse energy. The mean free
path of such hot electrons in the target is larger than its thickness, and thus part of them pass through
the target and form a dense sheath of negative charge in the proximity of the target rear surface up to
its rear surface, where it generates a dense sheath. The further expansion of the electrons sheath into
the vacuum determine a TV/m electric field, normal to the target surface. The impurities (water and
organic molecules) adsorbed on the rear side of the target can be ionized in this strong electric field.
Thus, the generated protons are accelerated in the normal direction to the target.
      Besides electron and proton beams, bremsstrahlung radiation is also produced due to electron
interaction with target nuclei [2]. At the same time, X-ray bremsstrahlung photons can be provided by
the “hot” electrons and laser accelerated electrons which reach the vacuum chamber walls [7,8].
      The mixed field of photons and electrons might create a hazardous radiation environment, as dose
levels of tens of mGy/per laser shot, depending on the target thickness and material characteristics,
can be obtained [7,8].
      In order to distinguish between different kinds of laser accelerated particle beams, complex
detection systems needed to be envisaged. For such goals, magnetic or Thomson parabola spectrometers
coupled with Lanex foils, image plates, radiochromic films (RCF), microchannel plates, or CR-39
detectors have been used [2,9–11]. These spectrometers, placed at different distances and angles
with respect to the laser–target interaction point, can reveal the energy spectral distribution of the
electron and proton beams. The spectra of photons emitted in TNSA regime can be measured using
X-ray spectrometers and estimated from the energy distribution of electron beams [12]. The charts
of electron-photon distribution in the mixed field of radiation were calculated and experimentally
determined [7,8].
      It was shown [5] that the spectral distribution of laser accelerated particle beams in high power
laser–solid target experiments can reproduce the space radiation environment. The values of radiation
dose per laser shot measured during such experiments, inside the target vacuum chambers [7,8],
are similar to those measured onboard space vessels [13–18]. On the NASA website [13], daily values of
hundreds of µGy were reported for the cumulative radiation dose inside spacecrafts. Similar conditions
can be obtained using laser plasma accelerator facilities available worldwide [19–23].
      Inside the spacecrafts and space stations there are lots of electronic systems that need to be tested
in dedicated facilities on Earth, before being used in extreme conditions. In addition, the assessment
of detectors’ response in ground-based facilities is essential for overcoming the problems intrinsic to
space dosimetry. As shown in Hidding’s et al. paper [5], to test electronics, a proper knowledge of the
fluxes of ionizing radiation is an important issue.
      In this context, the measurement and estimation of the spatial and angular spectral distribution
of the ionizing radiation generated in high power laser-thin solid target experiments can be
extremely useful.
      In this paper, we propose a simulation model to be used for the assessment of the radiation dose
map in a TNSA regime for a high power laser-thin solid target interaction experiment. First, the energy
spectral distribution of electron, proton and photon beams, have been calculated within 0–360◦ for
a 5 µm thick Ag target irradiated with a high-power laser pulse of about 5 × 10¹⁹ W/cm2 intensity.
To this goal, the TNSA plasma expansion model has been considered in conjunction with the Geant4
Monte-Carlo radiation transport code. Then, the angular and energy spectral distributions of ionizing
particles were used as input data for the calculation of electron, proton, and photon fluencies around
the high power laser-thin solid target interaction point.
      The values of input parameters are characteristics to a high power laser-thin solid target experiment
performed at the CETAL laser facility [24].
      In the Groza’s et al. paper [24], we reported a method for the assessment of the energy of the
accelerated proton beams produced in high power laser-thin solid target experiments using a stack
of CR-39 detectors. It was also stated that a compact experimental set-up which connect the target
Appl. Sci. 2020, 10, 4390                                                                                         3 of 15

holder with the detector holder, and the laser spot optical analysis system can be useful for practical
applications. For example, by using such a system, the misalignments between targets and detectors
can be avoided [24].
     In this paper, we introduced an updated version of the above-mentioned experimental set-up
which is also suitable for estimation of laser-accelerated electron beam energies. It includes a magnetic
spectrometer and a cylindrical holder for positioning the EBT3 RCF passive detectors. The calibration
of the RCF was performed for both X-ray photon beams and monoenergetic electrons.
     The radiation dose map measured inside the interaction chamber during the high power laser-Ag
thin target interaction experiments using EBT3 RCF detectors, will be presented. It will be compared
with the simulated one, generated by implementing the data characteristic to angular and energy
spectral distribution of electrons, protons, and photons in the geometry mesh of the experimental
set-up designed using the GEANT4 standard geometry components.

2. Description of the Simulation Models and Experimental Set up

2.1. Description of the Model for Generation of Angular Spectra of Electrons, Protons and Photons; GEANT4
Model for Compute the Dose Map inside the Interaction Chamber
(a)    Description of TNSA Model

     The simulation model is based upon the Geant4 [25] framework. The mathematical models for
sources description and data processing pipelines have been implemented in the Python language [26].
The integration between the sources description and the custom GEANT4 based application developed
in C++, was performed using the Geant4 General Particle source. We used the command line scoring
system for the region of interest and the output data were analyzed using another Python pipeline.
The particle sources were implemented considering the target normal sheath acceleration (TNSA)
mechanism and the plasma expansion model [1].
     In TNSA regime, the interaction of a high power laser beam with a thin target generates on its front
surface energetic electrons, which are accelerated in forward direction through the target. During their
interaction with the target material, these hot electrons can generate bremsstrahlung radiation [7,8].
The electrons, which attain the back of the target and enter in vacuum, create an electrostatic space
charge sheath and thus an electric field with an intensity of about 1012 V/m. Due to this field, the
protons from the rear target surface can be accelerated up to MeV energies [1–6]. The temperature of
hot electrons, is related to the laser intensity, [1]:

                            Thot = [(1 + I [W/cm2 ]λ2 [µm]/(1.37 × 1018 )]1/2 − 1)m0 c2 ,                            (1)

where I represent the laser intensity in beam focus, λ is laser wavelength, m0 electron mass, and c light
velocity [1]. The number of electrons accelerated into the target, Ne , depends on the energy fraction
absorbed by hot electrons f = 1.2 × 10⁻¹⁵ I0.74 (W/cm2 ), through the formula [1,27]:

                                                     Ne = f EL /Thot                                                 (2)

where EL is the laser energy.
      The electron density at the rear side of the target is ne,0 = Ne /(c τL Ssheath ), where Ssheath = π(r0 + d ×
tanθ)2 [1], τL is laser pulse duration, d is the target thickness, r0 is the radius of laser beam in focus and
θ is the half angular broadening of the hot electrons inside the target. Roth calculated this formula as a
function of target thickness and laser intensity [27]:

           ne,0 = [ηEL ]/[cτL π(r0 + (d tanθ/2))2 kB Thot ~ 1.5 × 10¹⁹ [r0 2 /(r0 + (dtanθ/2)2 ][I18 7/4 /[(1 +
                                                                                                                     (3)
                                               0.73I18 λ)1/2 − 1] [cm−3 ]

where I18 is the laser intensity in terms of 1018 W/cm2 [27].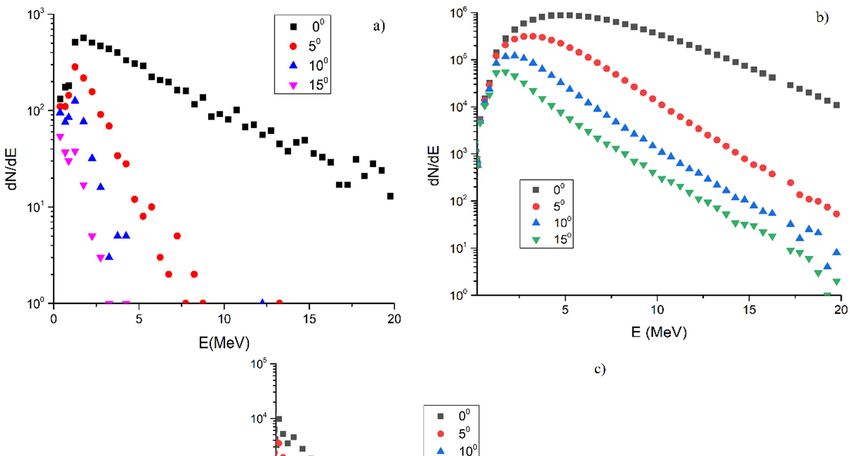
Appl. Sci. 2020, 10, 4390                                                                                         4 of 15

    The energy spectrum of electrons leaving the rear side of the target is given by different formulas,
depending on how large the laser intensity is:

                                                   dN/dE ~ E2 e−E/T hot                                              (4)

(relativistic Maxwelian distribution) for I > 1019 W/cm2 [7,12] and

                                                  dN/dE ~ E1/2 e−E/T hot                                             (5)

(Maxwelian distribution) for I < 1019 W/cm2 [7,12].
    The energy spectrum of accelerated protons within the plasma expansion model is [1]:

              dN/dE = [ne,0 cs tacc Ssheat /(2EThot )1/2 ] exp(−(2E/Thot )1/2 ), where cs = (Zi × Thot /mi )1/2      (6)

where tacc = 1.3 × τL while mi and Zi (Zi = 1) are referred to as protons.
     The energy spectrum of bremsstrahlung photons is derived from the energy spectrum of the
electrons which interact with the Ag target (Z = 49) and was calculated considering the temperature
of hot electrons. The bremsstrahlung radiation is due to energy deposited by the hot electrons while
passing through the target.

(b)    Description of Electron and Proton Sources Used for Calculation of Electron, Proton and Photon
       Spectra and Fluencies, around the High Power Laser—Thin Solid Target Interaction Point

     The simulation model used for calculation of angular distribution of laser driven accelerated
particles was developed considering mainly the above formulas (Equations (1)–(6)). A 2 MeV
temperature for the hot electrons was calculated using Formula (1) and the following experimental
parameters [24]: 5 × 10¹⁹ W/cm2 laser intensity, 40 fs laser pulse duration, 207 µm2 laser spot area.
     Two volume sources of radiation were considered in order to compute the spectra of electrons,
protons and photons emitted in the 0–360◦ range (with a 5-degree angular step) at 3 cm distance,
around the interaction point.
     The first source represents the source of electrons (a disk of 9 µm radius) generated in the
pre-plasma obtained after the interaction of the PW laser with the target surface. It provides the
electrons for the simulation of radiation transport. The electrons were considered to have a Maxwellian
energy distribution in accordance with Equations (4) and (5). This source is position in front of the
target [28–31]. The energy distribution of electrons was calculated, based on mathematical equations
from (1) to (5). The angular distribution of electron source was assumed isotropic. The electrons
generated in the pre-plasma which emit in 4π are the main source for radiation in the vacuum
chamber [7,8].
     The energy distribution of photons has been calculated considering the hot electrons interaction
with the target nuclei.
     The second source (a disk of 9-µm radius) of radiation included in the simulation was placed
behind the target and provides the accelerated protons. There are considered the TNSA mechanism
(Equations (1)–(3) and (6)) and the plasma expansion model [1,28,29]. The divergence of this source is
an independent parameter and is defined through its half angle which was 25◦ in accordance with [1].
     The incidence angle of the laser beam on the target was not considered in these simulations.
Previously, in the paper of Morita’s et al. [32] by Particle in Cell simulations it was shown that an
oblique incidence angle of laser on the target increases the energy of accelerated protons without
changing the distribution of electrons. At laser intensities of ~1019 W/cm2 , the incidence angle of the
laser beam on the target influences only the efficiency of the energy transfer from photons to electrons
into the pre-plasma.
     The characteristics of source terms are summarized in Table 1.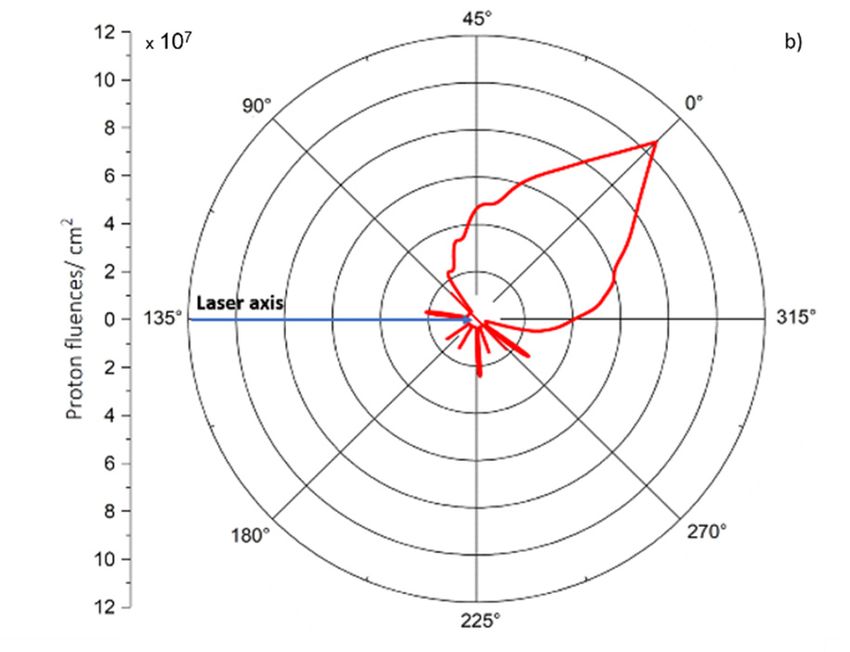
Appl. Sci. 2020, 10, 4390                                                                              5 of 15

                                      Table 1. Characteristics of source terms.

                  Source of Radiation              Electrons (Source 1)           Protons (Source 2)
                Laser intensity (W/cm2 )                 5×   1019                     5 × 10¹⁹
                Laser pulse duration (fs)                    40                            40
                 Laser spot area (µm2 )                     207                           207
                  Source radius (µm)                          9                            9
                    Source position                        ahead                        behind
                 Angular distribution                       4π                      25◦ half angle
                   Number of events                     1.97 × 10¹²                   1.29 × 10⁹

     The two volume sources described above were used to compute the angular and energy spectral
distributions of electrons, protons and photons around the high power laser-thin solid target interaction
point using the GEANT4 simulation toolkit [25,33,34]. Particle fluencies were also determined.
     The general particle sources (GPS) defined in GEANT4 provide a complex environment which
allows the inclusion into the simulation of both proton and electron sources, with a specific ratio of
particle numbers. It was considered a 1.97 × 10¹² total events number, (1.97 × 10¹² electron events
number and 1.29 × 10⁹ proton events number) and a proton to electron number ratio of 1.53 × 10³ .
The total events number and the ratio between electron and proton events number were generated
by analytical calculations using the TNSA model (Equations (1)–(6)) for the experimental parameters
mentioned above.
     Geant4 simulations were performed using the G4EmLivermore interaction library for
electromagnetic radiation and QGSP_BIC_HP for proton interaction. Binary cascade models were
activated for Ion interactions [33,34].
     Monte Carlo algorithms provide a statistical approach for radiation transport within environments
and detectors, the uncertainties being lower than 1% for simulations that runs for 1012 events number.
The main source of inconsistencies in Monte Carlo simulations are represented by the variance reduction
techniques [35] usually employed for decreasing the simulation run time. Such method was not
applied here.
     Scoring was performed using the Geant4 command line-based scoring system and a
cylindrical mesh. The scoring mesh was binned in polar coordinates and had 5 degree angular and
0.2 cm radial steps, respectively. Proton, electron, and photon spectra, as well as their corresponding
fluencies were assessed.
     The simulations were performed using a 32 core XENON E5-2650 with 20 GB RAM. The run time
was approximately of 70 ± 4 h per simulation and the statistical fluctuations were less than 1%.
     The data were made available in a familiar web interface using Jupyter Notebooks [36].
This approach allowed for interactive data processing techniques to be applied to validate the
simulation results. Thus, the output data files were easily integrated into other software packages for
data analysis and further processing.

(c)    Description of the Geometry Mesh of the Experimental Set-Up Used for Calculation of Radiation
       Dose Map Inside the Vacuum Chamber

      The simulation of radiation dose map was also performed with the Geant4 v.10.5 framework tools
described above [25,33,34].
      Firstly, the electron and proton sources were implemented into a mesh (see Figure 1) adapted
to the specific parameters of the experimental set-up presented in Figure 2. The electron source (the
first source of radiation) is illustrated as a yellow disk, the red disk represent the 5 µm thick target
behind which is positioned the proton source (the second source of radiation) designed as a green disk.
The two sources were integrated into the simulation model using the GPS that allows the positioning
of more than one source within an experimental set-up. Also, it was considered, that, the electrons
that propagate in vacuum can generate nuclear reactions when interact with experimental set-up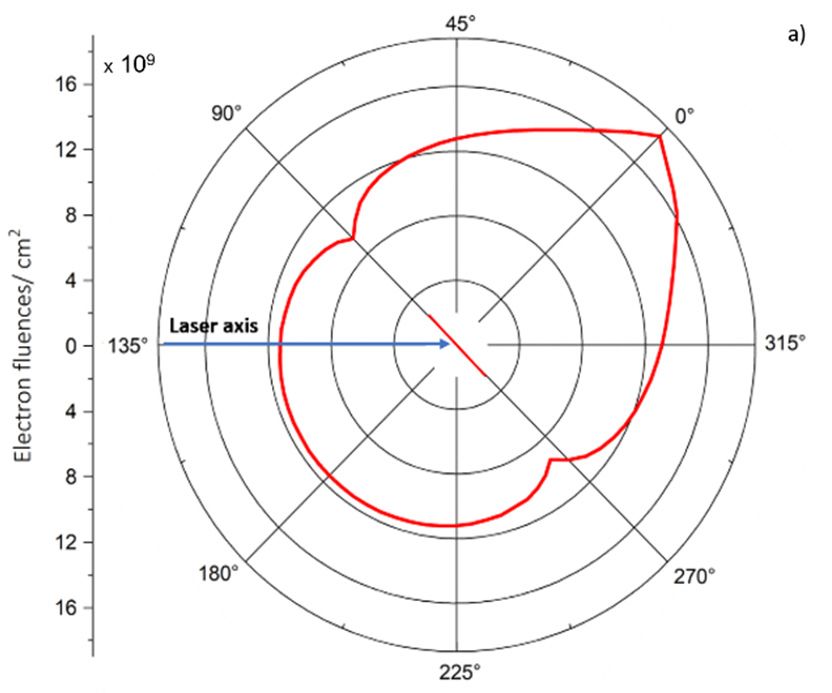
Appl. Sci. 2020, 10, 4390                                                                                            6 of 15

     components (see Figure 2), producing secondary radiation such photons. For the considered particles
     energy range, in the simulation model, all available nuclear processes (in GEANT4 General Particle
     Source tools) were considered. The mesh of the experimental set-up was implemented using GEANT4
     standard geometry components without any Boolean operations, and the overlapping regions were
     tested at the beginning of each run.
Appl. Sci. 2020, 10, × FOR PEER REVIEW                                                        6 of 15

     Figure    1. Geometry
            Figure            mesh of
                     1. Geometry   meshthe GEANT4    simulation
                                           of the GEANT4          model: 1a—source
                                                              simulation             of electrons;
                                                                          model: 1a—source         1b—target;
                                                                                               of electrons;    1c—
                                                                                                             1b—target;
     source    of protons;
            1c—source         2—hole; 2—hole;
                          of protons;   3—magnetic     spectrometer;
                                                  3—magnetic           4—target4—target
                                                                 spectrometer;   holder; 5—detector     holder; 6—
                                                                                           holder; 5—detector     holder;
     aluminum       cylinder.cylinder.
            6—aluminum        The structure  of the electron,
                                        The structure         proton sources
                                                       of the electron, protonand targetand
                                                                               sources   aretarget
                                                                                             presented  in the right
                                                                                                   are presented   in the
 Appl.corner   of the
       Sci. right
            2020, 10, ×image.
                        FOR
                   corner ofPEER  REVIEW
                             the image.                                                                               7 of 15

2.2. Experimental Setup Used to Measure Electron and Proton Spectra at 3 cm Distance from Target n
       The mapping of the radiation dose inside the target chamber has been performed during
experiments [24] of high power-thin solid target interaction for a laser intensity in focus of about 5 ×
1019 W/cm2 (40 fs pulse duration [24,37]). The target was tilted at 45° with respect to the laser beam
focus position. The laser spot surface area was (9 × 23) 207 µm2 and the fraction of energy in the laser
spot (at full width half maximum) was ~30%. The elliptical shape of the focal spot was previously
attributed to the slightly ellipticity of the incoming beam [8,38].
       The experimental set-up from Figure 2, was designed to allow a straightforward analysis of laser
accelerated electron and proton beams.
       It is composed of the targets and passive detectors holder ensemble, a magnetic spectrometer (B
~ 0.6 T), and an optical analysis ensemble. The target and detector holder system consist in two
parallel metallic plates centered using a horizontal metallic ax. The targets were positioned on the
first plate while the passive detectors used for proton beams analysis were placed on the second plate.
The spectral analysis of the proton beams achieved using CR-39 detectors was reported in [24].
Behind the second plate a centered (to the drilled holes) magnetic spectrometer, for the estimation of
the energy of the laser accelerated electrons, was placed in a fix position, while the target and detector
                         Figure
holder ensemble can          be 2.rotated.
                            Figure (a) Experimental
                                    2. (a)   Aroundset-up;
                                           Experimental        (b) (b)
                                                          set-up;
                                                        the        Detailed
                                                             magnetic        of the
                                                                       Detailed      experimental
                                                                                 of the
                                                                          spectrometer      can beset-up.
                                                                                         experimental  set-up. a metallic
                                                                                                      observed
cylinder that can be simultaneous rotated with the target and detector holder plates. On the inner
             The angular
  2.3. Calibration    of EBT3and   energy spectral
                                Radiochromic           distributions
                                                 Films used  for Mappingof electrons,     protons
                                                                            of the Radiation    Fieldand photons obtained as
surface of the cylinder (see Figure 2) EBT3 radiochromic films were positioned. A maximum electron
      result of the interaction of laser spot with the Ag target, as well as the geometry mesh from Figure 1,
energyThe      dosimetry
           of about   13 MeVassessment     duringfrom
                               was estimated        highthe
                                                          power    laser-thin
                                                             coloring   of thesolid
                                                                                EBT3target    interaction
                                                                                        radiochromic       performed
                                                                                                        films.          using
                                                                                                               Such values
      were used to simulate the radiation dose map inside the vacuum chamber.
ofthe
    theEBT3     radiochromic
         electron               filmsalso
                     energies were      (RCF)   proved
                                            reported   into  be useful
                                                           similar      [39] and offers
                                                                    experimental            two-dimensional
                                                                                      conditions   [5].          information
  on the
       Theradiation
              target anddose.  The EBT3
                            detector        filmsensemble
                                        holder     have a symmetrical
                                                              are placed layer’s      structure translation
                                                                            on mechanical        as the activeand
                                                                                                                layer (28 µm
                                                                                                                    rotation
  thick)for
stages     is sandwiched     between
               precise alignment         two 125
                                     of each       µminmatte-polyester
                                               target     the focus of thesubstrates
                                                                             laser beam.  (Ashland    Advanced
                                                                                             The optical          Materials).
                                                                                                           analysis  system
isThese
   describedpolyester     layers
                  in detail       prevent the formation of Newton ring interference patterns when the
                            in [24].
  irradiated EBT3 films are scanned with flatbed scanners [39].
         The EBT3 films were calibrated using both high energy photons generated by a 40 kV X-ray
  source [40] and electrons with an energy of about 5 MeV using a classical medical accelerator. In the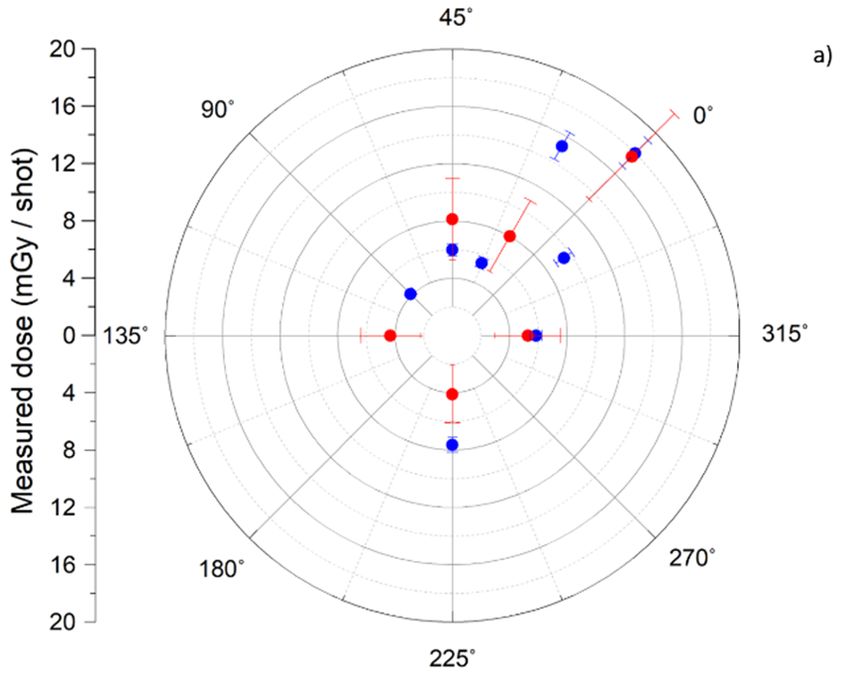
Appl. Sci. 2020, 10, 4390                                                                            7 of 15

2.2. Experimental Setup Used to Measure Electron and Proton Spectra at 3 cm Distance from Target n
      The mapping of the radiation dose inside the target chamber has been performed during
experiments [24] of high power-thin solid target interaction for a laser intensity in focus of about
5 × 10¹⁹ W/cm2 (40 fs pulse duration [24,37]). The target was tilted at 45◦ with respect to the laser beam
focus position. The laser spot surface area was (9 × 23) 207 µm2 and the fraction of energy in the laser
spot (at full width half maximum) was ~30%. The elliptical shape of the focal spot was previously
attributed to the slightly ellipticity of the incoming beam [8,38].
      The experimental set-up from Figure 2, was designed to allow a straightforward analysis of laser
accelerated electron and proton beams.
      It is composed of the targets and passive detectors holder ensemble, a magnetic spectrometer
(B ~ 0.6 T), and an optical analysis ensemble. The target and detector holder system consist in two
parallel metallic plates centered using a horizontal metallic ax. The targets were positioned on the
first plate while the passive detectors used for proton beams analysis were placed on the second
plate. The spectral analysis of the proton beams achieved using CR-39 detectors was reported in [24].
Behind the second plate a centered (to the drilled holes) magnetic spectrometer, for the estimation of
the energy of the laser accelerated electrons, was placed in a fix position, while the target and detector
holder ensemble can be rotated. Around the magnetic spectrometer can be observed a metallic cylinder
that can be simultaneous rotated with the target and detector holder plates. On the inner surface of
the cylinder (see Figure 2) EBT3 radiochromic films were positioned. A maximum electron energy of
about 13 MeV was estimated from the coloring of the EBT3 radiochromic films. Such values of the
electron energies were also reported in similar experimental conditions [5].
      The target and detector holder ensemble are placed on mechanical translation and rotation stages
for precise alignment of each target in the focus of the laser beam. The optical analysis system is
described in detail in [24].

2.3. Calibration of EBT3 Radiochromic Films used for Mapping of the Radiation Field
     The dosimetry assessment during high power laser-thin solid target interaction performed using
the EBT3 radiochromic films (RCF) proved to be useful [39] and offers two-dimensional information
on the radiation dose. The EBT3 films have a symmetrical layer’s structure as the active layer (28 µm
thick) is sandwiched between two 125 µm matte-polyester substrates (Ashland Advanced Materials).
These polyester layers prevent the formation of Newton ring interference patterns when the irradiated
EBT3 films are scanned with flatbed scanners [39].
     The EBT3 films were calibrated using both high energy photons generated by a 40 kV X-ray
source [40] and electrons with an energy of about 5 MeV using a classical medical accelerator. In the
paper of Sorriaux et al. [41], it was shown that EBT3 RCF can be used for dosimetry measurements of
photon, electron and proton beams as their calibration curves (in the same dose range), are similar.
The uncertainties of the EBT3 calibration curves presented there were within 1.5% for photons and
protons and 2% for electrons [41].
     A high precision measurement of the optical density of each EBT3 film is essential for the evaluation
of the ionizing particles radiation dose values inside the target chamber.
     The EBT3 films exposed during the high-power laser thin solid target experiments, as well as
those used for the determination of the calibration curve (see Figure 3b) were scanned using an
EPSON Expression 11000XL professional scanner with a resolution of 4800 dpi in transmission mode.
The scanned area was about 0.5 × 0.5 cm2 for each film.
Appl. Sci. 2020, 10, 4390                                                                                                  8 of 15
  Appl. Sci. 2020, 10, × FOR PEER REVIEW                                                                                      8 of 15

      Figure    (a)(a)
             3. 3.
        Figure      Pixel values
                       Pixel     to to
                             values optical density
                                       optical      Rodbard
                                               density      calibration
                                                       Rodbard           curve.
                                                               calibration      (b)(b)
                                                                           curve.   The dependence
                                                                                       The         of of
                                                                                           dependence optical
                                                                                                         optical
      density on  radiation  dose.
        density on radiation dose.

      The scanned images of the EBT3 films were processed with ImageJ software in order to convert
   3. Results and Discussions
the pixel values into standard optical density (OD) [42]. For this purpose, a Kodak calibrated optical
   (a) Simulation
density   step tabletResults
                        [42] hasonbeen
                                    the Angular
                                           used and   Spectral   Distribution
                                                          the images            of Electron,into
                                                                        were converted        Proton    and
                                                                                                   8 bits     Photon
                                                                                                           grey       Beams
                                                                                                                  scale. The pixel
         Generated   in  TNSA    Regime
values range from 0–255 gray units. A so-called Rodbard calibration function [43,44] was used for
pixel values
         Lasertoaccelerated
                   obtain an optical
                                electron density     transformation:
                                             and proton                    y = d + (aare
                                                              beams in vacuum          − d)/(1   + (x/c)b ) sources
                                                                                          the primary       where a of= 80.147399,
                                                                                                                         radiation in
b =a 0.102551,   c =  1.109687    ×  10 12 , d  =  8.304216.     The  R 2 was   0.997.  This   function
      high power laser-thin solid target interaction experiment in the TNSA regime. The secondary           was   identified  to be
suitable   for source
   radiation   pixel values    to OD
                        consists   mainlycalibration       in medical applications
                                               of bremsstrahlung         X-ray photons   andor for  the establishment
                                                                                                gamma                      of doseby
                                                                                                           rays both produced
response    curves   [43,44].  The   graph      of the   Rodbard    function    is presented     in  Figure
   the interaction of hot electrons with target nuclei. The interaction of primary radiation, (mainly of      3a.
      The calibration
   electrons)              graph presented
                with the vacuum       chamber walls   in Figure      3b was placed
                                                             and detectors      obtained     for a 40distances
                                                                                        at different       keV photons       beam.
                                                                                                                     and inclination
The   calibration
   angles            curvetoobtained
            with respect                    for 5 MeV
                               the laser–target              electrons
                                                       interaction        is similar
                                                                      point,  also generate        ±7%) with that
                                                                                       (withinbremsstrahlung             one from
                                                                                                                      radiation  on a
Figure   3b.  Both   curves
   nanosecond time scale.     were    used     for  calculation    of  the  radiation   dose    inside   the  target  chamber    as
well as The
         for the   electron
              opening        maximum
                          angle  of proton    energy     (of about
                                                and electron         13 MeV) estimation.
                                                                  accelerated    beams depend    Theon black
                                                                                                         few squares
                                                                                                               parametersrepresent
                                                                                                                             such as:
thetarget
     measured      data  values    and    in  red   is  the   curve  used    for fitting.  As    fitted
           thickness, laser intensity, laser focal spot size, emittance, and source dimensions [1–6].    function,    we  usedMany
                                                                                                                                 an
exponential    one.   The  fitting  parameters        was:    R 2 = 0.997, and standard error was about 0.069.
   authors [1–6,27,45–47] reported that electron and proton beams generated in TNSA regime have the
   highest number and energy in forward direction, normal to the target. The decrease of protons energy
3. Results and Discussions
   with the increase of opening angle was reported both by calculations and experimental
(a)measurements
       Simulation Results
                   [9,45]. on the Angular Spectral Distribution of Electron, Proton and Photon Beams
       Generated
         The spectra TNSA
                  in        Regime
                     of proton and electron accelerated beams as well as of the emitted photons calculated
   using the simulation model described above (without considering the mesh of the experimental set-
      Laser accelerated electron and proton beams in vacuum are the primary sources of radiation
   up presented in Figure 1) allowed us to find angular and energy distributions of primary and
in a high power laser-thin solid target interaction experiment in the TNSA regime. The secondary
   secondary radiation (see Figures 4 and 5).
radiation source consists mainly of bremsstrahlung X-ray photons or gamma rays both produced by
         Within 0–15 degrees of angle, the spectra of electrons, protons, and photons are shown in Figure
the interaction of hot electrons with target nuclei. The interaction of primary radiation, (mainly of
   4 (0° is considered in forward direction normal to the target position). These spectra are calculated
electrons) with the vacuum chamber19walls and       detectors placed at different distances and inclination
   for the pulse duration time, 5 × 10 W/cm2 laser intensity, and at 3 cm distance from the laser–target
angles with respect to the laser–target interaction point, also generate bremsstrahlung radiation on a
   interaction point. In Figure 4a can be observed, that the most energetic protons are emitted in normal
nanosecond time scale.
   direction to the target position. Within 5 degrees angle the energy of protons drastically decreases.
      The opening angle of proton and electron accelerated beams depend on few parameters
   However, the electron spectra presented in Figure 4b indicate only the decrease of electron numbers
such as: target thickness, laser intensity, laser focal spot size, emittance, and source dimensions [1–6].
   as the angle increases (see Figure 4b). The spectra of photons also display an angular dependence (see
Many authors [1–6,27,45–47] reported that electron and proton beams generated in TNSA regime
   Figure 4c). The spectra obtained for angles between 345° and 0° degrees are similar.
have the highest number and energy in forward direction, normal to the target. The decrease of
protons energy with the increase of opening angle was reported both by calculations and experimental
measurements [9,45].
      The spectra of proton and electron accelerated beams as well as of the emitted photons calculated
using the simulation model described above (without considering the mesh of the experimental set-up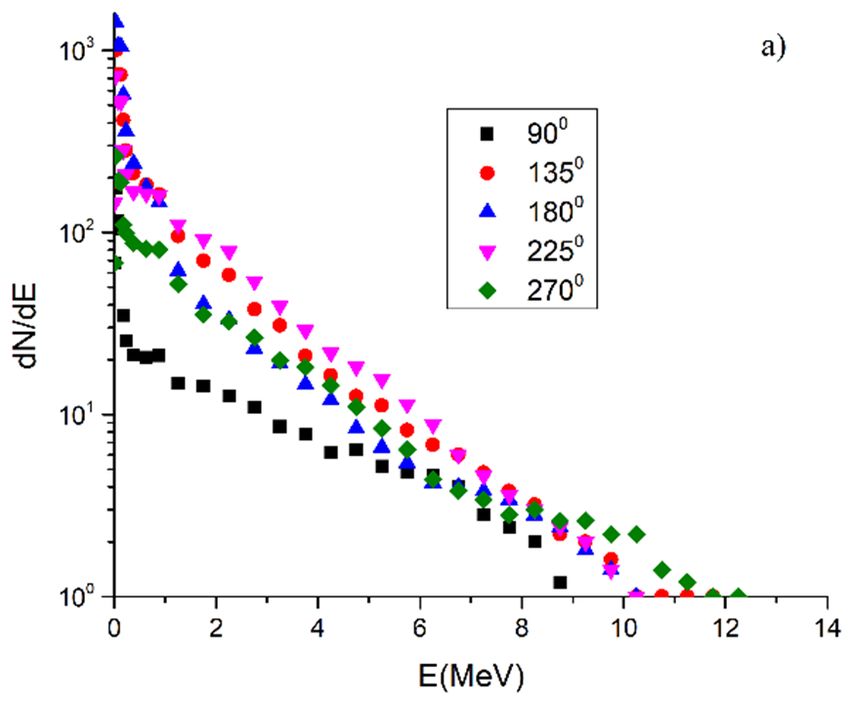
Appl. Sci. 2020, 10, × FOR PEER REVIEW                                                                           9 of 15

Appl. Sci. 2020, 10, 4390                                                                                        9 of 15

presented in Figure 1) allowed us to find angular and energy distributions of primary and secondary
Appl. Sci. 2020,
radiation    (see10,Figures
                     × FOR PEER REVIEW
                             4 and 5).                                                                           9 of 15

        Figure 4. Simulated spectra of laser accelerated: (a) protons; (b) electrons beams and (c) emitted
        photons at different angles within 0–15 degrees range. 0° is considered in forward direction normal
        to target.

        The interaction between the laser focused spot and target was considered to produce ionizing
 radiation within 0–360°. The spectra of electrons and photons at different angles between 90° and
 270°Figure
        are presented    in Figure
              4. Simulated
                  Simulated   spectra5.of
                              spectra   The
                                       of     number
                                           laser
                                           laser        of emitted
                                                 accelerated:
                                                 accelerated: (a)    electrons
                                                               (a) protons;
                                                                   protons; (b)  and photons
                                                                             (b) electrons
                                                                                 electrons beams
                                                                                           beamsasand
                                                                                                   well(c)asemitted
                                                                                                  and        their energy
 are photons
     lower than      those  emitted   in  the  0–15°  range  (see  Figure
                                                                     ◦     4). Proton   spectra were  not
                at different angles within 0–15 degrees range. 0° is considered in forward direction normal  generated in
 thistoangular
         target. range.

      The interaction between the laser focused spot and target was considered to produce ionizing
radiation within 0–360°. The spectra of electrons and photons at different angles between 90° and
270° are presented in Figure 5. The number of emitted electrons and photons as well as their energy
are lower than those emitted in the 0–15° range (see Figure 4). Proton spectra were not generated in
this angular range.

       Figure5.5.Simulated
      Figure      Simulatedspectra
                            spectraofoflaser
                                        laseraccelerated:
                                              accelerated:(a)
                                                           (a)electron
                                                               electronand
                                                                        and(b)
                                                                            (b)photon
                                                                                photonbeams
                                                                                       beamsatatdifferent
                                                                                                 differentangles.
                                                                                                           angles.

      Within 0–15 degrees of angle, the spectra of electrons, protons, and photons are shown in Figure 4
(0◦ is considered in forward direction normal to the target position). These spectra are calculated for
the pulse duration time, 5 × 10¹⁹ W/cm2 laser intensity, and at 3 cm distance from the laser–target

      Figure 5. Simulated spectra of laser accelerated: (a) electron and (b) photon beams at different angles.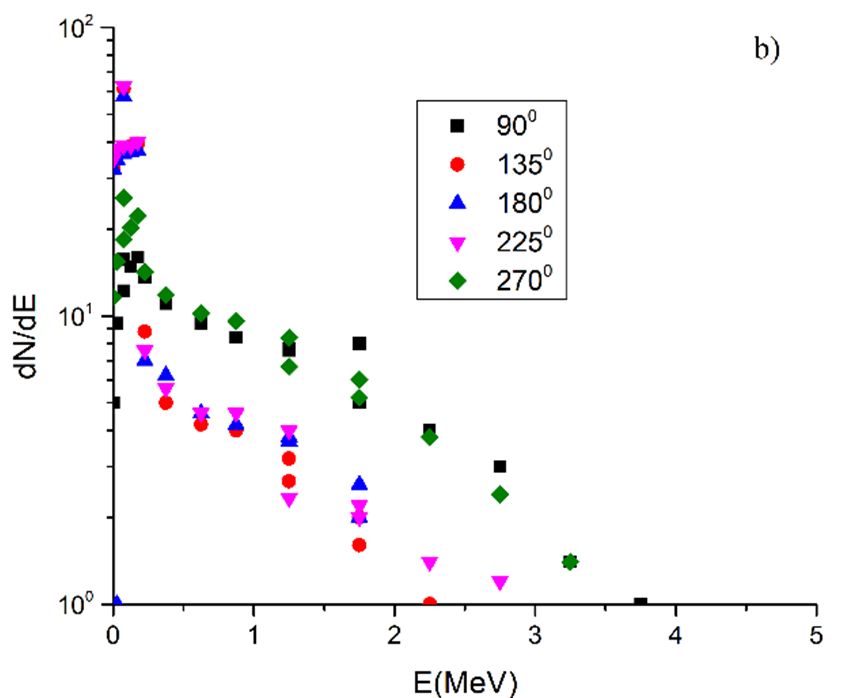
Appl. Sci. 2020, 10, 4390 10 of 15
interaction point. In Figure 4a can be observed, that the most energetic protons are emitted in normal
direction to the target position. Within 5 degrees angle the energy of protons drastically decreases.
However, the electron spectra presented in Figure 4b indicate only the decrease of electron numbers as
the angle increases (see Figure 4b). The spectra of photons also display an angular dependence (see
Figure 4c). The spectra obtained for angles between 345◦ and 0◦ degrees are similar.
The interaction between the laser focused spot and target was considered to produce ionizing
radiation within 0–360◦ . The spectra of electrons and photons at different angles between 90◦ and 270◦
are presented in Figure 5. The number of emitted electrons and photons as well as their energy are
lower than those emitted in the 0–15◦ range (see Figure 4). Proton spectra were not generated in this
angular range.
The spectra of electrons, protons, and photons (see Figures 4 and 5) display some fluctuations
in the distribution of particles as function of energy. It appears mainly at the highest energies and at
angles different from 0◦ . This is probably due to the statistical approach characteristic to the Monte
Carlo simulations [33,34] and to the fact that the number of generated particles at high energies, is low.
Anyway, these fluctuations are relatively small and do not affect the estimations of the electron, proton,
and photon spectral distributions. Similar distributions, but without any fluctuations, can be obtained
when the spectra are analytically calculated. However, such calculations are possible only at 0◦ .
The main advantage of the constructed simulation model is that the simultaneous calculations of
electron, proton and photon spectra and it angular dependence within 0–360◦ can offer an overall image
on the ionizing radiation distribution around the high power laser-thin solid target interaction point.
Thus, we can evaluate the evolution of the number of produced electrons, protons, and photons both
with energy and angle as a function of experimental parameters such as: laser intensity, laser pulse
duration, and the target thickness.
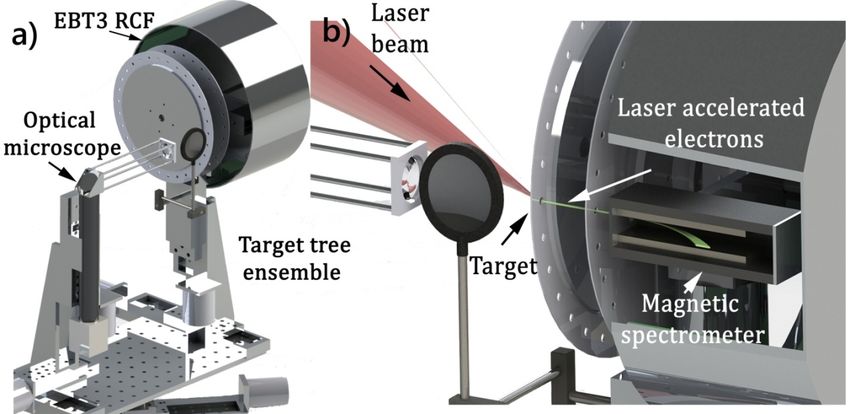
(b) Simulation results on Electron, proton, and Photon Fluencies
High-power laser–thin solid target interaction generates mixed radiation fields of electrons
and photons. The radiation dose measured inside the vacuum chamber by passive detectors, is mainly
attributed to photons and laser accelerated electrons. The interaction of electrons with the metallic
components of the chamber also generates bremsstrahlung radiation [7,8]. The protons are emitted in
the target normal direction, forwards, and backwards [27], being stopped in materials in accordance to
their stopping powers [48].
For near target radiation field assessment, the simulation model described above, allowed us the
estimation of total fluencies of radiation generated by the interaction of the high power laser beam
with the thin solid target. The fluencies of electrons, protons, and photons were also calculated (see
Figure 6), using as input data the spectra presented in Figures 4 and 5. It turns out that electrons
contribute ~98.9%, photons ~1%, and protons ~0.1%, respectively, to the total fluencies. The electrons,
and photons are produced almost uniformly around the interaction point, having a maximum in the
normal direction to the target position. The protons are emitted mainly in the forward direction.estimation of total fluencies of radiation generated by the interaction of the high power laser beam
with the thin solid target. The fluencies of electrons, protons, and photons were also calculated (see
Figure 6), using as input data the spectra presented in Figures 4 and 5. It turns out that electrons
contribute ~98.9%, photons ~1%, and protons ~0.1%, respectively, to the total fluencies. The electrons,
and
Appl.photons
Sci. 2020, are produced almost uniformly around the interaction point, having a maximum in
10, 4390 11 the
of 15
normal direction to the target position. The protons are emitted mainly in the forward direction.
Appl. Sci. 2020, 10, × FOR PEER REVIEW 11 of 15
Figure 6.6. Angular 2 at 3 cm
Figure Angulardependence
dependence of particle fluencies/cm
of particle fluencies/cm 2 atfrom
3 cmthefrom
interaction point on logarithmic
the interaction point on
scale: (a) electrons
logarithmic (b)electrons
scale: (a) protons (c)
(b)photons
protons and (d) totaland
(c) photons fluencies.
(d) total fluencies.
(c) Simulated
(c) Simulatedand
and Experimental
Experimental Dose
Dose Maps
Maps
implementing the angular
By implementing angular and energy spectral distributions in the mesh associated with the
experimental set-up displayed in Figure 2, the simulated dose map was generated.
In the experiments
In experiments performed
performed using
using the
the experimental
experimental set-up
set-up from
from Figure
Figure 2, the radiation dose
inside the target chamber was charted, using
using EBT3
EBT3 RCF
RCF placed
placed at
at different
different distances and inclination
angles with respect to the high power laser-thin solid target interaction point. The calibration
angles calibration curve
from Figure 3b was used for calculation of the radiation dose inside the vacuum chamber.
chamber.
In Figure 7a, the radiation dose measured around the interaction point is shown, in comparison
one. The
with the simulated one. The dose
dose values
values are
are per
per laser
laser shot
shot and
and were
were normalized
normalized toto 30
30 cm
cm distance.
distance.
maximum values
As can be observed the maximum values of the radiation
radiation dose
dose were reached
reached in the forward target
normal direction.
There are certain inadequacies between experimental data and simulations (see Figure 7b). We
suppose that these discrepancies appear as the scattering of the radiation on the walls of the vacuum
chamber and from metallic cylinders placed around the magnetic spectrometer (see Figure 2), which
was not considered in the simulation model. Otherwise, it would determine a percentage of
uncertainties higher than 1% for 1012 events number, and the simulation run time would have
increased accordingly. Therefore, a simplified geometry was considered.
Moreover, the vacuum chamber has a rectangular parallelepiped geometrical shape [20] and the
maximum measured dose values away from the forward direction are in the proximity of the
chamber corners. Measured dose values of tens of mGy/per laser shot were obtained in similar
experimental conditions [8].uncertainties higher than 1% for 1012 events number, and the simulation run time would have
increased accordingly. Therefore, a simplified geometry was considered.
Moreover, the vacuum chamber has a rectangular parallelepiped geometrical shape [20] and the
maximum measured dose values away from the forward direction are in the proximity of the
chamber
Appl. corners.
Sci. 2020, 10, 4390 Measured dose values of tens of mGy/per laser shot were obtained in similar
12 of 15
experimental conditions [8].
Figure 7. (a) Map of the measured dose (blue dots) inside the target chamber and of the
simulated radiation dose (red dots); (b) The fluctuations in the angular distribution of measured
and simulated dose.
There are certain inadequacies between experimental data and simulations (see Figure 7b).
We suppose that these discrepancies appear as the scattering of the radiation on the walls of the
vacuum chamber and from metallic cylinders placed around the magnetic spectrometer (see Figure 2),
which was not considered in the simulation model. Otherwise, it would determine a percentage
of uncertainties higher than 1% for 1012 events number, and the simulation run time would have
increased accordingly. Therefore, a simplified geometry was considered.
Moreover, the vacuum chamber has a rectangular parallelepiped geometrical shape [20] and
the maximum measured dose values away from the forward direction are in the proximity of the
chamber corners. Measured dose values of tens of mGy/per laser shot were obtained in similar
experimental conditions [8].
Considering the electron and photon fluency data presented in Figure 6, we suppose that the
electrons have the largest contribution to the radiation dose (98.9%) while photons contribute only 1%.
Protons do not influence the dose value by more than 0.1%. Anyway, the protons with the highest
energy are emitted in the forward direction (see Figure 6 and Ref. [27]), even if in the backward
direction to the target position, they were also observed (see Figure 6 and Ref. [27]). The protons
emitted forward are stopped in the detectors placed at 3 cm distance from the target position (see
Figure 2).
Thus, based on the calculation of the angular dependence of particle fluencies, the radiation dose
map reconstruction was performed in any point within the area of interest. The presented simulation
model can be further developed for the calculation of dose in any material, by considering the energy
and type of incident radiation as well as possible reactions.
4. Conclusions
The results presented in this paper link the angular and energy distributions of electrons, protons,
and photons calculated within 0–360◦ , with an angular step of five degrees, to the radiation dose map.
This is achieved through integration into the simulation model and the use of an experimental set
up mesh. The geometry of the experimental set-up was designed in the Geant4 General Particle Source
code and was considered for the calculation of the radiation dose around the high-power laser-solid
thin foil interaction point. When comparing the calculated dose map with the experimental one,
certain discrepancies between the values of dose obtained at different angles were observed. This is
most probably because the scattering of radiation into the vacuum chamber was not considered in the
simulation model.Appl. Sci. 2020, 10, 4390 13 of 15
Integrated dose per laser shot of about 15 mGy (due to electrons and photons) in the
normal direction to the target, at 30 cm distance from the laser–target interaction point was
experimentally measured.
Excepting the geometry of our experimental set-up, the presented simulation model allows for
the calculation of the fluencies of electrons, protons, and photons based on their energy and angular
spectral distributions. Our results show that electrons contribute almost ~99% to the value of total
fluencies generated around the interaction point, while photons have a 1% share.
The numerical and experimental investigations presented in this paper suggest that high power
laser–thin solid target experiments can be used as a test environment for electronic devices placed
onboard spacecraft and space stations, the main advantage being the simultaneous generation of
electrons, protons, and photons.
Author Contributions: Conceptualization, A.G., A.C., B.B., and M.S.; methodology, A.G, B.B., M.S., E.S.,
and D.B.D.; investigation, B.B., M.S., E.S., and D.B.D.; software, A.C. and D.B.D.; validation, A.G., A.C., M.G., B.B.,
M.S., and E.S., D.B.D.; formal analysis, A.G. and A.C.; writing—original draft preparation A.G., A.C., E.S., B.B.,
E.S., M.S., D.B.D., and M.G.; writing—review and editing A.G., A.C., E.S., and D.B.D. All authors have read and
agreed to the published version of the manuscript.
Funding: Work has been funded by European Space Agency within the ESA contract
No. 4000121912/17/NL/CBi/2017.
Acknowledgments: We acknowledge support from the CETAL-PW facility at the National Institute for Laser,
Plasma and Radiation Physics, Magurele, Romania. We also thank to S, erban Udrea from GSI-Darmstadt for
fruitful discussions.
Conflicts of Interest: The authors declare no conflict of interest. The funders had no role in the design of the
study; in the collection, analyses, or interpretation of data; in the writing of the manuscript, or in the decision to
publish the results.
References
1. Fuchs, J.; Antici, P.; d’Humieres, E.; Lefebvre, E.; Borghesi, M.; Brambrink, E.; Cecchetti, C.A.; Kaluza, M.;
Malka, V.; Manclossi, M.; et al. Laser-driven proton scaling laws and new paths towards energy increase.
Nat. Phys. 2006, 2, 48–56. [CrossRef]
2. Macchi, A.; Borghesi, M.; Passoni, M. Ion acceleration by superintense laser-plasma interaction.
Rev. Mod. Phys. 2013, 85, 751–793. [CrossRef]
3. Bolton, P.R.; Borghesi, M.; Brenner, C.; Carroll, D.C.; Martinis De, C.; Flacco, A.; Floquet, V.; Fuchs, J.;
Gallegos, P.; Giove, D.; et al. Instrumentation for diagnostics and control of laser-accelerated proton
(ion) beams. Phys. Med. 2014, 30, 255–270. [CrossRef] [PubMed]
4. Ledingham, K.W.D.; Galster, W. Laser-driven particle and photon beams and some applications. New J. Phys.
2010, 12, 045005. [CrossRef]
5. Hidding, B.; Karger, O.; Konigstein, T.; Pretzler, G.; Manahan, G.G.; McKenna, P.; Gray, R.; Wilson, R.;
Wiggins, S.M.; Welsh, G.H.; et al. Laser-plasma-based Space Radiation Reproduction in the Laboratory.
Sci. Rep. 2017, 7, 42354. [CrossRef]
6. Zigler, A.; Eisenman, S.; Botton, M.; Nahum, E.; Schleifer, E.; Baspaly, A.; Pomerantz, I.; Abicht, F.; Branzel, J.;
Priebe, G.; et al. Enhanced Proton Acceleration by an Ultrashort Laser Interaction with Structured Dynamic
Plasma Targets. Phys. Rev. Lett. 2013, 110, 215004. [CrossRef]
7. Liang, T.T.; Bauer, J.M.; Liu, J.C.; Rokni, S.H. Radiation protection around high-intensity laser interactions
with solid targets. Health Phys. 2018, 115, 6. [CrossRef]
8. Liang, T.; Bauer, J.; Cimeno, M.; Ferrari, A.; Galtier, E.; Granados, E.; Lee, H.J.; Liu, J.; Nagler, B.; Prinz, A.;
et al. Radiation dose measurements for high-intensity laser interactions with solid targets at SLAC, Rad.
Prot. Dosim. 2016, 172, 346–355. [CrossRef]
9. Nurnberg, F.; Schollmeier, M.; Brambrink, E.; Blazevic, A.; Carroll, D.C.; Flippo, K.; Gautier, D.C.; Geißel, M.;
Harres, K.; Hegelich, B.M.; et al. Radiochromic film imaging spectroscopy of laser accelerated proton beams.
Rev. Sci. Instrum. 2009, 80, 033301. [CrossRef]Appl. Sci. 2020, 10, 4390 14 of 15
10. Jeong, T.W.; Singh, P.K.; Scullion, C.; Ahmed, H.; Hadjisolomou, P.; Jeon, C.; Yun, H.; Kakolee, K.F.;
Borghesi, M.; Ter-Avetisyan, S. CR-39 track detector for multi-MeV ion spectroscopy. Sci. Rep. 2017, 7, 2152.
[CrossRef]
11. Jeong, T.W.; Singh, P.K.; Scullion, C.; Ahmed, H.; Kakolee, K.F.; Hadjisolomou, P.; Alejo, A.; Kar, S.;
Borghesi, M.; Ter-Avetisyan, S. Experimental evaluation of the response of micro-channel plate detector to
ions with 10s of MeV energies. Rev. Sci. Instrum. 2016, 87, 083301. [CrossRef] [PubMed]
12. Fiorini, F.; Neely, D.; Clarke, R.J.; Green, S. Characterization of laser-driven electron and photon beamsusing
the Monte Carlo code FLUKA. Laser Part. Beams 2014, 32, 233–241. [CrossRef]
13. Zell, H. Space Weather. Text. NASA. Available online: http://www.nasa.gov/mission_pages/rbsp/science/
rbsp-spaceweather.html (accessed on 1 March 2020).
14. Tokumaru, M. Three-dimensional exploration of the solar wind using observations of
interplanetary Scintillation. Proc. Jpn. Acad. Ser. B 2013, 89, 67–79. [CrossRef] [PubMed]
15. Cannon, P. Extreme Space Weather: Impacts on Engineered Systems and Infrastructures, in Royal Academy
of Engineering. Available online: https://www.raeng.org.uk/publications/reports/space-weather-full-report
(accessed on 5 March 2020).
16. Delzanno, G.L.; Borovsky, J.E.; Thomsen, M.F.; Moulton, J.D.; Macdonald, E.A. Future beam experiments in
the magnetosphere with plasma contactors: How do we get the charge off the spacecraft? J. Geophys. Res.
Space Phys. 2015, 120, 3647–3664. [CrossRef]
17. Holly, Z. National Aeronautics and Space Administration. Available online: https://www.nasa.gov/mission_
pages/rbsp/science/rbsp-spaceweather-human.html (accessed on 4 August 2017).
18. Konigstein, T.; Karger, O.; Pretzler, G.; Rosenzweig, J.B.; Hidding, B. Design considerations for the use of
laser-plasma accelerators for advanced space radiation studies. J. Plasma Phys. 2012, 78, 383–391. [CrossRef]
19. Danson, C.; Hillier, D.; Hopps, N.; Neely, D. Petawatt class lasers worldwide. High Power Laser Sci. Eng.
2015, 3, e3. [CrossRef]
20. Center for Advanced Laser Technologies (CETAL), Ultra-intense Lasers Laboratory. Available online:
http://cetal.inflpr.ro/newsite/cetal-pw (accessed on 20 February 2020).
21. Asavei, T.; Tomut, M.; Bobeica, M.; Aogaki, S.; Cernaianu, M.O.; Ganciu, M.; Kar, S.; Manda, G.; Mocanu, N.;
Neagu, L.; et al. Materials in extreme environments for energy, accelerators and space applications at ELI-NP.
Rom. Rep. Phys. 2016, 68, S275–S347.
22. Ganciu, M.; Groza, A.; Cramariuc, O.; Mihalcea, B.; Serbanescu, M.; Stancu, E.; Surmeian, A.; Butoi, B.;
Dreghici, D.; Chirosca, A.; et al. Hardware and software methods for radiation resistance rising of the
critical infrastructures. Rom. Cyber Secur. J. 2019, 1, 3–13.
23. Narici, L.; Casolino, M.; Fino, L.; Di Larosa, M.; Picozza, P.; Rizzo, A.; Zaconte, V. Performances of
Kevlar and Polyethylene as radiation shielding on-board the International Space Station in high latitude
radiation environment. Sci. Rep. 2017, 7, 1–11. [CrossRef]
24. Groza, A.; Serbanescu, M.; Butoi, B.; Stancu, E.; Straticiuc, M.; Burducea, I.; Balan, A.; Chirosca, A.;
Mihalcea, B.; Ganciu, M. Advances in Spectral Distribution Assessment of Laser Accelerated Protons using
Multilayer CR-39 Detectors. Appl. Sci. 2019, 9, 2052. [CrossRef]
25. Allison, J.; Amako, K.; Apostolakis, J.; Arce, P.; Asai, M.; Aso, T.; Bagli, E.; Bagulya, A.; Banerjee, S.;
Barrand, G.J.N.I.; et al. Recent developments in Geant4. Nucl. Instrum. Methods Phys. Res. A
2016, 835, 186–225. [CrossRef]
26. Python Core Team. Python: A Dynamic, Open Source Programming Language; Python Software Foundation, 2015.
Available online: https://www.python.org/ (accessed on 20 May 2020).
27. Roth, M.; Schollmeier, M. Ion Acceleration—Target Normal Sheath Acceleration. In Proceedings
of the CAS-CERN Accelerator School: Plasma Wake Acceleration Geneva, Geneva, Switzerland,
23–29 November 2014.
28. Mora, P. Plasma expansion in vacuum. Phys. Rev. Lett. 2003, 90, 185002. [CrossRef] [PubMed]
29. Tampo, M.; Awano, S.; Bolton, P.R.; Kondo, K.; Mima, K.; Mori, Y.; Kodama, R. Correlation between laser
accelerated MeV proton and electron beams using simple fluid model for target normal sheath acceleration.
Phys. Plasmas 2010, 17, 7. [CrossRef]
30. Xiao, K.D.; Zhou, C.T.; Jiang, K.; Yang, Y.C.; Li, R.; Zhang, H.; He, X.T. Multidimensional effects on proton
acceleration using high-power intense laser pulses. Phys. Plasmas 2018, 25, 2. [CrossRef]Appl. Sci. 2020, 10, 4390 15 of 15
31. Volpe, L.; Fedosejevs, R.; Gatti, G.; Pérez-Hernández, J.A.; Méndez, C.; Apiñaniz, J.; Roso, L. Generation
of high energy laser-driven electron and proton sources with the 200 TW system VEGA 2 at the Centro de
Laseres Pulsados. High Power Laser Sci. Eng. 2019, 7, 6–11. [CrossRef]
32. Morita, T.; Esirkepov, T.Z.; Bulanov, S.V.; Koga, J.; Yamagiwa, M. Tunable High-Energy Ion Source via
Oblique Laser Pulse Incident on a Double-Layer Target. Phys. Rev. Lett. 2008, 100, 145001. [CrossRef]
33. Agostinelli, S.; Allison, J.; Amako, K.A.; Apostolakis, J.; Araujo, H.; Arce, P.; Asai, M.; Axen, D.; Banerjee, S.;
Barrand, G.; et al. Geant4—a simulation toolkit. Nucl. Instrum. Methods Phys. Res. A 2003, 506, 250–303.
[CrossRef]
34. Allison, J. Geant4 developments and applications. IEEE Trans. Nucl. Sci. 2006, 53, 270–278. [CrossRef]
35. Kong, R.; Ambrose, M.; Spanier, J. Efficient, Automated Monte Carlo Methods for Radiation Transport.
J. Comput. Phys. 2008, 227, 9463–9476. [CrossRef]
36. The Jupyter Notebook. Available online: https://jupyter.org/ (accessed on 21 May 2020).
37. Giubega, G. Proton Acceleration in Ultra-Intense Laser Interaction with Solid Targets at CETAL-PW
Laser, WORKSHOP CETAL 2018. Available online: http://cetal.inflpr.ro/newsite/workshop_abstracts.php
(accessed on 15 December 2019).
38. Zeil, K.; Kraft, S.D.; Bock, S.; Bussmann, M.; Cowan, T.E.; Kluge, T.; Metzkes, J.; Richter, T.; Sauerbrey, R.;
Schramm, U. The scaling of proton energies in ultrashort pulse laser plasma acceleration. New J. Phys.
2010, 12, 045015. [CrossRef]
39. Najafi, M.; Geraily, G.; Shirazi, A.; Esfahani, M.; Teimouri, J. Analysis of Gafchromic EBT3 film calibration
irradiated with gamma rays from different systems: Gamma Knife and Cobalt-60 unit. Med. Dosim.
2017, 3, 159–168. [CrossRef] [PubMed]
40. Available online: http://tomography.inflpr.ro/ (accessed on 15 March 2020).
41. Sorriaux, J.; Kacperek, A.; Rossomme, S.; Lee, J.A.; Bertrand, D.; Vynckier, S.; Sterpin, E. Evaluation
of Gafchromic EBT3 films characteristics in therapy photon, electron and proton beams. Phys. Med.
2013, 6, 599–606. [CrossRef] [PubMed]
42. Available online: https://imagej.nih.gov/ij/docs/examples/calibration/ (accessed on 30 January 2020).
43. Available online: https://imagej.nih.gov/ij/docs/guide/146-30.html#sub:Curve-Fitting (accessed on
30 January 2020).
44. DeLean, A.; Munson, P.J.; Rodbard, D. Simultaneous analysis of families of sigmoidal curves: Application to
bioassay, radioligand assay, and physiological dose-response curves. Am. J. Physiol. 1978, 235, E97–E102.
[CrossRef] [PubMed]
45. Hatchett, S.P.; Brown, C.G.; Cowan, T.E.; Henry, E.A.; Johnson, J.S.; Key, M.H.; Koch, J.A.; Langdon, A.B.;
Lasinski, B.F.; Lee, R.W.; et al. Electron, photon, and ion beams from the relativistic interaction of Petawatt
laser pulses with solid targets. Phys. Plasmas 2000, 7, 5. [CrossRef]
46. Cowan, T.E.; Fuchs, J.; Ruhl, H.; Kemp, A.; Audebert, P.; Roth, M.; Stephens, R.; Barton, I.; Blazevic, A.;
Brambrink, E.; et al. Renard-Le Galloudec, N.; Ultralow Emittance, Multi-MeV Proton Beams from a Laser
Virtual-Cathode Plasma Accelerator. Phys. Rev. Lett. 2004, 92, 20. [CrossRef]
47. Carroll, D.C.; McKenna, P.; Lundh, O.; Lindau, F.; Wahlström, C.G.; Bandyopadhyay, S.; Pepler, D.; Neely, D.;
Kar, S.; Simpson, P.T.; et al. Active manipulation of the spatial energy distribution of laser-accelerated
proton beams. Phys. Rev. E 2007, 76, 065401R. [CrossRef]
48. Ziegler, J.F.; Biersack, J.P. The Stopping and Range of Ions in Matter; Bromley, D., Ed.; Treatise on
Heavy-Ion Science, Volume 6: Astrophysics, Chemistry, and Condensed Matter; Springer: Boston, MA,
USA, 1985; pp. 93–129.
© 2020 by the authors. Licensee MDPI, Basel, Switzerland. This article is an open access
article distributed under the terms and conditions of the Creative Commons Attribution
(CC BY) license (http://creativecommons.org/licenses/by/4.0/).You can also read