Assessment of BC Ferries' PT5 Submission - British Columbia Ferry Commission March 2019 - BC Ferry Commission
←
→
Page content transcription
If your browser does not render page correctly, please read the page content below

www.pwc.com/ca

                      Assessment of
                      BC Ferries’ PT5
                      Submission

        British Columbia
        Ferry Commission

        March 2019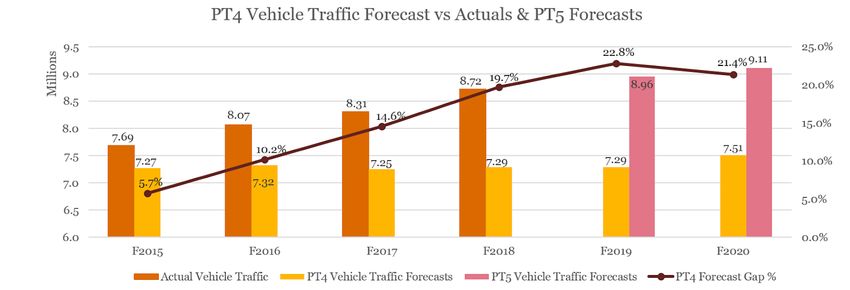
Table of Contents
Executive Summary                                                                    3
Introduction                                                                         5
           Purpose and Scope of the Assessment                                       5
           Organization of the Report                                                6
           Notice to Reader                                                          6
Assessment of BC Ferries’ PT5 Submission and Supporting Documentation                7
         Historical Traffic Trends                                                   8
            Traffic Forecasts for the Balance of PT4                                 8
            Assessment of Financial Forecasts for the Balance of PT4                10
            Reasonableness of PT4 Expense Growth                                    12
            Impact of Fare Initiatives in PT4                                       14
            PT4 Capital Expenditures                                                15
            Debt Covenants                                                          16
            Achievement of Targets in the Capital Plan and Efficiency Plan in PT4   16
          Alternative Service Providers                                              17
          Price Cap Compliance                                                       17
          Drop Trailer Compliance                                                   18
          Conclusions                                                                18
Assessment of Fuel Management Plan Outcomes in Performance Term Four                19
          Fuel Consumption                                                           19
          Fuel Management                                                            21
          Fuel Deferral Program                                                      21
          Conclusions                                                               22
Assessment of BC Ferries’ 2019-2030 Capital Plan Submission                         23
          Introduction                                                              23
          Capital Plan Summary                                                      23
          Approach to the Capital Cost Estimates                                    24
          Commentary                                                                25
          Conclusions                                                               33
Assessment of Strategies for Enhanced Efficiency in PT5 and Beyond                  34
          Introduction                                                              34
          Summary of the Strategies for Enhanced Efficiency                         34
          Improving On-time Performance                                             35
          Revenue Opportunities                                                     36
          Conclusions                                                               37
Assessment of BC Ferries’ Traffic Demand Forecasting                                38
            Overview                                                                38
            Changes in Traffic Forecasting Between PT4 and PT5                      39
            PT5 Forecast Results and Price Elasticities                             41
            Impact of the FFDEI & Seniors Program on Traffic                        42
            Conclusions and Recommendations                                         43
BC Ferry Commission’s PT5 Price Cap Assumptions                                     44
            Commissioner’s Price Cap Effects on Traffic                             45
            Total Revenue                                                           47
            Expenses                                                                49
            Loss/(Gain) on Disposal                                                 53
            Net Earnings                                                            53
            Debt & Credit Ratings                                                   53
            Efficiency Targets for PT5                                              55
            Conclusions                                                             57

                                                                                     2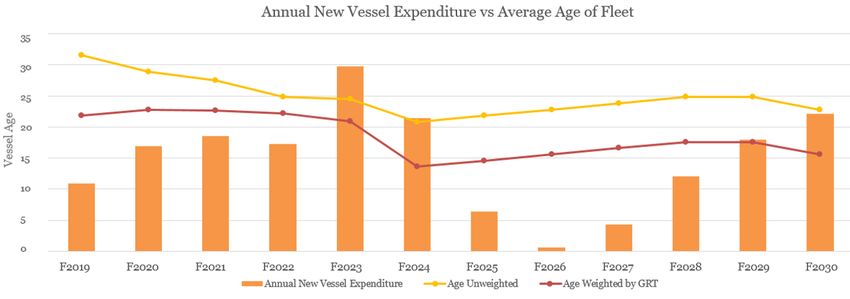
Executive Summary
PricewaterhouseCoopers LLP (“PwC”) was engaged by the British Columbia Ferry Commission (the
“Commission”) to assess the reasonableness of the following submissions made by the British Columbia
Ferry Services Inc.’s (“BC Ferries” or the “Company”) under Section 40 of the Coastal Ferry Act for
Performance Term Five (“PT5”):

●     Performance Term Four Report to the British Columbia Ferries Commissioner
●     Report on Fuel Management Plan Outcomes in Performance Term Four
●     Capital Plan Fiscal Years 2019 through 2030
●     Strategies for Enhanced Efficiency in Performance Term Five and Beyond
●     Traffic Demand Forecast (fiscal years 2019 through 2024)

PwC was also asked to assess financial forecasts developed by BC Ferries for PT5 and calculate price caps
based on efficiency targets and financial sustainability objectives for the Company.

The significant findings of our report are as follows:

●     Performance Term Four Report
      −    Costs and other financial information included in the PT4 report are reasonable and BC
           Ferries has satisfactorily explained unusual trends or variances between actual and
           forecasted results.
      −    BC Ferries’ forecasted results for the balance of PT4 can be relied on to produce reasonable
           and supportive projections for PT5. A concern, however, is the significant increase in labour
           in PT4 - specifically overtime hours - that impact labour cost forecasts in PT5.
      −    The efficiency target outcomes set by the Commission for PT4 of a $100 million reduction in
           the PT4 Capital Plan, operating efficiency gains of $4.9 million/year and productivity gains
           of $2 million/year are on track with the price cap, but enhanced documentation in PT5 is
           warranted.
      −    Price cap compliance and pricing of Drop Trailer services in PT4 are consistent with the
           Commissioner’s Orders.
●     Report on Fuel Management Plan Outcomes in Performance Term Four
      −    Fuel management plan outcomes for PT4 have been met.
      −    Fuel consumption and costs have been effectively managed.
      −    Hedging of gas prices would reduce commodity risk associated with LNG prices and should
           be considered.
      −    Accelerated conversion to electric vessels could further reduce fuel costs.
●     Capital Plan Fiscal Years 2019 through 2030
      −    The Capital Plan is designed to meet the requirements of the Coastal Ferry Services Contract.
           It is also consistent with the objectives of the 2012 Coastal Ferry Act Regulatory Review and
           corporate objectives with regard to pursuing standardization objectives for vessels and
           terminals.
      −    The capital efficiency target outcomes set by BC Ferries for PT4 appear to have been
           generally met.
      −    The 2019-2030 Capital Plan includes introduction of 17 new vessels and retirement of 13
           vessels which should reduce the average age of the fleet to a more optimal level.
      −    We have no concerns with enhanced Capital Planning Processes put in place in November
           2017. We note an improved framework integrating Fleet and Terminal Master Planning.
      −    There should be an update to the discount rate for future Section 55 capital project
           applications.

                                                                                                            3
− The very large Capital Plan does impact financial results through increased capital charges.
Consideration could be given to alternatives including passenger-only services on certain
routes that could reduce the scale of terminal projects.
● Strategies for Enhanced Efficiency in Performance Term Five and Beyond
− The initiatives identified in the PT5 efficiency plan appear to be consistent with the Coastal
Ferry Act Regulatory Review. They also address environmental objectives of reducing
emissions.
− The opportunities identified in the efficiency plan for PT5 are considered reasonable. In
some cases they lack quantification and specific timelines, including for the full conversion to
electric-powered vessels that would enhance the plan. A recommendation is for BC Ferries to
provide a report to the Commission prior to PT5 quantifying a conversion plan with
timelines.
● Traffic Demand Forecasting
− MIDAS, the new traffic forecasting method, is a suitable approach to utilize the forecasting of
BC Ferries traffic on the major routes. Demand drivers and price elasticities relationships
appear to be reasonable on major and minor routes.
− BC Ferries project minor growth in traffic in PT5; traffic forecast results are influenced by a
projected slowdown in the growth of the economy.
− Over and above the base MIDAS forecasts, strategic revenue management initiatives
designed to increase yields are forecasted to help traffic growth in PT5.
− There are no major concerns with BC Ferries’ demand forecasting approach. On an overall
basis, BC Ferries’ demand forecasting methodology and its associated methodologies are
considered appropriate for purposes of price cap rate setting.
● PT5 Forecasts
− BC Ferries’ forecast model was vetted and relied upon by PwC for purposes of analysis
− Options were assessed based on BC Ferries’ traffic and operating expense forecasts, its 12
year Capital Plan and projected debt at forecasted yields.
− Increases in operating expenses have been satisfactorily explained, including any increases
above the rate of inflation.
− The methodology for forecasting fuel costs are appropriate.
− A base case is calculated to allow BC Ferries sufficient revenues to meet forecasted operating
and debt obligations and long term financial sustainability objectives.
− The Commissioner has set an efficiency target of 1% for PT5. Examples of potential areas of
focus to achieve the efficiency target include reductions in overtime labour costs and IT
administration costs.
− The Commissioner has considered the base case information developed by PwC and has
requested an assessment on whether BC Ferries will be able to satisfy debt covenants and
debt ratio targets with a price cap of 2.3%, the efficiency target of 1%, an assumption that the
capital program will be fully funded as presented, and an assumption of no indexing of
current provincial ferry transportation fees. Based on those assumptions, a price cap of 2.3%
for PT5 is considered appropriate and reasonable.
4Introduction
Purpose and Scope of the Assessment
PricewaterhouseCoopers LLP (“PwC”) was engaged by the British Columbia Ferry Commission (the
“Commission”) to assess the reasonableness of the following submissions made by the British Columbia
Ferry Services Inc.’s (“BC Ferries”) under Section 40 of the Coastal Ferry Act for Performance Term Five
(“PT5”) on September 28, 2018:
● Performance Term Four Report to the British Columbia Ferries Commissioner
● Report on Fuel Management Plan Outcomes in Performance Term Four
● Capital Plan Fiscal Years 2019 through 2030
● Strategies for Enhanced Efficiency in Performance Term Five and Beyond
● Traffic Demand Forecast (fiscal years 2019 through 2024)
We have analyzed BC Ferries’ actual results and forecasts for PT4 as well as BC Ferries’ forecasts for PT5.
The main purpose of the analysis is to assess the reasonableness of the assumptions and forecasting
methodologies underlying BC Ferries’ forecast for PT5 and to recommend adjustments where appropriate.
The results of this analysis are to be used by the Commission in determining the price caps for each year
in PT5.
The scope the assessment includes the following key questions:
● Has BC Ferries satisfactorily explained unusual trends or variances between actual and forecasted
results?
● Can the forecasting model prepared by BC Ferries be relied upon to produce accurate reasonable
and supportive projections?
● Is the information provided by BC Ferries accurate, reasonable and supportive of the forecast for
PT5?
● Will the forecasts provided allow BC Ferries to meet their debt covenants?
The PT5 submission responds to the specific information requirements of the Coastal Ferry Act. It
contains information on the ferry services BC Ferries has provided and expects to provide in PT4 in
relation to the regulated routes for which a price cap is to be set by the Commissioner for PT5.
Our workplan has included:
● meetings with the Commissioner
● meetings with and presentations by BC Ferries management
● written questions to BC Ferries;
● review of information supporting PT4 performance and PT5 forecasts including detailed
operating expenses, revenue forecasts and traffic forecasts
● review of detailed schedules supporting the Capital Plan
● review of independent forecasts of fuel prices, interest rates, debt rating reports and other data
● review of a financial forecast model and scenario analysis
In addition, compliance work was conducted on PT4 Price Cap Reporting and Drop Trailer Operations to
support the PT4 performance work.
The assessment was led by PwC’s Capital Project & Infrastructure group and supported by Stantec who
reviewed the traffic forecasting methodology.
5Organization of the Report
This report is organized into six parts:
1. Assessment of BC Ferries PT5 Submission and Supporting Documentation
2. Assessment of Fuel Management Plan Outcomes in Performance Term Four
3. Assessment of BC Ferries’ 2019-2030 Capital Plan Submission
4. Assessment of Strategies for Enhanced Efficiency in PT5 and Beyond
5. Assessment of BC Ferries’ Traffic Demand Forecasting
6. BC Ferry Commission PT5 Price Cap Assumptions
Notice to Reader
This Report is issued by PwC for the exclusive use of the Commission in connection with its assessment of
PT5 submissions by BC Ferries.
Our work did not constitute an audit conducted in accordance with generally accepted auditing standards,
an examination of internal controls nor attestation nor review services in accordance with the standards
established by the Chartered Professional Accountants of Canada. Accordingly, we do not express an
opinion nor any other form of assurance on the financial or other information, or operating internal
controls, of BC Ferries.
PwC did not examine, compile or apply agreed upon procedures to satisfy the requirements of the
Chartered Professional Accountants of Canada to the financial information used in this Report and we
therefore are unable to express assurances on such information except where expressly stated in the
Report to form part of the scope of our work.
Further this Report does not constitute an opinion as to legal matters, including the interpretation of the
Coastal Ferry Act or any other similar matters. The economic impact of the various procurement options
is also outside the scope of PwC’s work.
Our work is based primarily on the information and assumptions listed in the body of this Report. While
we read information from various sources we did not perform checking or verification procedures except
where expressly stated in the Report to form part of the scope of our work. Our work and commentary is
subject to assumptions, which may change with the benefit of further detailed information. We make
norepresentation regarding the sufficiency of our work and had we been asked to perform additional
work, additional matters may have come to our attention that would have been reported to the
Commission.
Some of the documents and figures we reviewed were produced by third parties. We did not corroborate
or verify these documents and figures with these parties. It is outside the scope of our review to evaluate
the methodology used to conduct independent studies; therefore, we have accepted the information as
presented, including conclusions. We did review the credentials of external consultants that BC Ferries
management relied upon and that we were unfamiliar with.
The outputs of the Report are intended to provide the Commission with information to assist in informing
their decision making process pertaining to BC Ferries. PwC accepts no liability in respect of any loss,
damage or expense of whatsoever nature caused by any use the reader may choose to make of this Report,
or which is otherwise consequent upon the gaining of access to the Report by the reader.
Our Report, including its schedules must be considered in its entirety by the reader. Selecting and relying
on specific portions of the analyses, or factors considered by us in isolation may be misleading.
6Assessment of BC Ferries’ PT5
Submission and Supporting
Documentation
Part 1 of BC Ferries’ PT5 submission is the Performance Term Four Report, structured in six sections as
follows:
● Core Ferry Services
− This section provides information the core ferry service that BC Ferries has provided and
reasonably expects to provide on the designated ferry routes in PT4.
● Tariffs for Core Ferry Services
− This section provides information on the tariffs, including reservations, that BC Ferries has
charged and expects to charge on the designated ferry routes in PT4.
● Service Fees
− This section provides information on the service fees that BC Ferries has received and
reasonably expects to receive in PT4.
● Revenues from All Other Services
− This section provides information on the revenues that BC Ferries has earned and reasonably
expects to earn in PT4.
● Expenses
− This section provides information on the expenses that BC Ferries has incurred and
reasonably expects to incur in respect of the provision of service on the designated ferry
routes in PT4.
● Alternative Service Providers
− This section provides information on the actions taken by BC Ferries in the current
performance term to seek alternative service providers to provide ferry transportation
services on one or more of the designated ferry routes where so ordered by the
Commissioner.
Our assessment of this section has focused on the review of BC Ferries’ financial forecasts for the balance
of PT4 based on traffic forecasts.
7Historical Traffic Trends
Following years of decline in traffic, both passenger and vehicle traffic have seen consecutive annual
growth since F2014. Traffic in F2018 has approached historical highs.
Figure 1
Figure 2
Traffic Forecasts for the Balance of PT4
Traffic in PT4 to date has been stronger than anticipated, particularly on the major routes, peaking in
F2018. Traffic increases are due to a combination of factors, including a strong economy, a low Canadian
dollar that has encouraged tourism from the US and travel within BC and the rest of Canada, and low fuel
costs. A lowering of fare price increases for PT4 beginning in F2017 to levels less than general inflation
and fare freezes and fare reductions starting in F2018 have also contributed to traffic growth.
8Figure 3
Figure 4
BC Ferries expects growth in F2019 of 2.6% for vehicles and 1.6% for passengers and in 2020 1.7% for
both vehicles and passengers. These forecasts include the impacts of seasonality, fare, business initiatives,
and core traffic drivers. In F2019, no net impact from seasonality is expected, and the majority of traffic
growth is influenced by fares. On April 1, 2018, BC Ferries applied a fare reduction of 15% on northern
routes, the minor routes, and the major route connecting Horseshoe Bay and Langdale. Fares are
expected to remain at these levels through March 2020. BC Ferries and the Province are each contributing
to cover the cost of these fare reductions. Fares on the major routes connecting Metro Vancouver with
Vancouver Island remained unchanged from F2018 levels.
The British Columbia senior passenger discount increased from 50% to 100% for travel Monday to
Thursday on the major and minor routes. The Province will contribute an additional $20 million towards
offsetting the value of the enhance British Columbia seniors’ discount through March 2020. The fare and
seniors’ discount initiatives are contracted to be in place until March 2020.
Core traffic drivers are expected to remain positive through F2019. The British Columbia and Canadian
economies and tourism are expected to continue to grow in F2019, though at lower levels than
experienced in F2017 and F2018.
The forecast traffic growth for F2020 is 1.7% over F2019. Seasonality will have some impact, but the
majority of this growth is driven by fares, business initiatives, and continued growth in core traffic
drivers.
9Seasonality in F2020 will be a positive traffic driver, given a full Easter long weekend, compared to just
half in F2019.
Fares are expected to remain at the same level as F2019. Assuming inflation in F2020 and no fare
changes, real (inflation adjusted) fare will decrease and have a positive impact on traffic. Business
initiatives related to a new website and variable pricing are expected to drive traffic volumes by offering
customers discounted fares on low demand sailings on the major routes between Vancouver Island and
Metro Vancouver.
The growth in F2019 in core traffic drivers is expected to continue at near or slightly lower levels through
F2020.
Assessment of Financial Forecasts for the Balance of PT4
In order to assess the reasonableness of the starting point for the PT5 forecasts, we have first examined
the variance analysis for the forecasts for F2018 and F2019 contained in the PT5 Submission.
The following table compares actual results in F2018 to the PT5 Submission forecast for F2019.
Figure 5
($million) Actual Submission Year Over Year
FY2018 FY2019 $ Change % Change
Revenue $ 937.3 $ 966.4 $ 29.1 3.1%
Operating Expenses 661.0 683.5 22.5 3.4%
EBITDA 276.3 282.9 6.6 2.4%
Amortization 159.9 173.5 13.6 8.5%
Net Financing Expense 55.2 58.7 3.5 6.4%
Other Expenses 1.2 0.0 -1.2 -100.0%
Net Earnings $ 60.0 $ 50.7 $ (9.3) -15.5%
Comparison of Actual F2018 Results vs. PT5 Submission F2019 Budget
Based on the PT5 submission provided by BC Ferries, the largest drivers of change between F2018 and
F2019 are as follows:
● Revenue will increase due to:
− Continuation in strong traffic - positive traffic trends have continued into the first half of
F2019 and the fare freeze along with fare initiatives are having a positive impact on both
passenger and vehicle traffic.
− Growth in ancillary revenues, mainly due to increases in catering and retail revenue as well
as expanded retail space on the Spirit of British Columbia.
These increases are partially offset by:
− Decreases in fare revenue reflecting the impact of the fare initiatives which include the fare
freeze on the major routes connecting Metro Vancouver with Vancouver Island, the 15% fare
rollback on all other routes, and the restoration of the 100% British Columbia seniors’
10discount on the major and inter-island routes. This is partly offset by provincial government
contributions for fare initiatives, growth in traffic and reservations.
● Operating expenses will increase due to:
− increases in wages and benefits, including wage rate increases, higher benefit costs mainly
resulting from the employer health tax, staffing service enhancements and additional round
trips.
− increases in diesel price and higher overall fuel consumption partly resulting from additional
round trips, partially offset by gains from diesel hedging and higher proportion of LNG
consumption.
− increase in contracted services including IT enhancements and project support.
− Maintenance costs will increase to reflect wage rate increases, higher benefit costs, variations
in vessel refit schedule and other vessel and terminal maintenance requirements offset by the
effect of savings to be realized from service level adjustments.
− Administration costs will increase as a result of increases in labour costs including the
employer health tax and other miscellaneous expenses.
● Financing expense is forecast to increase by $3.5 million in F2019, mainly due to a reduction in
interest earnings resulting from a lower cash balance, an increase in interest expense, and a
reduction in capitalized interest.
● Depreciation and amortization expenses will increase as the remainder of PT4 will have an above
average level of capital spending, with $343 million in capital expenditures planned for F2019. As a
result, depreciation and amortization expense is forecast to increase to $173.5 million in F2019.
The results in Figure 5 agree with the explanations provided by BC Ferries and appear reasonable.
The following table compares forecasted results in F2019 to the PT5 Submission forecast for F2020.
Figure 6
($million) Submission Submission Year Over Year
FY2019 FY2020 $ Change % Change
Revenue $ 966.4 $ 992.3 $ 25.9 2.7%
Operating Expenses 683.5 710.0 26.5 3.9%
EBITDA 282.9 282.3 -0.6 -0.2%
Amortization 173.5 183.2 9.7 5.6%
Net Financing Expense 58.7 62.3 3.6 6.1%
Other Expenses 0.0 0.0 0.0 0.0%
Net Earnings $ 50.7 $ 36.8 $ (13.9) -27.4%
Comparison of PT5 Submission F2019 Budget vs. PT5 Submission F2020 Budget
Based on the PT5 submission provided by BC Ferries, the largest drivers of change between F2019 and
F2020 are as follows:
● Revenue will increase due to:
− Continuation of positive economic conditions, the ongoing fare initiatives, and the new Fare
Flexibility and Digital Experience Initiative.
− Continuation of growth in ancillary revenues, driven by catering and retail revenue.
● Operating, maintenance and administration expenses will increase due to:
11− Increases in labour costs including wage rate increases and higher benefit costs resulting
from the employer health tax, and staffing additional round trips.
− Increase in costs related to business transformation initiatives enabled by major IT projects
− Increases in O&M costs due to variability in refit and maintenance activities, the
annualization of Route 28 service costs, and fleet deployment.
− Increase in other expenses, reflecting a general inflationary increase.
These increases are partly offset by:
− Decreases in fuel expense due to increase in forecast diesel prices being more than offset by
an increase in the proportion of LNG consumption following the conversion of the Spirit of
Vancouver Island to duel-fuel propulsion.
● Financing expense is forecast to increase by $3.6 million in F2020 to $62.3 million, with the
year-over-year change mainly due to an increase in interest expense from a forecast $250 million
debt issuance in support of BC Ferries’ PT5 12-Year Capital Plan.
● Depreciation and amortization expenses will increase due to $439 million in capital expenditures
planned for F2020. As a result, depreciation and amortization expense is forecast to increase to
$183.2 million in F2020.
The results in Figure 6 agree with the explanations provided by BC Ferries and appear reasonable.
Reasonableness of PT4 Expense Growth
With the high rates of unanticipated traffic growth in PT4, peaking in F2018, operating, maintenance and
administration expenses, including labour, have followed a similar growth trend relative to traffic. Fuel
costs are more dependent on commodity prices as opposed to traffic and show a different pattern.
Figure 7
Figure 8
PT4 Traffic and Expense Growth rates F2017 F2018 F2019 F2020
Vehicle Traffic 2.9% 5.0% 2.6% 1.7%
Passenger Traffic 1.7% 4.7% 1.6% 1.7%
OM&A 2.4% 7.9% 3.4% 3.9%
Fuel -2.6% 1.9% 6.1% -0.8%
Labour 4.4% 6.9% 2.5% 1.9%
12Reasonableness of Overtime
Labour costs have increased at a higher rate than traffic, primarily due to an increase in overtime to
service higher numbers of full and overloaded sailings, and the addition of extra sailings. Total round trips
in F2017 was 77,892 compared to 79,082 in F2018, a 1.5% increase.
Traffic levels have caused on-time performance challenges which increase the frequency of accumulated
sailing delays, leading to an increase in overtime. As traffic continues to grow in the remainder of PT4 and
it appears evident more sailings will be needed to meet daily traffic, extended operating days (and
therefore more overtime hours) are scheduled to help carry the additional traffic. The Company was able
to reduce unscheduled overtime in F2018 despite higher traffic growth due to a shift in growth to
scheduled overtime.
Figure 9
PT4 Actual Labour, Overtime, Overloads and Utilization F2017 F2018
Labour 4.4% 6.9%
Unscheduled Overtime 8.9% -2.1%
Scheduled Overtime 8.7% 19.3%
% Sailings Overloaded 10.3% 12.4%
Major Route Capacity Utilization 70.4% 73.8%
Minor Route Capacity Utilization 69.8% 67.4%
Other Route Capacity Utilization 51.7% 54.9%
Overall Capacity Utilization 62.0% 65.2%
Total Round Trips 1.3% 1.5%
Despite the strong correlation of increased labour costs with increased traffic and the higher overall net
earnings resulting from the traffic growth, the significant increase in scheduled and unscheduled overtime
is a potential concern, particularly as it creates a higher base on which PT5 forecasts are based. Overtime
hours increased by 88,710 or 29% from F2015 to F2018. Efforts may be required by the Company to
reduce these totals. This topic is addressed further in the last section in the discussion regarding efficiency
targets for PT5.
Figure 10
Overtime F2015 F2016 F2017 F2018
Scheduled Overtime 109,932 113,447 123,289 147,041
Unscheduled Overtime 196,433 232,647 253,415 248,034
Annual administration expenses, which represent approximately 5% of total operating expenses, have also
been increasing, Administration expenses excluding Information Technology (“IT”) have grown 2.9%,
while IT has grown approximately 10.7% in F2018. The major factors of the growth in IT administration
expenses are:
● F2017 and F2018 were marked by major project implementations for the Oracle Payroll project
and for the new booking, ticketing, and check-in system (ACE project). These two years saw
above-average use of contractors and software licensing fees associated with these rollouts.
● Commencing in F2018, IT PMO salaries and benefits were aligned to reflect the higher allocation
of resources relating to overall corporate IT project governance and guidelines.
● An increase in “Labour” and “Professional Computer & Other” expenses due to a permanent lift in
staffing and licensing fees required for the sustainment of the new information systems. The
13added ongoing labour and licensing fees were fully anticipated and were supported by the capital
project business cases.
Impact of Fare Initiatives in PT4
There are two initiatives involving fares which had an impact on forecast revenue and equity over
the course of the performance term.
1. BC Ferries’ decision to keep fares flat in F2018:
Without any additional funding, BC Ferries held the fares flat in F2018 on all traffic types
and routes except for vehicle fares on the major routes. This initiative is estimated to have
the following impact over the remainder of PT4:
Figure 11
Net Foregone Revenue from F2018 Fare Initiative ($Millions) F2018 F2019 F2020
F2018 Flat Flares $6.6 $6.6 $6.6
2. The F2019 and F2020 fare initiatives that were partly funded by the Province:
BC Ferries agreed with the Province to enact fare initiatives on April 1, 2018. These initiatives included a
fare freeze on routes 1, 2, and 30, a 15 percent fare reduction on all other routes, and a restoration of the
100 percent discount for BC seniors traveling mid-week. The overall result for BC Ferries is net foregone
revenue and equity of approximately $39 million over the final two years of the performance term ($16.7
million in F2019 and $22.3 million in F2020.
The following table shows the projected foregone fare revenue, the financial compensation from the
province (labeled “Province Contribution”), and the net impact on BC Ferries’ fare revenue and equity
(labeled “BC Ferries Contribution”) for PT4 due to these initiatives.
Figure 12
BC Ferries - Provincial Fare Foregone Fare Provincial BC Ferries
Initiatives ($Millions) Revenue Contribution Contribution
Year F2019 F2020 F2019 F2020 F2019 F2020
Routes 1, 2, 30 flat $7.5 $15.4 $3.7 $7.7 $3.7 $7.7
Thrufare 15% reduction $0.2 $0.2 $0.1 $0.1 $0.1 $0.1
Route 3 15% reduction $7.6 $8.6 $3.8 $4.3 $3.8 $4.3
Minors & North 15% reduction $18.2 $20.4 $9.1 $10.2 $9.1 $10.2
Subtotal $33.5 $44.6 $16.7 $22.3 $16.7 $22.3
Seniors $9.8 $10.2 $9.8 $10.2 - -
Total $43.3 $54.8 $26.5 $32.5 $16.7 $22.3
14The resulting net impact to BC Ferries’ total revenue, compared to what the Company could have earned
with no fare initiatives, is as follows:
Figure 13
Foregone Revenue
($Millions) F2018 F2019 F2020 Total
2018 BC Ferries Initiatives $6.6 $6.6 $6.6 $19.8
2019/20 BC Ferries - Province Initiatives - $16.7 $22.3 $39.0
Elimination of Fuel Deferral Balance $15.7 - - -
Total Foregone Revenue $22.3 $23.3 $28.9 $58.8
PT4 Capital Expenditures
From F2015 - F2017, actual capital expenditure amounts were lower than forecasts detailed in BC Ferries’
PT4 Submission. In F2018, with the exception of new vessels, actual capital expenditure amounts were
also lower than PT4 forecasts. The large variance in F2017 related to vessel expenditures is primarily a
result of a shift in timing of vessel expenditures. $46 million dollars of duty savings related to the Salish
class vessels also contribute to this amount. Smaller variances are primarily due to deferred investments
and changes in scope.
Figure 14
Capital Expenditures F2015 F2016 F2017 F2018
$ Millions PT4 Actual ∆ PT4 Actual ∆ PT4 Actual ∆ PT4 Actual ∆
Vessel Upgrades & Modifications 60.2 43.8 (16.4) 86.2 85.8 (0.4) 90.8 71.2 (19.6) 114.3 110.1 (4.2)
Terminal Marine Structures 45.0 47.6 2.6 29.0 24.3 (4.7) 36.1 22.9 (13.2) 55.4 20.5 (34.9)
Information Technology 26.6 23.5 (3.1) 27.2 31.9 4.7 32.5 30.9 (1.6) 27.6 24.4 (3.2)
Terminal Upgrades & Equipment 6.0 9.7 3.7 9.4 10.8 1.4 17.8 12.8 (5.0) 32.1 15.7 (16.4)
New Vessels 52.9 25.2 (27.7) 45.1 28.4 (16.7) 283.1 105.9 (177.2) 19.7 81.6 61.9
Total 190.6 149.8 (40.8) 196.9 181.2 (15.7) 460.3 243.7 (216.6) 249.1 252.3 3.2
As seen in figure 15, actual capital spend compared to the PT4 Plan is lower in F2015-F2017 and projected
to be higher in F2018-F2020. Further analysis on the Capital Plan is described in a separate section.
Figure 15
15Debt Covenants
BC Ferries has two key debt covenants: a maximum debt as a percentage of total capitalization and a
minimum debt service coverage ratio (“DSCR”). The Master Trust Indenture (MTI) contains several tests
prior to incurring additional indebtedness; including ensuring that the Leverage Ratio does not exceed
85% and the DSCR is at least 1.5:1. BC Ferries is also subject to several covenants, one of which requires
debt service coverage (earnings before interest, taxes, depreciation, amortization, and rent) must be at
least 1.25 times the debt service cost, otherwise it is in default of its loan obligations and remedies must be
pursued.
As per DBRS’s rating report on BC Ferries issued January 17, 2019: “DBRS is of the view that the outlook
for the business remains favourable. However, while not expected, this view may change if the final
decision by the Commissioner regarding PT5 includes setting the target DSCR or equity-to-total
capitalization ratio at a level that represents a material erosion from current levels. A negative rating
action may be possible if the Company becomes unable to reliably maintain a DSCR of at least 2.5x.”
In PT4, BC Ferries is forecasting to achieve positive debt metrics as outlined in Figure 16. Improved
metrics are primarily due to positive operating results driving higher EBITDA and retained earnings.
Metrics were further supported by the fact that there were no new bond issues in PT4.
Figure 16
PT4 Debt Covenants F2017 F2018 F2019 F2020
Debt to Capitalization 74.8% 72.5% 70.5% 71.9%
Debt Service Coverage Ratio 3.20x 2.79x 2.74x 2.65x
Achievement of Targets in the Capital Plan and Efficiency Plan in
PT4
Separate from BC Ferries stated plans for PT4, the Commissioner’s order setting price caps for PT4
established a target of a $100 million reduction in the Capital Plan and operating efficiency gains of $4.9
million/year and productivity gains of $2 million/year.
BC Ferries’ actual cumulative capital spending since the last performance term submission in F2015 has
been tracking below the rate contemplated in the PT4 capital plan. Between F2015 and F2018, BC Ferries
spent $827 million on capital projects, which is $270 million less than the $1,097 million forecasted in the
PT4 submission. The net underspend is primarily due to:
● The deferral of projects, including the Langdale terminal development and the Fleet Maintenance
Unit site development. Deferrals on these two projects have also impacted the timelines of other
upland infrastructure projects planned for Swartz Bay and Horseshoe Bay.
● Real cost savings were achieved with the first three Salish class vessels which cost nearly $50
million less than the PT4 capital plan forecast mainly as a result of duty savings.
While deferral of spending does not incur real cost savings, deferral of projects in PT4 into PT5 and
beyond allow for better timing of capital spend to match demand. Capital projects budget should be
continuously re-evaluated with respect to future market conditions and align with demand and operating
results.
16Actual operating expenses for the duration of PT4 are higher than forecasted. This increase in operating
expenses is primarily due to a significant increase in passenger and vehicle traffic.
Figure 17
Total Expenses ($Millions) F2017 F2018 F2019 F2020
PT4 Forecast 849.6 870.0 896.3 918.0
Actual / PT5 Forecast 817.8 877.3 915.7 955.5
$Difference -31.8 7.3 19.4 37.5
The higher traffic demand has led to an increase in full and overloaded sailings and sailing delays, which
in turn has led to an increase in overtime labour costs. The majority of this increased overtime occurs in
the peak summer months on the busier major and minor routes. The increased congestion has also
contributed to a decline in on-time performance.
Figure 18
On-time Performance F2016 F2017 F2018 F2019
Actual / PT5 Forecast 90.8% 89.5% 89.0% TBD
Target 91.0% 91.0% 91.0% 91.0%
2017
The achievement of the efficiency targets do not appear to have been documented in a formal way, except
that in PT4, revenue growth has been achieved at a higher rate than expense growth, leading to higher net
earnings throughout the performance term as compared to the PT4 price cap forecasts. While the
efficiency targets are on track with the price cap, enhanced documentation in PT5 is warranted.
Figure 19
Net Earnings ($Millions) F2017 F2018 F2019 F2020
PT4 Forecast 7.7 7.7 0.1 13.8
Actual / PT5 Forecast 77.4 60.0 50.7 36.8
$Difference 69.7 52.3 50.6 23.0
Alternative Service Providers
No alternative service providers were pursued in PT4.
Price Cap Compliance
Price cap compliance during PT4 was determined based on a review of BCFS’ supporting analysis used to
calculate price cap indexes. The analysis provided was for an interim PT4 period from July 1, 2018 to
September 30, 2018. The analysis is consistent with the Commission’s Orders. In addition, key inputs for
historical revenues and traffic volumes could be accurately traced back to the general ledger and
accounting systems for the selected sample quarterly period ending September 30, 2018. BCFS appears to
be in full compliance with price caps for the PT4 period from April 1, 2016 to September 30, 2018. Based
on the provincial government Fare Initiative that resulted in reduced fares on the minor routes and a
decision by BC Ferries not to raise fares on the major routes starting in F2018, the actual fare index is well
below the price cap. A reset of the price cap for PT5 based on the actual fare index at the end of PT4 could
give consideration to foregone revenue.
17Figure 20
Drop Trailer Compliance
Drop Trailer compliance with Order 11-01 during PT4 was determined based on a review of revenues,
operating expenses, and route overhead calculations. The analysis provided was for an interim PT4 period
from July 1, 2018 to September 30, 2018. The analysis determined the ferry operator is pricing above
direct and indirect service costs. In addition, key inputs for revenues, rebates, credit notes could be
accurately traced back to the general ledger and respective invoices. Operating expenses including labor
costs were also traced back to the general ledger and payroll. Route overhead calculations were vetted
against route and service statement reports. Only minor discrepancies were found which result in only
small adjustments to indirect costs. BC Ferries appears to be in full compliance with Order 11-01 for the
PT4 period from April 1, 2016 to September 30, 2018.
Conclusions
Costs and other financial information included in the PT5 Submission are reasonable and BC Ferries has
satisfactorily explained unusual trends or variances between actual and forecasted results. The forecasted
results for the end of PT4 are appropriate for forecasting of PT5 results.
18Assessment of Fuel
Management Plan Outcomes in
Performance Term Four
BC Ferries is required to provide a report on the outcomes of their fuel management plan as part of their
submission for PT5.
Its report is divided into three sections:
● Section 1 focuses on fuel consumption management at BC Ferries and explains the key drivers of
fuel consumption and the impact that increased traffic has had on fuel consumption since March,
2016.
● Section 2 provides an update on the significant progress the Company has made, and continues to
make, in its planned transition to alternative fuels.
● Section 3 focuses on the Company’s continued actions to manage the price it pays for fuel.
Fuel is BC Ferries second largest expense and is subject to a fuel management program that aims to
minimize cost and consumption. Two types of fuel are consumed: diesel and LNG. A cable ferry has also
been introduced that relies on diesel.
Fuel consumption is generally very predictable and is influenced by service or round trips provided, the
type of fuel, and the speed of travel. Fuel needs per AEQ have been lessening over time with the
introduction of more efficient engines and ship designs that are also reducing emissions.
In PT4, higher traffic has resulted in more sailings and higher fuel consumption. However, overall fuel
expense has declined, due to a reduction in fuel prices and the shift to cleaner and lower-cost alternative
fuels.
Fuel Consumption
Figure 21
19Figure 22
Figure 23
PT4 Fuel Consumption F2017 F2018 F2019 F2020
Diesel (Litres) 119.4 118.2 106.8 97.4
LNG (DLEs) - 2.0 14.9 27.1
Total Litres 119.4 120.2 121.7 124.5
Fuel consumption per AEQ carried has improved with more traffic and fuel efficiency initiatives. Fuel
consumption per AEQ improved 3.7% over the F2016 - F2018 period.
Figure 24
Diesel fuel prices declined in the F2013 - F2018 period, before increasing in F2019. LNG prices have
increased since they were introduced in F2018.
Figure 25
Average Fuel Price F2013 F2014 F2015 F2016 F2017 F2018 F2019 F2020
Diesel (Litres) $1.04 $1.08 $1.05 $0.89 $0.85 $0.86 $0.96 $0.97
LNG (DLEs) - - - - - $0.45 $0.48 $0.49
20Fuel Management
Fuel management has translated into fuel savings. BC Ferries estimate that fuel savings from the
introduction of three Salish class vessels and engine conversions of two Spirit class vessels total $17.1
million.
Figure 26
PT4 fuel savings
Initiative Timing
($ millions)
The first Salish arrived in BC January
Three new Salish Class Ferries 2017, the second in March 2017, and the $8.9
third in June 2017
MLU for the Spirit of Vancouver Island:
Sept 2018 - May 2019
Engine conversions of the Spirit Class
$8.2
vessels
MLU for the Spirit of British Columbia:
Sept 2017 - May 2018
BC Ferries has implemented a Clean Technology Adoption Plan that will see more new vessels that are
fueled by diesel and by electricity. While the designs of new vessels will allow for full conversion to
electric power, there are no timelines specified for the introduction of electric-powered vessels.
Fuel Deferral Program
BC Ferries has been in compliance with the fuel deferral program. As of the date of the review, there were
no surcharges in place.
Figure 27
PT4 Fuel Deferral F2017 F2018 F2019 F2020
Opening Balance -$6.13 $4.45 -$0.24 $4.46
Fuel Price Variance to Set Price -$7.63 -$8.63 $0.70 $0.00
Rebates $18.07 $19.39 $4.50 $0.00
Government $0.14 $0.29 -$0.50 $0.00
Other Adjustments $0.00 -$15.74 $0.00 -$4.46
Ending Balance $4.45 -$0.24 $4.46 $0.00
BC Ferries has an active hedging program in place for diesel but not LNG. BC Ferries started shifting fuel
consumption towards LNG in F2018. Due to the relatively recent shift towards this commodity BC Ferries
has not yet started a hedging program for LNG. Compared to diesel, LNG also has a lower proportion of
total costs that can be hedged. As it becomes a larger share of total fuel costs, hedging may be beneficial.
Figure 28
PT4 Set Fuel Price F2017 F2018 F2019 F2020
Diesel (per Litre) $0.915 $0.933 $0.952 $0.971
LNG (per DLE) $0.464 $0.473 $0.483 $0.492
21Figure 29
Conclusions
PT4 fuel management goals and initiatives have been largely met. Fuel consumption is relatively flat, with
decreased diesel consumption and increased LNG consumption. Improved fuel efficiency is reflected in
the lower fuel consumption per AEQ, based on higher traffic and the introduction of LNG-powered
vessels. Hedging of gas prices would reduce commodity risk associated with LNG prices and should be
considered. In addition, accelerated conversion to electric vessels would further reduce fuel costs.
22Assessment of BC Ferries’ 2019-2030
Capital Plan Submission
Introduction
PwC has assessed the BC Ferries’ 2019-2030 Capital Plan Submission to the Commission pursuant to
Section 64.1 of the Coastal Ferry Act (the “Capital Plan”). The review of the Capital Plan has occurred in
two stages. The first stage involved a review of an initial plan for public release submitted on September
28, 2018 from which a number of questions and additional analysis were requested of BC Ferries. These
were reviewed in a second stage.
As part of the review we have conducted the following:
● Reviewed requirements of Section 64.1;
● Reviewed Capital Plan Submission requirements and sample submissions in a number of
regulated industries including those regulated under price cap systems;
● Discussed the Capital Plan with the Commissioner;
● Reviewed the Capital Plan and the Schedule of Projects (including the public and non-public
versions);
● Compared the Schedule of Projects to the content and format of the previous 12-year Capital Plan
developed by BC Ferries; and
● Reviewed supplemental analyses developed by BC Ferries.
Capital Plan Summary
Figure 30
● The Capital Plan Submission is based on the current Coastal Ferry Services Contract with the
Province of BC for the delivery of ferry services on coastal routes. On this basis it contemplates no
changes in the contract in terms of the number or regulated routes and levels of service.
● The Capital Plan covers the F2019-F2030 period: the last 2 years of PT4, PT5, PT6, and the first 2
years of PT7.
● The Capital Plan includes: the introduction of 17 vessels with 13 vessels retiring; the replacement
and/or upgrade of the Horseshoe Bay Terminal, Swartz Bay Terminal, and Langdale terminal; 2
berth replacements/rebuilds; and IT projects.
23● The estimated total costs of the Capital Plan are in excess of $3.9 billion over the next 12 years.
Capital projects are categorized between Major (61%), Significant (5%) and Other (34%). Major
projects are as defined by the thresholds described in the Commission Order 19-03. Significant
projects fall below the thresholds but are considered important. Other projects include a large
number of projects of a lesser magnitude.
● Generally vessel replacements and mid-life upgrades are based on asset management plans that
require replacement/betterment or compliance with regulatory requirements.
● The Capital Plan identifies standardization as a corporate-wide objective with asset replacements.
● Other types of investments for terminals and IT are based on internal payback, expansion and
changing business requirements.
● Corporate initiatives also influence the nature of investments. Significant trends include the
desire for asset standardization, a move towards LNG as a cheaper source of fuel, and a Customer
Experience Modernization Initiative.
● Capital projects are to be planned within BC Ferries’ Master Planning Framework. Condition
reports and risk classifications also affect the timing of projects and the degree of corporate
oversight.
Approach to the Capital Cost Estimates
BC Ferries’ approach to cost estimates varies by time to implementation and by asset category. Most
projects listed in the capital plan fall into the charter stage. Projects at this point will have relatively low
scope and budget definition compared to projects in the implementation phase. Project charters are
reviewed and updated annually, with updates informed by market conditions and evolving priorities and
plans of the Company. Closer to implementation, most projects are activated through a
pre-implementation request, which releases a small amount of funds relative to the overall project budget
to assess options and better define the scope of the project. The effort spent in this pre-implementation
phase helps inform a more detailed project scope and budget for the business case stage.
Vessels
● Charter budget: New vessel construction costs consist of the shipyard contract and BC Ferries’
internal costs including project management, travel, vessel load out, testing, regulatory
obligations, third party consultants, and other administration expenses. The shipyard portion is
estimated using a mix of recent projects and market studies, and BC Ferries’ internal costs are
estimated using past project experience. Existing vessel projects consist primarily of scheduled
lifecycle upgrades (quarter, half, and three-quarter life upgrades). High-level scope requirements
are identified by vessel teams and budget placeholders are developed based on past project
experience.
● Business case budget: For new vessels, charter or pre-implementation budgets are refined based
on market intelligence, including market reports from standard industry publications, third-party
brokerage research reports, or direct shipyard estimates (either from a request for expression of
interest or a pre-contract request for proposal). Internal costs are refined using any new
information available, such as anticipated vessel crew levels, location of the shipyard, and
expected size of the project team. For existing vessels, a detailed project scope is created by the
project manager with input from the vessel’s engineering superintendent and shipboard
management, as well as other stakeholders. The budget is then developed bottom-up with cost
estimates broken down to the scope-item level.
24Terminals
● Charter budget: Terminal charters are included in the capital plan based either on an asset
condition assessment or a desired improvement from the business. Charters include high-level
scope development, costing, and phasing, which is developed internally by the project manager
for most projects, and with the input of a design or cost consultant for larger projects. The scope
at this stage is high level, describing broad infrastructure elements expected to meet the business
need.
● Business case budget: Significant work is done for projects at the business case stage to clearly
define the scope of the project, including preliminary engineering design. Budgets are typically
developed bottom-up with input from a design consultant.
Information Technology
● Charter budget: Most charter-stage projects assign scope based on an expected product lifecycle,
spanning from initial installation, to minor upgrade, and then to major upgrade or replacement.
Budgets attached to the charter-level scope are typically top-down estimates based on similar
prior projects. Further definition and bottom-up elements are added by subject matter experts as
more is learned about the needs of the business.
● Business case budget: For projects at the business case stage, requirements have been gathered
and more is known about the planned project scope. The Project Manager develops the scope with
input from the project owner and other stakeholders. The budget is built bottom-up based on the
project plan, and is often informed by market information like a request for information or
request for proposal.
Active projects across all asset categories, including those in the pre-implementation stage and in the
implementation (post business case), are reforecast monthly. Forecasts will evolve as more detail
information is received (RFP response, contract negotiation, contract finalization, change requests, and
realization of results).
Commentary
A number of good industry practices are observed with BC Ferries’ capital planning processes. BC Ferries
have developed master plan summaries for vessels and terminals. The Company has demonstrated
appropriate procurement processes for capital projects. Project Governance Framework and Guidelines
that were updated in November, 2017 also have various control mechanisms are also imbedded within the
framework. Previous reviews including a number of S55 reviews have demonstrated that capital projects
are supported by robust business cases and appropriate governance.
A performance review of BC Ferries’ procurement practices in 2018 concluded that BC Ferries has solid
procurement policies and practices in place, with good practices identified in numerous areas and in their
ongoing continuous improvement activities. BC Ferries has a strong capital planning process that
supports proactive planning for related procurement activities to enable alignment of strategic objectives.
Additionally, a well-defined policy and governance framework supports strong consistency, risk
management and control within procurement processes, and procurement and supply chain performance
is regularly measured and reported.
The capital planning process from the first 12-year Capital Plan has improved from PT4. The submission
contains a Fleet Master Plan summary and a Terminal Network Master Plan summary that are integrated.
They address alignment of capital projects within the two master plans, a 25-year investment schedule, a
fleet overview, a long-term fleet deployment plan, fleet retirement and decommissioning and general
design standards and guidelines.
25The Fleet Master Plan summary details how the fleet will be standardized, where ships will be deployed,
when ships will be replaced, and with what type of vessel. The Fleet Master Plan summary reflects the
Company’s best available knowledge, including traffic trends and customer needs. The master plan, in
many cases, prescribes replacement plans several years in advance.
BC Ferries has refined the planning process with the creation of the Terminal Network Master Plan, with
standards for terminal development that vary by terminal category (major, minor staffed, minor
unstaffed, northern). Under this master plan, the Company has been working to create a terminal
development plan for each site, which creates a 25-year vision for how each terminal will be developed. As
a result of this process, several projects in the Capital Plan have been updated with refined cost estimates
based on more concrete scope information than what the PT4 Capital Plan included.
Analysis requested of BC Ferries
The Capital Plan primarily represents a listing of all projects and a high level description of major
projects. It is based on a “bottom up” development approach particularly as it applies to vessel and
terminal replacements. Based on the original submission, PwC asked for clarifications and further
analysis on a number of issues, including the following:
● a comparison of the actual cost and timing of all capital projects in PT4 against those contained in
the original price cap submissions.
● more detail on:
o how vessel and terminal replacements are consistent with standardization objectives and
o the impact of the Capital Plan on the average age of the fleet
● more detail on the approaches taken was requested to identify and assess projects that are not
based on regulatory or replacement/betterment. More detail was requested for projects based on
internal payback including how incremental revenues or other benefits are to be measured. Risk
mitigation approaches for these types of projects were also requested.
● more detail on how BC Ferries plans to address user interests in planning vessel and terminal
amenities.
● a description of how specific capital projects are part of Efficiency Plans.
The responses by BC Ferries to the questions are considered adequate. Further analysis is provided
below.
Capital Expenditure Performance
In order to assess capital expenditure performance, we conducted the following:
● reviewed the actual capital expenditures in PT2, PT3 and PT4 and compared these to the
respective performance term forecasts; and
● reviewed the changes in fleet age as a result of capital investments in vessels.
Actual vs Forecast Capital Expenditures
Capital expenditures in PT2 and PT3 are summarized in the following tables. Performance against the
associated 5-year Capital Plans has been adequate. Capital expenditures in PT2 were $91m lower than
26forecast in the PT2 submission, mostly due to lower costs associated with the acquisition of three Super C
vessels. Offsetting these lower costs were higher IT, terminal and other costs.
Capital expenditures in PT3 were $30m higher than forecast, mostly due to higher terminal costs.
Many of the variances are related to timing of when planned projects are implemented and when
expenditures are booked for accounting purposes. There was also a delayed effect with duty remissions
for the C class vessels and the Northern Expedition.
Based on discussions with BC Ferries management and the experience with S55 Applications, most vessel
projects have come in on or under budget. Greater variances appear to have existed with some of the
terminal and IT projects.
Figure 31 - PT2 Capital Expenditures ($ millions)
PT2 CAPEX ($million) Forecast Actual Difference
Vessel 680.8 543.2 137.6
Terminal 163.0 187.4 (24.4)
FMU & Other 2.5 11.0 (8.5)
IT 11.3 58.7 (47.4)
General Allowance 60.0 (1.0) 61.0
Total 917.6 799.3 118.3
Figure 32 - PT3 Capital Expenditures ($ millions)
PT3 CAPEX ($million) Forecast Actual Difference
Vessel 110.4 110.7 (0.3)
Terminal 32.5 72.4 (39.9)
FMU & Other 50.5 39.9 10.6
IT 3.2 3.7 (0.5)
Total 196.6 226.7 (30.1)
The predictability of the cost and timing of projects lessens the further out in time within the Capital Plan.
The differences in the forecasts for PT4 and PT5 between the PT4 Submission and the PT5 Submission are
shown in the following tables.
Figure 33 - PT4 Capital Expenditures ($ millions)
Actual/Submission
PT4 CAPEX ($million) PT4 Forecast Forecast Difference
Vessel 845.7 830.0 15.7
Terminal 257.5 151.9 105.6
FMU & Other 57.2 144.9 (87.7)
IT 104.4 151.3 (46.9)
Total 1,264.8 1,278.1 (13.3)
27Figure 34 - PT5 Capital Expenditures ($ millions)
PT5 CAPEX ($million) PT4 Submission PT5 Submission Difference
Forecast for PT5 Forecast for PT5
Vessel 744.6 1,025.3 (280.7)
Terminal 328.7 371.6 (42.9)
FMU & Other 14.8 84.2 (69.4)
IT 70.6 60.4 10.2
Total 1,158.7 1,541.5 (382.8)
Time horizons
The PT4 capital plan covered the 12-year period between F2015 and F2026, and the PT5 capital plan
covers the period between F2019 and F2030, meaning there are eight common years between the two
plans covering F2019 to F2026.
Figure 35 below shows the actual and forecast spend for the eight common years, and the four years
specific only to the PT5 plan.
Figure 35
New Vessels
The increase from the PT4 plan to the PT5 plan is more than fully explained by the major vessels in the
plan. The PT4 plan had spending to replace four major vessels in the early to mid-2020s. The PT5 plan
includes the replacement of the same four vessels, with an incremental vessel added for reasons outlined
in the capital plan submission. In addition, with four years added to the plan, the PT5 plan also needs to
incorporate spending to replace the Queen of Oak Bay and Queen of Surrey, which are scheduled to retire
in the early 2030s.
The PT5 plan introduces a total 17 new vessels, and sees 13 vessels retire within the 12 year period from
F2019-F2030.
28You can also read