ASSESSMENT OF DSR PRICE SIGNALS - December 2011
←
→
Page content transcription
If your browser does not render page correctly, please read the page content below
SCENARIO SCOPING FOR DSR PRICE SIGNALS PROJECT

                                                 December 2011
                                                                 ASSESSMENT OF DSR PRICE SIGNALS
ASSESSMENT OF DSR PRICE SIGNALS

 Contact details

 Name                        Email                                            Telephone
 Mike Wilks                  Mike.wilks@poyry.com                             01865 812251

Pöyry Management Consulting is Europe's leading management consultancy specialised in the
energy sector, providing strategic, commercial, regulatory and policy advice to Europe's energy
markets. The team of over 200 energy specialists, located across 14 European offices, offers
unparalleled expertise in the rapidly changing energy sector.
Pöyry is a global consulting and engineering firm. Our in-depth expertise extends to the fields of
energy, industry, urban & mobility and water & environment, with over 7,000 staff operating from
offices in 50 countries.

                   Copyright © 2011 Pöyry Management Consulting (UK) Ltd
                                          All rights reserved

Unless prior written consent has been provided, this report is provided to the legal entity identified
on the front cover for its internal use only.

No part of this publication may be reproduced, stored in a retrieval system or transmitted in any
form or by any means electronic, mechanical, photocopying, recording or otherwise without the
prior written permission of Pöyry Management Consulting (UK) Ltd.

Should you wish to share this report for a particular project with an affiliate, shareholder or another
party, prior written permission is required for which there may be an additional fee.
                                              Important
This document contains confidential and commercially sensitive information. Should any
requests for disclosure of information contained in this document be received (whether
pursuant to; the Freedom of Information Act 2000, the Freedom of Information Act 2003
(Ireland), the Freedom of Information Act 2000 (Northern Ireland), or otherwise), we request
that we be notified in writing of the details of such request and that we be consulted and
our comments taken into account before any action is taken.

                                             Disclaimer

While Pöyry Management Consulting (UK) Ltd (“Pöyry”) considers that the information and
opinions given in this work are sound, all parties must rely upon their own skill and judgement
when making use of it. Pöyry does not make any representation or warranty, expressed or
implied, as to the accuracy or completeness of the information contained in this report and
assumes no responsibility for the accuracy or completeness of such information. Pöyry will not
assume any liability to anyone for any loss or damage arising out of the provision of this report.

PÖYRY MANAGEMENT CONSULTING                                                                 December 2011
                                                                       717_DSR Price signals_Report_v1_0.docx
ASSESSMENT OF DSR PRICE SIGNALS

                               TABLE OF CONTENTS

EXECUTIVE SUMMARY                                                                                    1

1.   INTRODUCTION                                                                                    6
     1.1    Background                                                                               6
     1.2    Scope of analysis and key assumptions                                                    7
     1.3    Structure of this report                                                                 7

2.   CONTEXT OF THE ASSESSMENT                                                                       8
     2.1    The GB electricity market in 2030 and beyond                                             8
     2.2    Context of the study                                                                   10

3.   BASIS OF OUR ASSESSMENT                                                                       14
     3.1    Bounding the problem                                                                   14
     3.2    Identifying value drivers of different stakeholders                                    15
     3.3    Summary of the scenarios defined                                                       18

4.   RESULTS OF OUR ASSESSMENT                                                                     26
     4.1    Summary of results                                                                     26
     4.2    Shaving peak demand to avoid network investment                                        27
     4.3    Boost peak demand to accommodate wind and optimise prices                              37
     4.4    Modify demand to accommodate low wind period                                           39
     4.5    Modify demand to compensate for a generation trip                                      41
     4.6    Modify demand to compensate for a network constraint                                   46
     4.7    Modify demand to compensate for a distribution network fault                           47
     4.8    Modify demand to cope with volatile demand net wind profile                            47
     4.9    Conclusions                                                                            49

ANNEX A – MODELLING DEMAND SIDE RESPONSE                                                           53

ANNEX B – DISTRIBUTION DEMAND PROFILES                                                             57

ANNEX C – PATHWAY ALPHA AND ASSOCIATED ASSUMPTIONS                                                 65
     C.1    Generation mix                                                                         65
     C.2    Structure of demand                                                                    66
     C.3    Network assumptions                                                                    72

PÖYRY MANAGEMENT CONSULTING                                                            December 2011
                                                                  717_DSR Price signals_Report_v1_0.docx
ASSESSMENT OF DSR PRICE SIGNALS

                          [This page is intentionally blank]

PÖYRY MANAGEMENT CONSULTING                                                         December 2011
                                                               717_DSR Price signals_Report_v1_0.docx
ASSESSMENT OF DSR PRICE SIGNALS

                             EXECUTIVE SUMMARY
In 2010, Pöyry Management Consulting (UK) Ltd. (hereafter ‘Pöyry’) conducted work for
DECC to understand the potential role of demand side response (‘DSR’) in helping deliver
a secure and economic decarbonised energy sector by 2050. Pöyry has been jointly
commissioned by Electricity North West Ltd (‘ENW’) and National Grid to use this work to
explore further the interactions of potential DSR use by ENW (as a DNO), National Grid
(as TSO) and suppliers – as different key end users – and to examine relative strengths of
DSR price signals that each might be able to provide to the market.

Context

The expectation is that a decarbonised generation sector will lead to the GB market
containing large amounts of low marginal cost generation; much of this will be in the form
of wind, which is also intermittent. Concurrent with the decarbonisation of electricity
generation, further electrification of the heat and transport sectors is expected, particularly
from the late 2020s onwards, in support of the 2050 emissions target. This will provide
challenges for matching generation to the profile of demand; heat demand will be more
variable than the existing electricity demand.

The delivery of a low-carbon generation sector represents a departure from the status
quo, which can be crudely characterised as a market dominated by load-following
generation, a relatively predictable pattern of demand and limited opportunity for demand-
shifting. The implications of moving to a low-carbon energy system are that:
    the electricity generation sector could become more inflexible, which places a greater
    premium on having load that can follow generation;
    electricity demand could be more variable and more peaky, which increases the
    benefits of shifting load away from peak periods; and
    electricity demand may have much greater potential for flexibility through the storage
    associated with heat and transport.

Therefore, there would be clear benefits from the implementation of demand-side flexibility
i.e. demand side response (DSR) in helping to deliver a low-carbon, affordable and secure
electricity supply.

Defining the problem

In the use of DSR, there are various stakeholders and different dimensions to its use.
Furthermore depending on prevailing circumstances in the market and on the networks,
stakeholder interest in DSR and their use of it may coincide or conflict. We were asked to:
    provide an understanding of when the key end users of DSR (TSO, DNO and
    supplier) will be in tandem or in conflict; and
    present an initial quantification of the value associated with various uses of DSR.

Given the large number of specific situations and uses of DSR, we sought to capture
these via an assessment of a number of specific, self-contained representative scenarios.
The aim was to provide a representation of the full range of possible situations which
might theoretically arise; the scenarios are summarised in Table 1. These were devised
bearing in mind the need to quantify the relative value to each of the interested parties.

PÖYRY MANAGEMENT CONSULTING                                                              December 2011
                                                                     717_DSR Price signals_Report_v1_0.docx

                                                                                                         1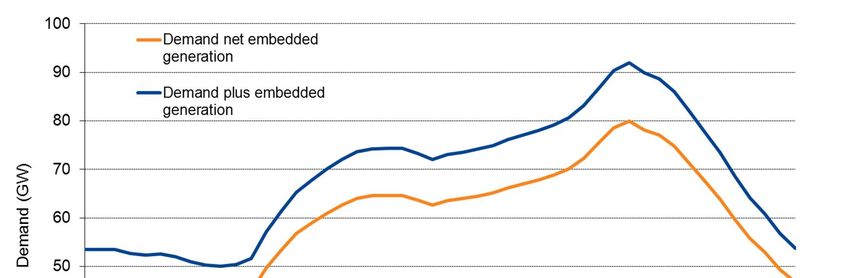
ASSESSMENT OF DSR PRICE SIGNALS

 Table 1 – Summary of the scenarios defined by Pöyry

                        Scenario                                                  Situation
   Shaving peak demand to avoid network investment
     Case A                                              Demand is shifted at the national level and has an adverse
                                                         affect on the local network
      Case B
                                                         Both Grid and DNO want to shift demand at the same peak

   Boost peak demand to accommodate wind and
   optimise prices
      Case C
                                                         Suppliers drive price optimisation through the use of DSR

      Case D                                             DSR is used to avoid wind curtailment

   Modify demand to accommodate low wind period
     Case E                                              DSR is used to avoid the costs associated with alternative
                                                         solutions to the problem

   Modify demand to compensate for a generation trip
     Case F                                              DSR is used instead of ancilliary services
     Case G                                              DSR is used to balance the system

   Modify demand to compensate for a transmission
   constraint
     Case H                                              Use DSR to avoid bringing on another generator to meet
                                                         demand

   Modify demand to compensate for a distribution
   network fault
      Case I                                             Use DSR to avoid bringing on another generator to meet
                                                         demand

   Modify demand to cope with volatile demand net wind
   profile
      Case J                                             DSR is used to mitigate forecast error and wind volatility

Implementing the method

Using results from modelling work previous undertaken by Pöyry for DECC on their
Pathway Scenario Alpha for 2030, and the potential role(s) of DSR, we analysed how
often different situations, as represented by the scenarios above, could arise and the
impact that DSR would have on them. This was done to quantify the value associated
with the use of DSR to the three different key end users of DSR – suppliers, transmission
network owner/operators and distribution network owners. We used the scenarios to both
analyse the price signals that will emerge in various situations and understand the
potential implications for interactions in targeted use of DSR by the three key end users.

Key assumptions

In conducting this assessment we have made three key assumptions:
    DECC’s Pathways Scenario Alpha is used for key market assumptions in 2030;
    DSR is provided on a voluntary basis driven by commercial signals from end users;
    and
    DSR providers act rationally in response to commercial signals i.e. they are reliable
    and take the highest price.

PÖYRY MANAGEMENT CONSULTING                                                                               December 2011
                                                                                      717_DSR Price signals_Report_v1_0.docx

                                                                                                                          2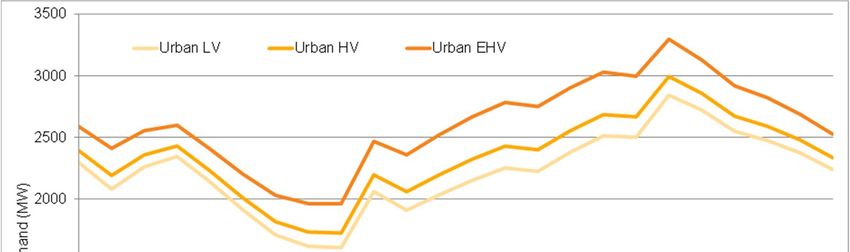
ASSESSMENT OF DSR PRICE SIGNALS

Furthermore we do not investigate the reduction of network asset ratings arising from
flatter demand profiles and its impact on asset load cycles (and thus thermal stress).

Assessing the results

The relationship between different stakeholders and their use of DSR is complex – for
example, suppliers are interested in energy (MWh) DSR services; whereas DNOs and the
TSO are interested in capacity (MW) DSR services. These differences present varied
value propositions and natures of use to DSR providers.

However, the pattern that emerged from the analysis is that the price signals given by the
DNO will be far weaker than those given by other interested parties. The DNO probably
won’t be able to give the signals that it needs to attract DSR providers except in post-fault
situations where spot value of DSR to the DNO would be very high. By contrast the TSO
and suppliers should be able to give the desired price signals far more readily given the
scale of potential benefits via, for example, asset investment avoidance and operational
cost reductions.

This ordering was also reflected in the benefits received by individual parties. Firstly, the
supplier often has the most value as it gains on a frequent basis from wholesale price
savings and from passing on the cost of incorporating wind generation onto its customers.
The TSO follows as its investments are relatively large and infrequent; it is under certain
operational obligations which drive sometimes high value for DSR. The DNO is lowest in
the value chain, given the locality and lower scale typically of its requirements for DSR;
and thus associated asset costs and operational savings. A summary of the findings can
be found in Figure 2.

PÖYRY MANAGEMENT CONSULTING                                                             December 2011
                                                                    717_DSR Price signals_Report_v1_0.docx

                                                                                                        3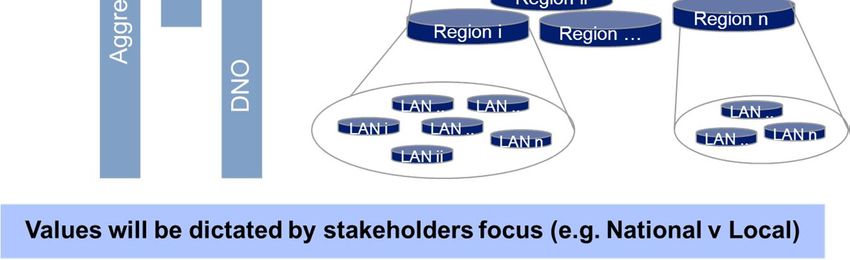
ASSESSMENT OF DSR PRICE SIGNALS

 Figure 2 – Scale of value of DSR to the users across the scenarios, thus reflecting
            the rate payable to provider (1 = highest value, 4 = lowest value)

                       Scenario                          DNO           TSO            Supplier
   Shaving peak demand to avoid network investment
     Case A                                               4              -                 -
     Case B                                               3              1                 2

   Boost peak demand to accommodate wind and
   optimise prices
      Case C                                              3              2                 1
      Case D                                              3              2                 2

   Modify demand to accommodate low wind period
     Case E                                               -              3                 1

   Modify demand to compensate for a generation trip
     Case F                                               -              1                 2
     Case G                                               -              1                 2

   Modify demand to compensate for a transmission
   constraint
     Case H                                               -              1                 -

   Modify demand to compensate for a distribution
   network fault
      Case I                                              1              -                 -

   Modify demand to cope with volatile demand net wind
   profile
      Case J                                              -              1                 2

In addition, a few other key observations can be drawn from this work and the previous
work undertaken for DECC.
    There is clear potential for overspending. In the first case, this may happen when
    DSR is contracted by two or more different parties – duplicating in part at least
    necessary payment for a DSR action. A different inefficiency can arise when the
    action to dispatch DSR minimises the costs for one stakeholder but results in
    additional costs for another. For example, when DSR is used to minimise demand at
    the national level it can cause demand on the distribution network to exceed the
    capacity limit and trigger need for local DSR previously not required.
    In many cases for both transmission and distribution networks’ deployment of DSR
    will defer but not avoid asset investment (given dramatically increasing underlying
    electricity demand under decarbonisation of energy as for example assumed in
    DECC’s Pathway Scenario Alpha). Thus in many cases DSR can be used as an
    interim measure operationally to allow time for network investments to be made.
    However, it can only be sustained in situations where the scale of DSR required is
    reasonable in its impact on DSR providing consumers. DSR can only be relied on
    and sustained when the impact on consumer activities is both viable and acceptable
    to them.
    More generally, it is only reasonable to anticipate up to a certain scale of accessible
    DSR given the increasing impact on consumer activities and inconvenience. As they

PÖYRY MANAGEMENT CONSULTING                                                             December 2011
                                                                    717_DSR Price signals_Report_v1_0.docx

                                                                                                        4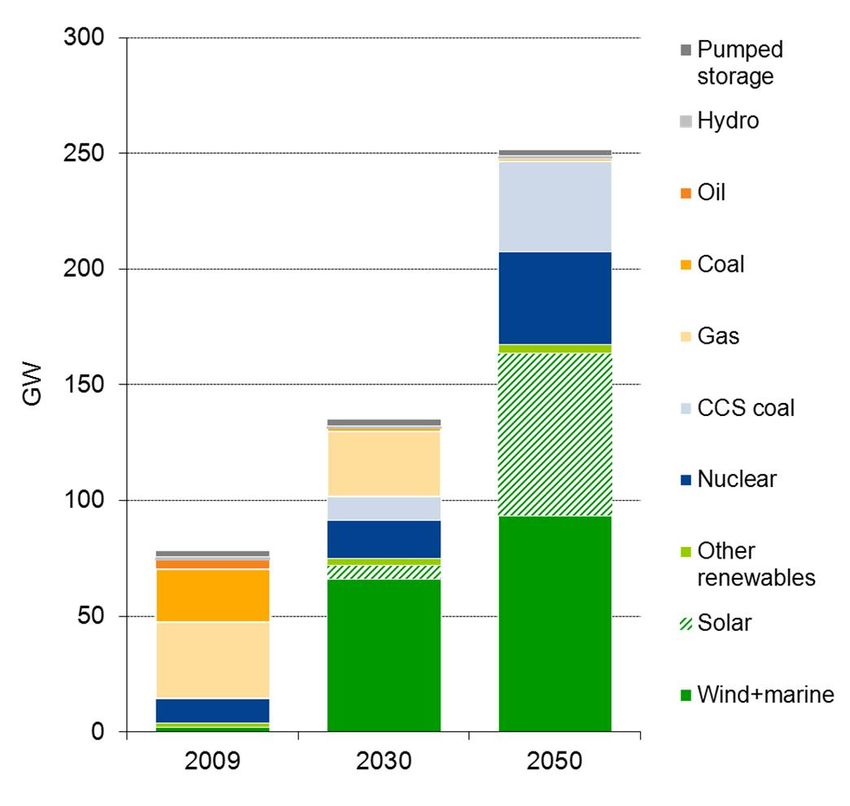
ASSESSMENT OF DSR PRICE SIGNALS

    face increased limitations/restrictions on their use of demand where higher levels and
    regularity of DSR delivery are sought, there will be competition for its use.
    For networks, there is most potential value for DSR to be used for events that are
    high in price but low in volume e.g. in post fault situations. However, such activities
    are either relatively rare (such as network outages) versus required availability
    commitment; or require prolonged use of DSR (such as generation trips). In these
    cases it is likely that while some role may be available for DSR over short timescales,
    dependent on commercial and physical commitments required. Given the overall £
    value of competing services from suppliers in the longer term, DSR providers may
    prefer other service options. Furthermore, these operational situations require
    complete reliability of DSR provision when called upon to ensure suitable security of
    supply and to enable the TSO and DNO to realise the benefits of avoided asset
    investments and/or service costs.

Thus we make the following conclusions:

1. Some form of common platform and process should be put in place to enable effective
   coordination and efficient use of DSR by different key end users. This is necessary to
   ensure that there is minimal wastage and maximised cost effectiveness.

2. For DSR services of highest value to networks, the requirements for reliability and the
   consequences of failure to deliver are such that commercial signals may well need to
   be reinforced or augmented by mandatory/enforced approaches which ensure the full
   benefits of DSR can be realised without risk to security of supply.

3. Where there is insufficient cross-stakeholder coordination in place and the dispatch of
   DSR purely comes down to price signals, the DNO will suffer the most as:
        DNO price signals will be swamped by those from other stakeholders;
        at the same time, the responsive demand lies on the distribution network; and
        thus it is the DNO that will face network capacity related problems when DSR is
        used to meet the objectives of other stakeholders.

PÖYRY MANAGEMENT CONSULTING                                                           December 2011
                                                                  717_DSR Price signals_Report_v1_0.docx

                                                                                                      5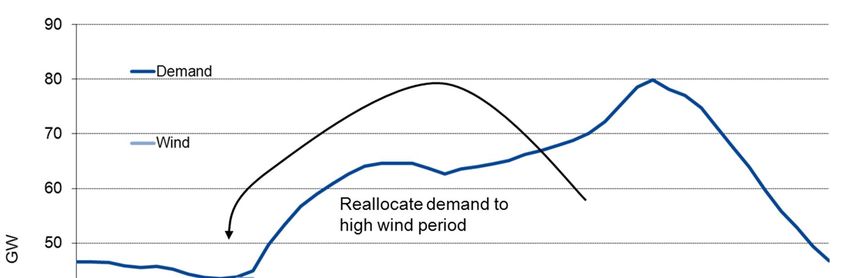
ASSESSMENT OF DSR PRICE SIGNALS

                               1.       INTRODUCTION
1.1       Background
We were asked to provide a report to Electricity North West Ltd (‘ENW’) which gave: "an
initial indication of whether the strength of price signal we might be able to provide to a
market where the distribution network is at risk would be strong enough to over-ride
signals from Grid and suppliers”. Subsequently ENW approached National Grid to
participate in a joint study looking at the uses and interaction of DSR in general. Together
we defined the following project objective:
         “based on high level analysis, (i) provide an understanding of when the key end
         users of DSR (TSO, DNO and supplier) will be in tandem or in conflict; and (ii)
         present an initial quantification of the value associated with various uses of DSR.”

We adopted a two phase approach (which we describe below) for project delivery and
agreed to use the following principles:

      Use DECC Pathways Alpha 2030 as the scenario baseline;
      The analysis and conclusions would be relatively high level and focus on drawing out
      key messages; and
      We would build on previous work completed for DECC on the optimal use of DSR to
      evaluate investments in the distribution and transmission networks.

       1.1.1    Phase 1 of assessment

In Phase 1 we set out and explained the different drivers for the use of DSR and the
needs for it from each of the different parties - DNO, Supplier and TSO. We then derived
snapshot examples to illustrate a representative set of potential scenarios, highlighting the
interaction of the potential use of DSR by the different parties.

       1.1.2    Phase 2 of assessment

Based on Phase 1; we assessed the benefits for each different application of DSR by
each different party, based on high level assessment of avoided costs and/or revenue
obtained for each of the scenarios defined in Phase 1. This enabled us to understand the
magnitude of relevant price signals that would be sent by stakeholders to use DSR.

       1.1.3    Project deliverable

As indicated above, it was agreed with ENW/National Grid that the end deliverable for the
work conducted under Phase 1 and 2 is this report, which provides a full discussion of the
assessment and findings. Thus this report encompasses the following key components:
      Identify the different values that each stakeholder has for the use of DSR;
      Derive scenarios that show when actions by stakeholders to use DSR are in conflict
      or in concert (by producing a set of scenarios to assess);
      From the above two points assess the financial drivers of signals that each party
      might give to a specific regional market;Summarise the overall relative strength of
      price signals from each generic party in each scenario and the combined effect; and
      Identify key headline messages from our assessment regarding the effective future
      deployment of DSR.

PÖYRY MANAGEMENT CONSULTING                                                             December 2011
                                                                    717_DSR Price signals_Report_v1_0.docx

                                                                                                        6
ASSESSMENT OF DSR PRICE SIGNALS
1.2 Scope of analysis and key assumptions
To reinforce the agreed scope and high level nature of analysis, the following are key
assumptions:
We have used DECC’s Pathways Scenario Alpha for underlying market assumptions
for 2030 and 2050;
DSR is provided on a voluntary basis driven by commercial signals from end users ie.
there is no mandatory enforcement of DSR provision e.g. for security of supply
reasons;
DSR providers act rationally in response to commercial signals such that (i) if the
price is right they will respond i.e. it is reliable; and (ii) where there is competing
buyers they will provide DSR to the highest ’bidder’.
Consumers behave in a compliant manner to the needs of smart grids.
Furthermore there are issues for assessments which we recognise as needing exploration
but which lie outside the scope of this analysis;
We do not investigate the reduction of network asset ratings arising from flatter
demand profiles and its impact on asset load cycles (and thus thermal stress);
No costs of implementation of smart energy are taken into account;
No changes to regulation are assessed; and
We do not assess detailed pricing methodologies for different stakeholders.
1.3 Structure of this report
This report is broken down into three further Chapters.
In Chapter 2 we provide the background to this study by presenting an overview of
the market context for 2030 and 2050 as provided by DECC’s Pathway Scenario Alpha.
This scenario originally triggered the consideration by DECC of how DSR might help
deliver UK decarbonisation objectives securely and economically for which Pöyry
undertook analysis1, and is used as the starting point for the assessment undertaken in
this report.
In Chapter 3 we present our approach to answering the project objective. Therefore
we firstly bound the problem and explain its key dimensions. Once these have been
established, we describe the value drivers for each of the stakeholders. Once we have
these two sets of information we then introduce scenarios in which DSR will be used by
one or more of the stakeholders and also define potential conflicts that may arise.
Therefore much of Chapter 2 is reporting the results of Phase 1 of the assessment.
In Chapter 4 we present the results of our analysis (i.e. Phase 2 of the assessment).
Therefore take each of the Scenarios in Chapter 3 and quantify the impact that the
different uses of DSR have from each stakeholder. By comparing the different benefits
derived by each stakeholder we give insight into the price signal that could be associated
with a particular action and the relative strength of the price signals. At the end of Chapter
4 we present the conclusions from our analysis.
1
‘Demand side response: Conflict between supply and network driven optimisation’; a Pöyry
report for DECC, November 2010
PÖYRY MANAGEMENT CONSULTING December 2011
717_DSR Price signals_Report_v1_0.docx
7ASSESSMENT OF DSR PRICE SIGNALS
2. CONTEXT OF THE ASSESSMENT
The starting points for this analysis came from work previously undertaken by Pöyry for
DECC. DECC has set out six low-carbon pathways to 2050 within its 2050 Pathways
report published in July 2010. DECC’s Scenario Alpha has been used as the baseline for
this study.
The GB electricity market is expected to see some fundamental changes in the
forthcoming years to 2020 and in particular beyond into 2030 and 2050 timeframes. This
change is being driven in large part by environmental objectives set at both an EU and
national level. However both economic and technology drivers are reinforcing this and the
consequence is that the nature of generation and demand could change in ways which
will have a fundamental impact on the whole electricity sector in GB, particularly for the
wholesale market and for network investment and operation.
2.1 The GB electricity market in 2030 and beyond
The expectation is that a decarbonised generation sector will lead to the market
containing large amounts of low marginal cost generation, much of it in the form of wind,
which is also intermittent.
Concurrent with the decarbonisation of electricity generation, there is expected to be
significant electrification of the heat and transport sectors, particularly from the late 2020s
onwards, in support of the 2050 emissions target2. DECC’s Pathway Alpha assumes that
GB electricity demand more than doubles from its current levels by 2050 to around
730TWh. This could provide challenges for matching generation to the profile of demand,
particularly because heat demand is more variable than the existing electricity demand.
The delivery of a low-carbon generation sector will represent a significant departure from
the status quo, which can be crudely characterised as being a market dominated by load-
following generation with a relatively predictable pattern of demand and limited opportunity
for demand-shifting.
In contrast, the implications of a move towards a low-carbon energy system are that:
the electricity generation sector could become more inflexible, which places a greater
premium on having load that can follow generation;
electricity demand could be more variable and more peaky, which increases the
benefits of shifting load away from peak periods; and
electricity demand may have much greater potential for flexibility through the storage
associated with heat and transport.
Therefore, there would be clear benefits from the implementation of demand-side flexibility
in helping to deliver a low-carbon, affordable and secure electricity supply.
2
‘2050 Pathways Analysis’, Department of Energy and Climate Change, July 2010.
PÖYRY MANAGEMENT CONSULTING December 2011
717_DSR Price signals_Report_v1_0.docx
8ASSESSMENT OF DSR PRICE SIGNALS
Figure 3 – Comparison of demand patterns from load flattening and generation
balancing (2030 with January 2000 weather, GW)
80
Demand (GW)
60
40
20
0
24-Jan
80
Wind generation (GW)
60
40
20
0
24-Jan
80 Inflexible Flexible heat Flexible appliances Flexible EV
Demand (GW)
60
40
20
0
24-Jan
80
Demand (GW)
60
40
20 Balancing generation Flattening load
0
24-Jan 25-Jan 26-Jan 27-Jan 28-Jan 29-Jan 30-Jan
However, demand-side flexibility is one instrument trying to meet two policy objectives –
tracking generation, especially wind, in order to take maximum benefit from zero fuel cost
generation (and reduce other generation costs); and flattening load in order to minimise
network investment. At times, these policy objectives could be complementary, for
example when wind is low and demand is high. However, at other times, they could
conflict such as when wind is high and demand is high. This tension is illustrated in
Figure 3, based on analysis undertaken with our Zephyr model.
The top chart shows how the load curve can be flattened through demand shifting,
particularly with respect to heating. The second chart illustrates how the pattern of wind
generation can vary during a single week. Based on an assumed installed wind capacity
of 31GW, output rises from an extended period of being at virtually zero to reach a load
factor of nearly 100% in the latter half of the week. The third chart shows how different
types of demand can be shifted in order to balance the change in wind generation. The
PÖYRY MANAGEMENT CONSULTING December 2011
717_DSR Price signals_Report_v1_0.docx
9ASSESSMENT OF DSR PRICE SIGNALS
final chart then compares the load flattening approach with the balancing approach. It
shows that the two approaches produce similar results when the wind is low in the early
part of the week. However, a 10GW difference in demand emerges between the two
approaches in 29 January when wind output is at its peak.
This analysis highlights the potential benefits of demand side response for the wholesale
market. However, it also raises the issue that the use of demand side response in this
way could lead to the need for networks to have a higher capacity than necessary with an
associated implication for overall system costs. The capacity of GB distribution networks
may no longer able to accommodate the substantial demand created by the need to
charge electric vehicles (EVs) or meet the demands of heat pumps (HPs).
2.2 Context of the study
As we discuss above the GB electricity market is expected to see some fundamental
changes in the forthcoming years. The DECC pathways analysis (Scenario Alpha)
estimates that electricity demand could double by 2050 as a result of the electrification of
heat and transport, which is required to meet the decarbonisation targets. In Figure 4 and
Figure 5 below we show the impact of changing demand in 2009, 2030 and 20503.
Figure 4 – Changes in peak demand
140
2050 Demand
2030 Demand
120
2009 Demand
100
.
.
80
Year Peak demand Total demand
Demand (GW)
(GW) (TWh)
2050 137 730
60 2030 96 505
2009 58 314
40
20
0
100% 90% 80% 70% 60% 50% 40% 30% 20% 10%
The demand duration curves shown in Figure 4 highlight that in general peak demand
could grow at a slightly faster percentage rate than annual energy (this is quantified in the
table in Figure 4), which would lead to a number of potential problems for electricity
markets, including how to compensate generators with low load factors.
The electrification of heat and transport would lead to an increase in the variation between
the peak and minimum daily demand (assuming no use of demand side response),
3
This does not include losses (assumed at 8%) and was also calculated before DSR is applied.
PÖYRY MANAGEMENT CONSULTING December 2011
717_DSR Price signals_Report_v1_0.docx
10ASSESSMENT OF DSR PRICE SIGNALS
making it harder to plan and manage the electricity systems, as shown in Figure 5
(overleaf).
Figure 5 – Variation in daily demand
2050 Demand
140 2030 Demand
2009 Demand
120
100
Demand (GW) .
80
60
40
20
0
21-Jan 22-Jan 23-Jan 24-Jan
There are two drivers of this effect;
the first is the overall increase in demand; and
the second is the roll out of electric heating and electric vehicles.
The former means that average demand increases while the latter drives the peak up as
the profile of electric heating and charging for electric vehicles amplifies demand at peak
(i.e. heating systems are turned on and electric cars plugged in to charge during current
peak demand hours – note that these are the effects before the application of DSR).
In the context of GB targets for decarbonisation of the electricity sector this higher
demand will need to be met by substantial new low carbon generation much of which is
likely to be intermittent. Figure 6 presents the current capacity mix in 2009 with the
capacity in 2030 and 2050 consistent with DECC pathway Scenario Alpha.
Under Scenario Alpha it is assumed that total generation output in 2050 is 730TWh
assumed to be broadly split equally between nuclear, CCS and renewables. This will
require 250GW of generation capacity, 165GW (>65%) of which in 2050 will be
intermittent generation (see Figure 6 overleaf).
PÖYRY MANAGEMENT CONSULTING December 2011
717_DSR Price signals_Report_v1_0.docx
11ASSESSMENT OF DSR PRICE SIGNALS
Figure 6 – Capacity mix over time
GW 2009 2030 2050
Wind+marine 1.9 65.9 93.3
Solar 0.0 5.8 70.4
Other renewables 1.8 3.3 3.7
Nuclear 10.9 16.4 40.0
CCS coal 0.0 10.2 39.0
Gas 32.6 28.3 0.0
Coal 23.0 1.3 1.3
Oil 3.8 0.0 0.0
Hydro 1.5 1.1 1.1
Pumped storage 2.7 2.8 2.8
Total 78 135 252
This level of intermittent generation will lead to changes in the relationship between prices
and demand. Figure 7 shows this effect for an example day, with peak demand
separating from peak net demand and hence probably peak price.
Figure 7 – Decoupling of peak demand and net demand for an example day
In this example the demand peak occurs at c.5pm but due to the profile and magnitude of
wind generation on the day the pricing peak is likely to occur at c.10am when the highest
volume of conventional generation – which have higher marginal costs than intermittent
generation – is operating (also known as the ‘demand net wind’ peak).
PÖYRY MANAGEMENT CONSULTING December 2011
717_DSR Price signals_Report_v1_0.docx
12ASSESSMENT OF DSR PRICE SIGNALS
A further complication will be that not only will demand decouple from price, but the timing
of peak demand net of intermittent generation will become less certain. Figure 8 below
shows the points at which peak demand (net of intermittent generation) occurs during the
year. The results show that whereas peak demand will be contained within a 3 hour
range in the evening (usually between 5pm and 8pm) as it is now, the peak of demand net
of intermittent generation will occur over an 11 hour range (between 10 am and 9pm).
These results also indicate that peak demand net of intermittent generation will, on some
occasions, occur in the early hours of the morning, highlighting the variability in wind
generation.
Figure 8 – Timing of peak demand (net of intermittent generation)
This report will drive deeper into some of the challenges and possibilities this raises for a
distribution network operator, such as ENW, when we consider the uses of DSR. Of
course, these are not done in isolation from the issues raised in the various scenarios for
National Grid and Suppliers. The discussion and assessments made of the extent to
which demand side response can help mitigate the issues raised above will consider the
relationship between the various parties.
Therefore the focus of the study is to identify scenarios where DSR would be deployed
and to measure the overall value that different parties are able to place on its use and
therefore the strength of the price signals they are able to send.
PÖYRY MANAGEMENT CONSULTING December 2011
717_DSR Price signals_Report_v1_0.docx
13ASSESSMENT OF DSR PRICE SIGNALS
3. BASIS OF OUR ASSESSMENT
In this Chapter we describe the scenarios that will be analysed to derive price signals
regarding the use of demand side response.
Understanding the drivers and the scenarios allows us to begin to see when uses of DSR
by different stakeholders may be in conflict and when they may be aligned. This in turn
allows us to investigate the value to different parties of DSR in particular circumstances
and hence the way in which it may be used. This will ultimately feed into the analysis of
commercial arrangements that need to be struck between parties.
3.1 Bounding the problem
In this Section we set out the boundaries of the problem by identifying the key dimensions
that define the use of DSR and then comment on issues that are deemed out of scope.
This enables us to proceed to the Section where we assess the drivers of different
stakeholder value. In Section 3.2.7 we present the scenario snapshots we will use to
quantify the value associated with the use of DSR by different parties. There are five key
dimensions of understanding the uses of DSR:
Magnitude. How much DSR will be needed (in MW terms)?
Duration: How long will the DSR need to be used for (e.g. minutes, hours)?
Timing: When will DSR be dispatched (time of year, time of day) and what is the
frequency associated with this (how often within season, within week)?
Notice period: Over what period of time will DSR be utilised and how far in advance
will this be known (minutes, hours, days)?
Location: When will the use of DSR need to consider location i.e. where and at what
level of the T&D networks will DSR be used?
Figure 9 relates to the final point and shows the fundamental reason why uses of DSR
may conflict (or be in harmony). The perception of value attached to DSR from each
stakeholder will depend on where they sit (e.g. national v. localised).
Figure 9 – Position of different stakeholders involved with DSR?
PÖYRY MANAGEMENT CONSULTING December 2011
717_DSR Price signals_Report_v1_0.docx
14ASSESSMENT OF DSR PRICE SIGNALS
This means that the different stakeholders will want to use DSR for different things and
will have different perspectives on the best use of DSR. For example, DNO’s will be
interested in the impacts of DSR at the Local and Regional levels whereas the Supplier
will be interested in the impacts of DSR at the national level. As a result, there will be
interaction; including conflict and harmony, across the different levels of DSR. The dotted
lines in the right hand side of the Figure 10 indicate the influence of a level other levels.
Figure 10 – The different geographical interest of stakeholders drives DSR use
Now we have identified the general uses of DSR, we are in a position to determine the
drivers of each stakeholder, which we do in the following Section.
3.2 Identifying value drivers of different stakeholders
In this Section we present the drivers for each of the different types of stakeholder: TSOs,
DNOs, Suppliers, Aggregators and the UK government. The drivers for each stakeholder
are laid out under the relevant headings and are driven by each stakeholders own value
objectives. This allows us to understand the areas where conflict between stakeholders
could arise.
3.2.1 TSO
The main areas a TSO will use DSR are for:
Optimising network investment. Avoiding additional (unnecessary) investment in
transmission networks;
Energy balancing. Operation (within the balancing mechanism) to balance the
wholesale market;
System balancing (within half hour to real time). There are a range of ancillary
service (balancing services that the TSO uses; reserve, frequency response etc.; and
Managing network constraints pre and post fault (to maintain system balancing).
PÖYRY MANAGEMENT CONSULTING December 2011
717_DSR Price signals_Report_v1_0.docx
15ASSESSMENT OF DSR PRICE SIGNALS
3.2.2 DNO
DNOs will use DSR to:
Avoid or defer network investment and avoid investment in redundancy networks;
Manage / Minimise (unacceptable) customer outages and use DSR to optimise
operational costs and capital costs, and as an alternative to procuring energy
generation or other measures; and
Managing network constraints in operational timescales.
3.2.3 Supplier/ retailer
For the purposes of this study we define two different types of supplier: those operating as
part of a vertically integrated entity and those operating independently.
In some cases the values will be the same. In general suppliers will use DSR to manage
their position, including:
Energy balancing (MWh / settlement period). Reducing exposure to cash out prices
by optimising their contracting position / physical position (1/2 hourly resolution);
Capacity. Avoid building or running peaking generation;
Manage CO2 emissions (avoid running fossil generation); and
Provision of DSR services to networks and TSO (i.e. develop into an aggregator).
One area where suppliers from vertically integrated entities may differ from non-integrated
entities is to use DSR to optimise their exposure to the market, taking into account their
generation portfolio.
3.2.4 Aggregator
We define two characteristics of value for aggregators:
Aggregators generate revenue by providing flexibility and collecting revenues
associated with price arbitrage; and
Provide ancillary services to the market.
3.2.5 Consumer
Consumers encompass a wide range – from large industrial users to domestic users; and
as such drivers, level of interest and priorities in relation to DSR will vary. In general the
primary motivation for DSR provision will be driven by three factors:
Cost – (the prime driver) essentially the ability to reduce electricity costs, albeit this
can be viewed from perspective of service value i.e. value available to them from
user(s) of DSR
Convenience/commitment – the ability to provide DSR with minimal if any impact on
business operations, domestic lifestyle etc. as relevant
Complexity – i.e. lack of. The ability to easily engage in DSR if cost and convenience
criteria are met – this can often be the last barrier to DSR deployment.
PÖYRY MANAGEMENT CONSULTING December 2011
717_DSR Price signals_Report_v1_0.docx
16ASSESSMENT OF DSR PRICE SIGNALS
3.2.6 UK Government
The UK Government may be the most suitable entity to represent the views of the public
in terms of desirable outcomes for smart grids from the perspective of UK plc. We define
these views as the integration of variable low carbon generation minimising overall cost to
the consumer.
3.2.7 Scenarios introduction
Now that we have set out the boundaries of the problem and defined the drivers of each
stakeholder, we are in a position to begin to map out the scenarios that will be
investigated in the analysis. These scenarios have been defined with the value drivers in
mind to derive situations to investigate the different uses of DSR by different parties and
the trade-offs that occur when using DSR to control the load on the system.
In order to assign value to different DSR services it is necessary to define the level of
saving and the frequency over which these occur. In this spirit we use snapshots so that
we can quantify the frequency of a situation (using our historical data) and the magnitude.
This enables us to distinguish between the impact of a low frequency high value event
and a high frequency event that has lower but still significant value. This process is
central to determining the value that a user allocates to a particular service and hence the
different price signals that will be sent by the respective stakeholder.
Once the scenarios are agreed we will define the goal of each stakeholder in a particular
situation and then compare the uses of DSR, evaluate the value associated with it which
will depend on the following issues;
Does the stakeholder take an active interest in this situation?
If the stakeholder has active interest in the situation, how will it want to use DSR?
Are the values of different stakeholders aligned or in conflict in this situation?
Identifying potential synergies and conflict in the use of DSR
The next step is to identify and characterise the broad use modes of DSR and identify
types of behaviour that result in conflict, inefficiency and harmony.
1. Two or more stakeholders interests align (i.e. they want to use DSR in the same way)
and hence the risk is that the provider is paid for the same service twice (or more).
Whilst the specific consumer/provider may benefit, consumers as whole end up
paying more than is necessary for delivered service (assuming point 2 below does not
apply)
2. Value of DSR is split between too many stakeholders and therefore no-one responds
to the price signal from any one party as their respective individual price/value signals
are too weak.
3. When two or more stakeholders interests conflict and there is only enough capability
to meet the needs of one; it then becomes a question of who is willing to pay the most
money for the use of DSR
4. The use of DSR by one party leads to the need to use DSR by another party i.e. the
use of DSR creates a need for DSR to be used when it would not otherwise be
needed e.g. price vs. demand on a windy day.
In the following section we present the snapshot scenarios that we used to underpin the
analysis of the interaction of different stakeholders potential use of DSR. It should be
PÖYRY MANAGEMENT CONSULTING December 2011
717_DSR Price signals_Report_v1_0.docx
17ASSESSMENT OF DSR PRICE SIGNALS
noted that when we state “modify demand” we mean reduction/increase or relocation of
demand; in most scenarios this may mean an emphasis on reduction, in others relocation.
3.3 Summary of the scenarios defined
The various needs for DSR and its uses are varied and their relationship is complex.
Thus in orders to make the solution quantifiable, a set of scenarios were defined. The aim
was to investigate the various possible situations were DSR would be used and to analyse
the drivers, the interested parties and value associated.
Figure 11 below provides a summary of the scenarios defined. Note that for each of the
main cases identified, there are various subtleties that required additional subcases.
Figure 11 – Summary of the scenarios defined by Pöyry
Scenario Situation Problem
Shaving peak demand to avoid network
investment
Case A1 Shifting demand creates a new problem for the DNO
Demand is shifted at the national level and because peak demands do not coincide
Case A2 has an adverse affect on the local network Shifting demand exascerbates an existing problem for
the DNO
Case B1 Both Grid and DNO want to shift demand at The same service is contracted twice
Case B2 the same peak
The same service is contracted three times: by NG,
DNO and in order to minimise prices
Boost peak demand to accommodate
wind and optimise prices
Case C1 Investment must be sufficient to avoid capacity
constraints
Case C2 Suppliers drive price optimisation through
A network constraint exacerbates the volume of DSR
needed because NG are trying to reduce peak demand
the use of DSR
Case C3 A network constraint that suppliers are aware of
prevents full price optimisation
Case D DSR is used to avoid wind curtailment
The value associated with this action may vary with
different network capacity constraints
Modify demand to accommodate low
wind period
Case E1 DSR is used to avoid the costs associated
There is a prolonged low wind period
Case E2 with alternative solutions to the problem
The transmission network has only been built to
accommodate demand net embedded generation
Modify demand to compensate for a
generation trip
Case F DSR is used instead of ancilliary services
The alternative solutions have different values
associated with them
Case G DSR is used to balance the system
Price signal conflict between a supplier being out of
balance and using DSM to balance
Modify demand to compensate for a
transmission constraint
Case H Use DSR to avoid bringing on another Size and frequency of network constraints
generator to meet demand
Modify demand to compensate for a
distribution network fault
Case I Use DSR to avoid bringing on another Size and frequency of fault on the distribution network
generator to meet demand and the value to the DNO
Modify demand to cope with volatile
demand net wind profile
Case J1 DSR is used to mitigate wind forecast error
The error/volatility is managed for network reasons
Case J2 The error/volatility is managed for supplier reasons
The following sub-sections define the content of the scenarios in more detail.
PÖYRY MANAGEMENT CONSULTING December 2011
717_DSR Price signals_Report_v1_0.docx
18ASSESSMENT OF DSR PRICE SIGNALS
3.3.1 Shaving peak demand to avoid network investment
In this scenario we investigated the situation where national peak demand and local peak
demand do not coincide (Case A) and where national peak demand and local peak
demand do coincide (Case B).
In the first situation, shifting the national peak can create the following situations:
Case A1. Shifting demand at the national level creates a new problem for the DNO.
This would be because the DNO network peak does not coincide with the national
demand peak and National Grid would like to reallocate demand in a way that – for
the part of this provided within a given DNO area –increases the DNO peak demand
above existing network capacity capability and hence the DNO would need to invest
in network reinforcement. The key trade-off to evaluate here would be the value of
avoiding network investment at the Grid level to the value of avoiding network
investment at the DNO level.
Case A2. A variant of the above – this is where the DNO already faces an issue
locally. Thus shifting demand at the national level creates a worse problem for the
DNO as action at the national level pushes up the peak on the DNO network.
Figure 12 – Modify demand at national level to avoid maximum peak
demand and create a problem at the DNO level
In the second situation, shifting the national peak can create the following situations:
Case B1. DSR providers are paid twice for the same service; this is when the DNO
demand profile and National Grid demand profile match and thus the DNO sends
price signals to reduce demand at the same time that National Grid does.
Case B2. A sub-set of the above case; the issue is to consider whether suppliers
would also want to send price signals at the same time, resulting in a triple
contracting of the same service.
PÖYRY MANAGEMENT CONSULTING December 2011
717_DSR Price signals_Report_v1_0.docx
19ASSESSMENT OF DSR PRICE SIGNALS
Figure 13 – Demand at DNO level and national level matches
We considered the need to review a situation where action by a DNO to reduce a Local
network peak demand would potentially drive a materially higher national peak demand
which triggers transmission level action. Our modelling suggests this is not a realistic
situation which will arise.
For this to occur a lot of DNOs would need to shift substantive demand away from local
peaks at points on the network where the local demand peaks do not coincide with the
timing of the national peak demand –in a way that causes the relocated demand to arise
at time of national peak demand. Furthermore the shift would need to be a meaningful
time shift given DNO load profiles (i.e. shifting demand off a local peak of 4.30pm to a
5pm time slot is not going to help the DNO reduce their local peak demand – it will simply
move it by half an hour and not address the driver of avoiding DNO capacity investment.
The detailed distribution network demand profile data required for this scenario (Covering
Case A and Case B) was provided by the University of Bath (“Bath”) who have modelled
demand profiles and also costs of local reinforcement assets for urban, suburban and
rural networks at EHV, HV and LV levels. Pöyry utilised national data from the work
carried out for DECC with an artificial network constraint inserted into the modelling.
The analysis used this data to estimate the frequency of occurrence of the respective
actions taking place. The benefit for networks is the avoided investment cost – and it is
this value that they could pass on to DSR providers. There is also a further UK plc.
benefit as investment in generation capacity will be avoided.
3.3.2 Boost peak demand to accommodate wind and optimise prices
In this scenario we investigated the value associated with (supplier driven) price
optimisation i.e. wholesale market costs are minimised. This was quantified using two
scenarios from existing work; one scenario where we assumed the baseline capacity in
2030 was 80GW (enough to meet fixed demand) and the other when network investment
PÖYRY MANAGEMENT CONSULTING December 2011
717_DSR Price signals_Report_v1_0.docx
20ASSESSMENT OF DSR PRICE SIGNALS
was made to allow wind free rein (96GW in 2030). There are three cases for this
scenario:
Case C1; DSR is used to optimise wholesale market costs but as a consequence
demand is moved in way which leads to a boost in peak demand seen on the
networks at a transmission and/or distribution level and hence there is the need to
invest in network capacity (noting that this effect may not be seen at all points on the
network “pyramid” for given situations and will have varying impact as the DSR
varies). What is the cost of investing in the additional network capacity?
Case C2; as above but in a situation where the transmission network already faces a
network capacity constraint (and/or is unable to invest away this capacity constraint)
where they are already seeking to reduce peak demand and thus the price driven
DSR exacerbates the volume of DSR the networks need deploy. Therefore, what is
the cost of operational actions?
Case C3; use DSR to optimise wholesale market costs under a network constraint –
this assumes suppliers are aware of network capacity constraints and optimise within
that (e.g. 94GW or 80GW constraint that Pöyry used for DECC work).This explores
the curtailed value suppliers can offer to DSR providers versus cost of avoided
network investment.
Figure 14 – Modify demand to boost peak, and take advantage of high wind
Peak demand net intermittent generation is the important thing here as it drives market
prices – higher demand periods may be cheaper than lower demand periods depending
on how much of the demand can be met by zero/low cost generation.
We used data from two scenarios we ran for DECC; the first is where DSR was allowed to
minimise prices subject to a network cap. The second is where DSR was allowed to
boost demand.
PÖYRY MANAGEMENT CONSULTING December 2011
717_DSR Price signals_Report_v1_0.docx
21ASSESSMENT OF DSR PRICE SIGNALS
Case D; this is similar to the above but where DSR is used to avoid wind curtailment
where otherwise wind output exceeds the level of wind output which the network can
securely carry. The key relationship to define here will be the instantaneous
penetration of wind that is allowed (in Ireland it has been deemed to be 75%). This
will define the value associated with curtailing wind compared to moving demand
around. The critical value will occur when incorporating wind requires either demand
to be curtailed (at prices specified by National Grid and Ofgem) or shifted to
incorporate wind.
Figure 15 – Modify demand as peak wind and peak demand do not coincide
3.3.3 Modify demand to accommodate low wind period
This scenario investigated the price signals associated with a low wind period. There are
two separate cases:
Case E1: Prolonged period of low wind. In this case we will investigate the value
associated with curtailing demand compared to carrying additional capacity to meet
demand in these periods (this could be generation, storage or interconnection).
Case E2: When the transmission network has been built to accommodate demand
net embedded generation where that includes substantive wind generation; and there
is a prolonged period of low wind. In this case we will evaluate the additional
investment costs associated with transmission network investment and capital costs
for peaking plant compared to alternative of operational costs in the form of demand
curtailment costs. Therefore this scenario answers the question: what is the value
associated with building the transmission network to meet demand the transmission
network sees from the distribution networks (i.e. demand net embedded generation)
instead of latent demand (i.e. demand plus embedded generation)?
PÖYRY MANAGEMENT CONSULTING December 2011
717_DSR Price signals_Report_v1_0.docx
22ASSESSMENT OF DSR PRICE SIGNALS
Figure 16 – Illustrative difference between demand net embedded generation and
demand plus embedded generation
3.3.4 Modify demand to compensate for generation trip
In this scenario we investigated the price signals associated with modifying demand to
compensate for a generation trip. There are two cases under this scenario; network
driven and generator/VIP driven.
Case F; generation trip. At transmission level the price signal means avoiding the
need to contract other ancillary services (at the STOR price). At the distribution
network level it avoids demand curtailment i.e. interruption incentives.
We take the modelled (Zephyr) pattern of random outages with each counting
as a trip and then multiply by the respective cost of interrupting supply for the
distribution network and ancillary services for the transmission network.
Case G; generator/VIP out of balance. In this case we estimate the price signal
associated with avoiding imbalance charges and distress prompt trading.
3.3.5 Modify demand to include a transmission network constraint
This scenario (Case H) is much the same as Case F above except it introduces a
locational system balancing dynamic as it investigates the impact of a network constraint.
Assuming that a network constraint is known about, there are two options; to reschedule
appropriate generation (up and down as appropriate either side of the network constraint)
as traditionally done or to use a combination of reduced generation (“above” the
constraint) reduce demand (“below” the constraint).
The key issue here is to determine the average cost of constraining demand and more
importantly, how often the constraint arises.
PÖYRY MANAGEMENT CONSULTING December 2011
717_DSR Price signals_Report_v1_0.docx
23ASSESSMENT OF DSR PRICE SIGNALS
The cost of bringing in other generation to meet the demand is the cost of constraining
generation bid on price of generation and we would propose to use SBP as a proxy.
We would expect the case of reacting to a post fault constraint to be essentially the same
as Case F, albeit of higher cost to the GBSO as it would need to take account of locational
issues in redressing the situation (and could not simply use a national price ladder). It is
not really possible for us to determine by how much as it would be very case specific and
our modelling does not capture this.
3.3.6 Modify demand to compensate for a distribution network fault
Case I: This looks at the use of DSR to respond to a local issue on a distribution
network. For example, the driver might be planned network outages to rectify a
network problem; this would lead to a reduced network capacity to meet unmodified
demand requirements. Alternatively, it could be a network fault/trip in operational
timeframes which requires some form of action by the DNO, where a DSR action
would be a viable option. In this case, the security of supply issues for the DNO
motivates the use of DSR.
3.3.7 Modify demand to cope with volatile profile of demand net wind
The final scenario (Case J) investigates the issue of using DSR for balancing. There are
two cases:
Case J1: Managing wind forecast error for network reasons. This is where the TSO
will use DSR to manage energy balancing close to real time to avoid the need to
contract ancillary services.
Case J2: A supplier uses DSR to manage wind forecast error. In this case the
supplier will use DSR to manage energy balancing at the half hourly level. Ultimately
this should reduce the requirement for contracting additional capacity. This analysis
would evaluate the lost value associated with using DSR for ancillary services
compared to avoidance of over-contracting.
PÖYRY MANAGEMENT CONSULTING December 2011
717_DSR Price signals_Report_v1_0.docx
24ASSESSMENT OF DSR PRICE SIGNALS
[This page is intentionally blank]
PÖYRY MANAGEMENT CONSULTING December 2011
717_DSR Price signals_Report_v1_0.docx
25You can also read