Assessment of Early Warning Efforts in Leyte for Typhoon Haiyan/Yolanda - DRAFT
←
→
Page content transcription
If your browser does not render page correctly, please read the page content below
Published by

Assessment of Early Warning Efforts
in Leyte for Typhoon Haiyan/Yolanda
DRAFT
Imprint
As a federally owned enterprise, we support the German Government in achieving its objectives in the
field of international cooperation for sustainable development.

Items from named author does not necessarily reflect the views of the publisher.

Published by
Deutsche Gesellschaft für Internationale Zusammenarbeit (GIZ) GmbH

Registered offices
Bonn and Eschborn, Germany
T +49 228 44 60-0 (Bonn)
T +49 61 96 79-0 (Eschborn)

Environment and Rural Development Program
Disaster Risk Management Component

3rd Floor, PhilAm Life Building, Justice Romualdez Street,
Tacloban City, Leyte, Philippines
T +63 (053) 323 8623
F +63 (053) 323 8624
I: www.enrdph.org
I: www.giz.de

Responsible
Dr. Walter Salzer
Environment and Rural Development Program
Program Director and Principal Advisor
E: walter.salzer@giz.de
Chief Adviser Local Governance
Source and Copyrights
© 2014 Deutsche Gesellschaft für Internationale Zusammenarbeit (GIZ) GmbH

Author
Olaf Neussner Moritz Beitzen Moritz Beitzen Thomas Hänert

Copyright on Photos/ Graphs and Maps
The photos in this publication are owned by the author unless otherwise indicated on the photo.

Frontpage: Photo by Benni Thiebes, taken in Tacloban on 08 November 2013 at 14:49h

Maps
The geographical maps are for information purposes only and do not constitute recognition under international law
of boundaries and territories. GIZ does not guarantee in any way the current status, accuracy or completeness of the
maps. All liability for any loss or damage arising directly or indirectly from their use is excluded.

Layout/Design etc.
Opalyn A. Agulay

Printed and distributed by
Deutsche Gesellschaft für Internationale Zusammenarbeit (GIZ) GmbH

Place and date of publication
Manila, Philippines
May 2014
2nd Edition
Contents

Acronyms and abbreviations

1.   Acknowledgement                                  6

2.   Executive summary                                7

3.   Recommendations                                  8

4.   Introduction and background                      9

5.   The disaster event                               10

        5.1   Storm                                   11

        5.2   Storm surge                             13

        5.3   Rain and river floods                   16

        5.4   Landslide                               20

        5.5   Summary concerning the disaster event   20

6.   Risk knowledge                                   20

        6.1   Storm                                   21

        6.2   Storm surge                             25

        6.3   Rain and river floods                   31

        6.4   Landslides                              35

        6.5   Vulnerabilities                         36

        6.6   Summary for risk knowledge              39

7.   Early detection for Haiyan/ Yolanda              40

        7.1   Storm                                   40

        7.2   Storm surge                             41

        7.3   Rain and river floods                   42

        7.4   Landslide                               42
7.5   Summary for the early detection of Haiyan/ Yolanda   42

8.    Communication of warning                                      43

9.    Summary for communication of warnings                         46

10.    Consequences of shortcomings in early warning                47

Appendices

Appendix 1. OCD letter concerning safety of evacuation centre       52

Appendix 2. Typical damages caused by typhoon and storm surge       54

Appendix 3. Casualties in Leyte                                     56

Appendix 4. NDRRMC warning of Yolanda                               57

Appendix 5. Questions to officials and residents by GIZ             58

References                                                          62
Acronyms and abbreviations
CAPRA 		 Central American Probabilistic Risk Assessment
DOST		   Department of Science and Technology
DPWH		   Department of Public Works and Highways
DRRMC		  Disaster Risk Reduction and Management Office
GIS		    Geographic Information System
GIZ		    Deutsche Gesellschaft fur Internationale Zusammenarbeit (GIZ) GmbH
h		 hour
HF		     High Frequency
hPa		    hecto Pascal
JRC		    Joint Research Centre
km/h		   kilometre per hour
LGU		    Local Government Unit
MGB		    Mines and Geoscience Bureau
Mph		    miles per hour
NDRRMC   National Disaster Risk Reduction and Management Council
NIA		    National Irrigation Agency
NOAH		   National Organizational Assessment of Hazards
OCD		    Office of Civil Defence
PAGASA   Philippine Atmospheric, Geophysical and Astronomical
		Service Administration
PHIVOLCS Philippine Institute of Volcanology and Seismology
PSTC		   Philippine Science and Technology College
READY		  Hazards Mapping and Assessment for Effective Community-Based
		       Disaster Risk Management
SSS		    Saffir Simpson Scale
TRMM		   Tropical Rainfall Monitoring Mission
UNISDR   United Nations International Strategy for Disaster Reduction
1          Acknowledgement
    This study was financially supported by the DIPECHO program of the Commission of
    the European Union and the German Federal Ministry for Economic Cooperation and
    Development.

    Moritz Beitzen worked on interview questions together with Ruth Ramulte-Cabangangan,
    who also conducted the interviews. Critical comments from Adriana Sanchez, Donna
    Lagdameo and Moritz Beitzen helped improving the draft towards a final document.

6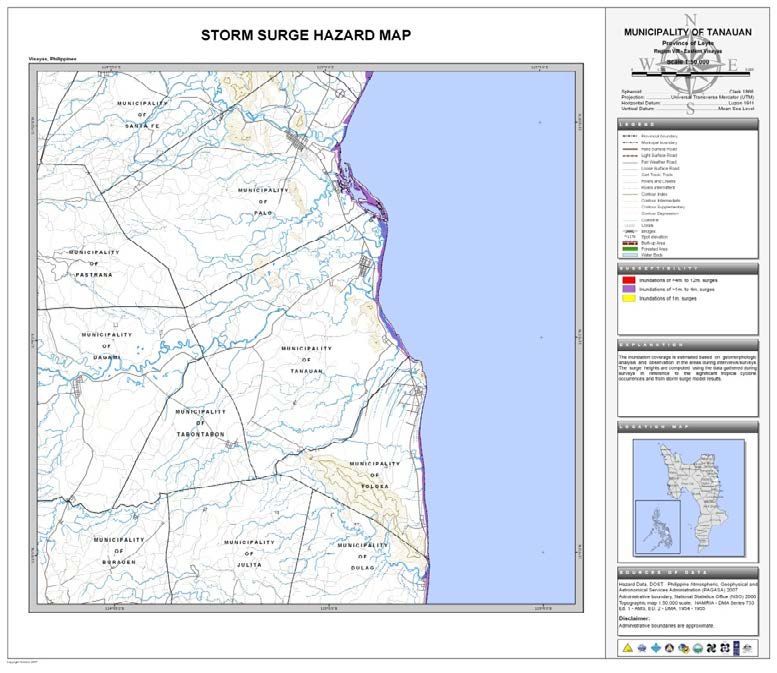
2          Executive Summary
    Typhoon Haiyan/Yolanda was one of the strongest typhoons that made landfall ever
    recorded. The maximum windspeed in Tanauan/Palo was approximately 271 km/h with
    on-shore wind direction. The storm surge (sometimes wrongly referred to as a “tsunami”
    by locals) was highest in the Tanauan, Palo, and Tacloban areas, with estimates between 2.3
    and 5 meters. Rains between 100-150 mm fell in the Central parts of Leyte.

    The official storm surge hazard map underestimated the inundation area of the storm
    surge. The actual area was larger and close to the inundation area of the official tsunami
    hazard map. Furthermore, the official storm surge hazard map did not consider storm
    surges with a height of 7 meters (the forecasted height of PAGASA) and therefore it was
    not possible to relate this map to the predicted surge.

    Though a spectrum of risk information was available, those in charge of risk management
    were partly unaware of the dimensions of the hazard and vulnerabilities and/or did not
    use the information appropriately. A safety check of evacuation centres in respect to the
    forecasted storm surge was either not done or the check was performed and did not result
    in appropriate actions. Some evacuation centres were located in storm surge areas and
    therefore flooded.

    The forecast of the storm path and its strength was made very accurately by many agencies,
    including PAGASA, days before the landfall. The Joint Research Centre (JRC) of the
    European Union warned of a storm surge on 06.11.13, while PAGASA did this one day
    later at 12:00h. While PAGASA overestimated the storm surge height in its forecast, the
    JRC and the Project NOAH storm surge estimates were closer to the actual height for
    Tacloban.

    The warnings from the government and media came days before the typhoon made
    landfall. Thus, there was enough time for preparations and evacuations before 8 November
    2014. Government offices repeatedly asked residents near the coast to evacuate and, in a
    few cases, even used force to evacuate them. PAGASA/NDRRMC emphasized rain, flood
    and landslide warnings, but did not stress very strongly the storm surge to come. Warnings
    by many institutions, including OCD and LGUs, were apparently not serious enough to
    make people understand that their lives were in jeopardy if they do not evacuate. Many
    did not understand the term “storm surge”. Accounts of residents suggest that a large part
    of the population in areas where there were storm surges did not evacuate. GIZ calculated
    that approximately 94% of the casualties in Tacloban, Palo and Tanauan were caused by
    the storm surge. Serious warnings and more effective evacuations along the coastline could
    have saved many lives.

                                                                                                  7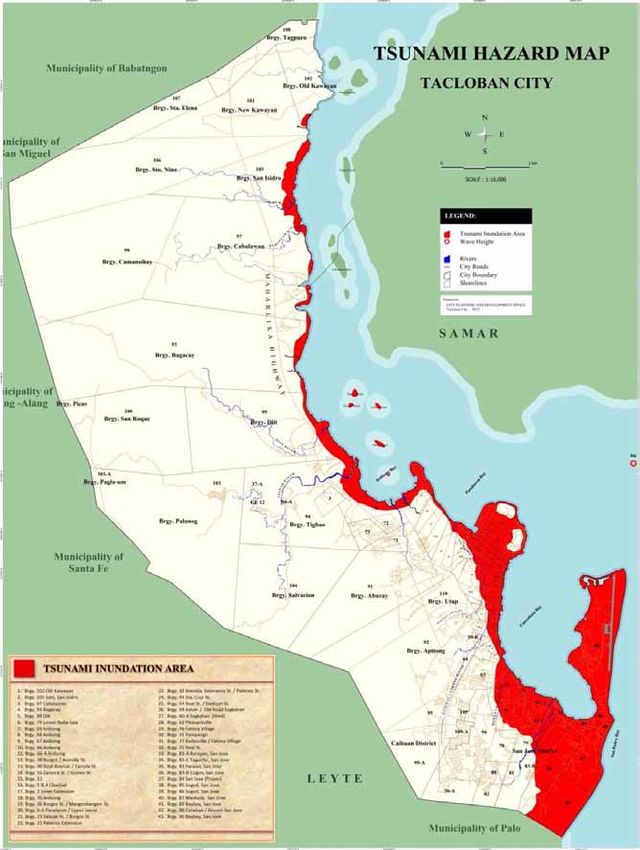
3         Recommendations
    Below are summaries of the most pertinent recommendations for each stakeholder (group).
    More detailed explanations are given in the main report.

    For Scientific Institutions
    •      PAGASA’s technical capacity should be improved to provide more accurate
           information for storm surge warnings and hazard maps.
    •      NOAH sensors should switch to HF radio or satellite phones for uninterrupted
           transmission of data.
    •      Storm surge hazard maps should be adjusted taking the recent experiences into
           consideration.

    For OCD and DOST
    •           Warnings should use layman’s language and clearly emphasise the seriousness of a
               particular hazard.
    •          A colour coded harmonized multi-hazard early warning system should be introduced.
    •          Storm surge should be included in the official warning system (similar to tsunami).

    For Disaster Risk Reduction Offices/Committees
    •      Officials tasked with disaster management (e.g. OCD, rescuers, mayors) should not
           stay in high risk areas when an extreme hazard event is imminent. They may become
           victims themselves.
    •      Delineate identified danger zones (tsunami, storm surge) clearly with sign posts.
    •      Mark evacuation routes and evacuation centers with sign posts.
    •      Survey existing evacuation centers and identify those within danger zones.
    •      Assign evacuation centres depending on hazard.
    •      Reinforce evacuation centres depending on hazard.
    •      Consider strict enforcement of forced evacuation (example Albay).

    For land use planners
    •      Assign new evacuation centres outside danger zones and clearly indicate which
           evacuation centers are off-limit for which particular hazards.
    •      Consider locally customized no-build zones in high risk areas.
    •      Consider conditional build zones (e.g. only buildings with special reinforcements;
           only business, but no residence, etc.)

8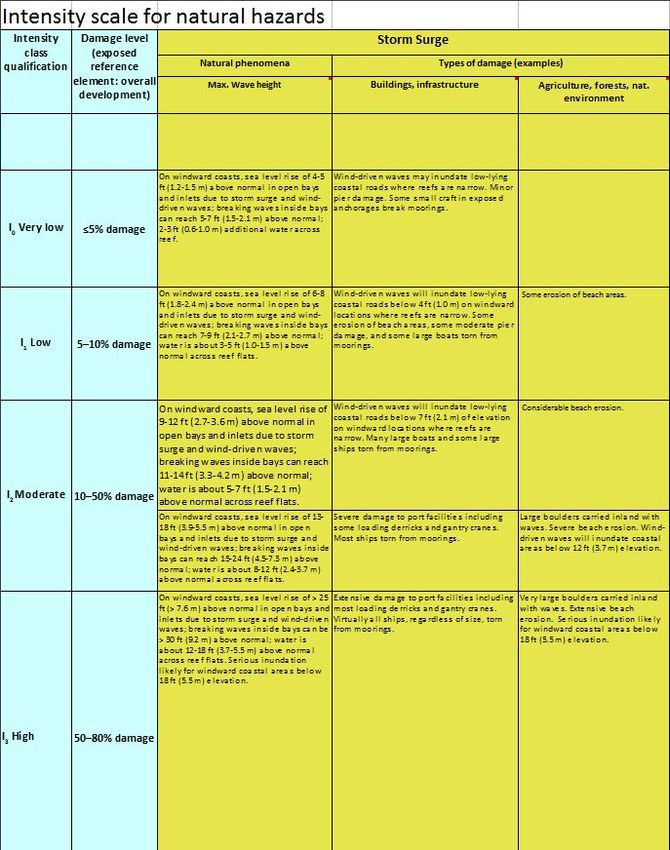
4     Introduction and background
    The storm Haiyan/Yolanda was the deadliest natural disaster in the Philippines since
    reliable records began. The typhoon made landfall in the early hours of 8 November 2013
    in the South of Eastern Samar and proceeded West-North-West via Leyte, Northern Cebu,
    Northern Negros, Northern Panay and exited the Philippines via Coron/Busuanga in the
    North of Palawan, leaving destruction and death on its path.

    The Philippines is regarded as a country with a well designed and solid disaster risk
    management system1 featuring a specialized institution for disaster risk reduction and
    management (NDRRMC/OCD). UNISDR praised the advanced early warning systems2.
    However, it appeared that the Philippines was not fully prepared to meet this typhoon in
    terms of early warning, response, relief and rehabilitation.

    Many Filipinos and observers asked whether the death toll of more than 6,000 confirmed
    dead would have been less if early warning systems had been more effective. This report
    seeks to contribute to answering this question and highlight areas that need improvement.

    In recent Philippine history, two natural disasters are regarded by some observers to be
    failures of effective early warning. In 2011, severe tropical storm Washi/Sendong caught
    many inhabitants of Cagayan de Oro and Iligan unaware of flash floods, leaving more than
    a thousand dead3.In the following year, 2012, a strong typhoon named Bopha/Pablo hit
    the Southeast of Mindanao and widely unprepared communities and some government
    offices apparently did not follow warnings. Again more than a thousand people perished.
    With these events in mind it was hoped that the early warnings to the local populationhad
    been improved when tropical cyclone Haiyan/Yolanda hit the Philippines.

    This paper is meant to analyse the hazard event in terms of wind speeds, rain, storm surge,
    floods and landslides. The actual event is then compared with different general hazard
    information and then with forecasts to determine the accuracy of the predictions. It is
    assumed that accurate general hazard information (e.g. hazard maps) and precise forecasts
    (e.g. the track of the typhoon) would enable communities to prepare adequately. However,
    it is recognized that timely and detailed hazard information alone does not necessarily lead
    to adequate preparations. The timeliness, content and coverage of warning messages are
    essential for a successful evacuation and other preparations. Therefore information was
    gathered (mostly through interviews4) to understand the dissemination of the alerts and
    the reaction of residents in dangerous places. Last but not least, the connection between
    casualties and early warning is analysed to answer the question: would a better early warning
    system have saved lives?

                                                                                                    9
2nd Edition - GIZ: Assessment of Early Warning Efforts in Leyte for Typhoon Haiyan/Yolanda

     This paper has to be treated as a preliminary assessment. Time constraints and other pressing
     tasks after the typhoon did not allow conducting a large scale survey with many respondents
     in the affected areas of Leyte. Many details (e.g. detailed account of causes of death in different
     locations, exact location of evacuation centres in relation to the inundation by storm surge) are
     still to be collected and may be subject to further investigations.

     Furthermore, this report does not look into damages and losses caused by the typhoon. Those
     can hardly be avoided by early warnings, but advanced alerts are effective in saving lives and
     therefore this report concentrates on this aspect of disaster risk reduction.

     Tropical cyclones, called typhoons in the Western Pacific, are one of the main causes of
     economic damages and human casualties caused by natural catastrophes in most of the affected
     countries Philippines, Vietnam, PR China, Taiwan, Korea and Japan.

     Considerable effort has been invested in detecting, tracking and forecasting their path and
     characteristics. The data used for this are mostly generated by satellites and used by weather
     bureaus of all concerned countries. For any typhoon in the North-west Pacific there are several
     agencies predicting paths and wind speeds.

     Haiyan/Yolanda caused the death of 6,111 persons with 1,779 still missing. 16 million
     persons were affected and 4 million persons were displaced. 1.14 million houses were damaged
     (550,928 totally, 589,404 partially)5. The overall economic losses are estimated at 571.1 billion
     Pesos (12.9 billion US$)6. The damage from typhoon Yolanda and the resulting loss in 2013
     is estimated to be Php101.79 billion, representing 0.9 percent of Gross Domestic Product
     (GDP)7.

     Within about a month the Philippine government prepared an extensive recovery and
     rehabilitation strategy to respond to the event, called the Reconstruction Assistance on Yolanda
     (RAY) strategy, which also calls for deriving lessons from the disaster to be factored into policies,
     systems, and capacities8.

 5        The disaster event
     This chapter describes the natural extreme event that happened in Leyte on 8 November 2013.
     This is the reference for checking the quality of forecasts and warnings issued before Haiyan/
     Yolanda struck the Philippines.

10
2nd Edition - GIZ: Assessment of Early Warning Efforts in Leyte for Typhoon Haiyan/Yolanda
5.1. Storm
Haiyan/Yolanda was first noticed as a weather disturbance with the potential of developing
into a tropical storm on 3 November 2013. It continuously gained strength until 7
November and started weakening on 8 November and dissipated on 11 Nov. 2013 in the
South of China9. Track data are available in from different agencies 10, 11, 12, 13.
Haiyan developed into a Saffir Simpson Category 5 typhoon with wind speeds of more than
251 km/h and continued to intensify as it travelled across the waters. On November 7, the
Japan Meteorological Agency estimated the system’s one-minute sustained winds were 315
km/h (195 mph). Several hours later, the eye of the cyclone made its first landfall in the
Philippines at Guiuan, Eastern Samar, without losing any intensity. It gradually weakened,
making landfall in Tolosa, Leyte at around 7 am on 8 November. While crossing Leyte,
the structure of the cyclone was compromised and the eye filled with clouds, reducing its
wind speed as as evidenced in the Doppler radar images. The central pressure of the eye
DRAFT -was
GIZ: Assessment
approximately 905ofhPa
Early Warning
when Efforts
it hit Tolosa in Leyte
at 7:00 h localfor Typhoon Haiyan/Yolanda
time.
Diagram 1: Atmospheric Pressure in the Centre of Haiyan/Yolanda
Diagramm 1: Atmospheric Pressure in the Centre of Haiyan/Yolanda
14
Y: pressure in hPa, x: time in days. Time
14 is UTC.
Y: pressure in hPa, x: time in days. Time is UTC.
With data on the maximum wind speed, central pressure and forward movement of the
eye it is possible
With datatooncalculate
the maximumthe wind
windspeed,
profile of the
central cyclone
pressure and (for themovement
forward method see
of theNeussner
15
and Fuchseye).it is possible to calculate the wind profile of the cyclone (for the method see Neussner
and Fuchs).
Diagram 2: Wind speed of Haiyan at landfall in Tolosa, Leyte
300
200
V [km/h]
100 11Y: pressure in hPa, x: time in days. Time is UTC. 14
2nd Edition - GIZ: Assessment of Early Warning Efforts in Leyte for Typhoon Haiyan/Yolanda
With data on the maximum wind speed, central pressure and forward movement of the
eye it is possible to calculate the wind profile of the cyclone (for the method see Neussner
and Fuchs 15).
Diagram 2: Wind speed of Haiyan at landfall in Tolosa, Leyte
Diagram 2: Wind speed of Haiyan at landfall in Tolosa, Leyte
300
200
V [km/h]
100
0
0 20000 40000 60000 80000
R [m]
The radiusThe
R at Vmax
radius was
R at estimated
Vmax from
was estimated the
from theDoppler radar
Doppler radar image
image of 08.11.13 07:00:59h 16.
of 08.11.13
The calculated wind speeds
The calculated wind speeds show
showthe maximum
the maximum at Tolosa/Tanauan
at Tolosa/Tanauan andlesser
and gradually gradually
winds lesser
winds towards
towardsthetheNorth
North andandthethe South.
South. It is noteworthy
It is noteworthy thatdirection
that the wind the wind direction
North of the eyeNorth
was of the
eye was on-shore
on-shore while while
South South
of the eyeofit was
theoff-shore.
eye itThis
was off-shore.
is important This
for the is important
appearance of a high for the
storm surge in the area of Tanauan, Palo and Tacloban, while the
appearance of a high storm surge in the area of Tanauan, Palo and Tacloban, while theSouthern areas experienced
relatively
Southern areas little storm surge.
experienced relatively little storm surge.
Map 1: Maximum wind speeds and directions of Haiyan/Yolanda in Leyte
|8
Wind speed and direction on the Eastern side of Leyte at 7am, on the Western side at
9am.
122nd Edition - GIZ: Assessment of Early Warning Efforts in Leyte for Typhoon Haiyan/Yolanda
5.2. Storm surge
It is not known whether reliable ground based
sea level data were collected during the event in
Leyte. Therefore calculated data from simulations
were utilized to describe the height of the water.
It should be noted here that the tide was low in
the Eastern coast of Leyte when the typhoon made
its landfall. Some hours later the water level, and
therefore also the storm surge would have been
considerably higher.
There are numerous eye witness accounts, photos
and videos of many areas giving indications of the
extent of inundation as well as the water height.
These accounts are quite consistent with the
tsunami hazard map produced by PHIVOLCS
DRAFT - GIZ: Assessment of Early Warning Efforts in Leyte for Typhoon Haiyan/Yolanda
in the context of the READY Project (see chapter
© Photo by Brenda Samson on November 9, 2013
“Risk Knowledge”).
Haiyan struck with a storm produced
surge, strong
by enough to
PHIVOLCS in the context of the READY Project (see chapter “Risk
send cars and houses tumblingKnowledge”).
through neighbourhoods
of Tacloban city.
Map 2: Storm Surge Water Height at Coast and Inundation Distance
Map 2: Storm Surge
Water Height at
Coast and Inundation
Distance
Calculated storm surge data
from JRC17
Calculated storm surge data from JRC17
132nd Edition - GIZ: Assessment of Early Warning Efforts in Leyte for Typhoon Haiyan/Yolanda
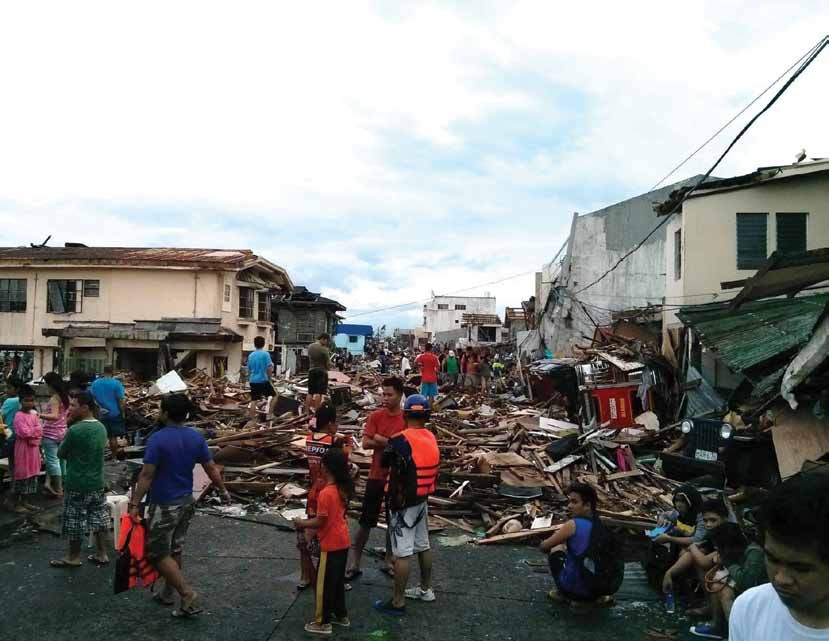
A fire engulfed one of the
buildings after a storm surge
swept Tacloban city.
Map 3 below shows that
Deltares created a storm
surge animation that shows
computed storm surge levels
for Super Typhoon Haiyan, which
generated a devastating storm
surge in the Philippines.
© Photo by Benni Thiebes on November 8, 2013
Map 3: Storm Surge Simulation by Deltares
“Super Typhoon Haiyan making landfall near Tacloban, Philippines”
Source: Deltares 18
142nd Edition - GIZ: Assessment of Early Warning Efforts in Leyte for Typhoon Haiyan/Yolanda
The data from JRC and Deltares were not completely consistent. The JRC data indicated a storm
surge South of the eye of the typhoon while Deltares saw this only North of the typhoon. This
seemed to be more realistic than JRC’s calculations. Both are in agreement that the storm surge
was highest in the Tacloban area although the wind speeds were higher in Tolosa and Palo. The
Deltares map seemed to indicate 5 meter storm surge while JRC indicated about half of this (2.3
meter).
The NOAH project published data from a second computer simulation in March 2014. The
maximum water height was 3.76m. The computed inundation area may be close to the actual
inundation in many places, but some areas known to be covered are not included (e.g. the Provincial
Capitol). Map 4 shows the area calculated by NOAH together with the tsunami inundation with
calculated water heights . The tsunami inundation map is regarded to be close to reality by many
residents. This is supported by numerous photos and videos from different places. However, the
actual storm surge area was larger in a number of places than the tsunami hazard map, but by
and large reports about inundation extent and water height is surprisingly consistent with the
PHIVOLCS map with water heights calculated by GIZ.
Map 4: Storm Surge Inundation Area in Southern Tacloban City
Tsunami Hazard
Map modified by
GIZ and NOAH
Simulation map
Shades of red: GIZ
modified tsunami
hazard map (dark:
5m, light: 0m);
blue: NOAH
simulation (dark:
4m, light: 0m);
dark red: roads
from Open Street
Map.
152nd Edition - GIZ: Assessment of Early Warning Efforts in Leyte for Typhoon Haiyan/Yolanda
5.3. Rain and river floods
Compared to the major impact of high wind speeds and storm surge, rain and resulting extreme
events like floods or landslides played a minor role in this disaster. Since the storm and storm
surges rendered most observation instruments useless by either direct damage or destruction or
by cutting off communication lines, relatively little on the ground data were collected. Other
methods (Doppler radar and remote sensing) were tilized to estimate the amount of rain that fell
in connection with the typhoon.
The PAGASA - Tacloban station, recorded rain until 08:00 in the morning21 and most NOAH
rain gauges stopped transmitting data between 6 and 8 am22. Rain gauges of the Province of Leyte
(GIZ supported) gave up at the same time.
© Photo by Ruth Cabangangan on November 8, 2013
Residents brave a chest-deep floodwater around the municipality of Dagami.
162nd Edition - GIZ: Assessment of Early Warning Efforts in Leyte for Typhoon Haiyan/Yolanda
hhhh
GIZ DRAFT-
– Assessment of the Tsunami
GIZ: Assessment Alert Warning
of Early on 31 August 2012
Efforts in Eastern
in Leyte SamarHaiyan/Yolanda
for Typhoon and Leyte
Map 5: Rain in Leyte and Samar from 07.11, 02:00h, to 08.11.2013, 17:00h from TRMM
Map 5: Rain in Leyte and Samar from 07.11, 02:00h, to 08.11.2013, 17:00h from TRMM
Numbers in squares
Numbers in squaresare
are mm rain. 23
mm rain . Background:
Background: map ofmap of the coastline
the coastline of parts of of parts
Leyte andofSamar.
Leyte
and Samar.
The
TheTRMM
TRMMdata datausually underestimate
usually underestimate extreme rain events
extreme and therefore
rain events it is likelyitthat
and therefore the actual
is likely that
the actual
amount amount
of rain was of rain was
higher than higher than thedata.
the displayed displayed data.
However, theHowever,
error of TRMMthe errorisofnormally
TRMM
is normally
not more than not50%.
moreThis
thanmeans
50%.theThis means
rain the rain in
in connection toconnection to Haiyan/Yolanda
Haiyan/Yolanda was not very heavy was
innotcomparison
very heavy in comparison
to many to many
other tropical other
cyclones tropical
making cyclones
landfall in the making
Philippines landfall
in theinpast.
the
Philippines in the past. In Leyte only one place reported rain-induced
In Leyte only one place reported rain-induced flooding. The Poblacion of the town of Dagami flooding. The
Poblacion of the town of Dagami experienced flooding in the morning of 8 November. The
experienced flooding in the morning of 8 November. The water emerged quickly and reached more
water emerged quickly and reached more than 1m height. No suspicious water level
than
changes were No
1m height. suspicious
recorded water level
upstream changesPastrana.
in Tingib, were recorded
Theupstream
PDRRMC in Tingib,
concludedPastrana.
that The
the
PDRRMC concluded that the water must have come from the Southwest
water must have come from the South-west of Dagami (Guinaronga) and not from theof Dagami (Guinaronga)
and
mainnotBinahaan
from the River.
main Binahaan River.
172nd Edition - GIZ: Assessment of Early Warning Efforts in Leyte for Typhoon Haiyan/Yolanda
DRAFT - GIZ: Assessment of Early Warning Efforts in Leyte for Typhoon Haiyan/Yolanda
Map 6: Rain Map 5: Rainfrom
in Leyte in Leyte and Samar
07.11, from 07.11,
02:00h, 02:00h, to 08.11.2013,
to 08.11.2013, 17:00h 17:00h
fromfrom TRMM and TRMM
NOAH
Rain in mmRain
(07.11.13, 02:0002:00
in mm (07.11.13, – 08.11.13,
– 08.11.13, 08:00) with
08:00) with data
data fromfrom
NOAH NOAH
(blue dots(blue dots and
and numbers
with location names)24 and
24 TRMM (07.11.13, 02:00 – 08.11.13, 17:00) for reference (orange dots
numbers with location25names) and TRMM (07.11.13, 02:00 – 08.11.13, 17:00) for
and numbers)
reference (orange dots and numbers) 25
The NOAH 26 26 partly consistent with the TRMM data, but “PSTC Palo” and “NIA
The NOAHrain raindata
datawere are partly consistent with the TRMM data, but “PSTC Palo” and
“NIA dam” are exhibitingvalues
dam” exhibited much lower muchthan expected
lower andthan
values it wasexpected
suspected and
that these devices did not
it is suspected that these
function properly.
devices Furthermore
did not function “Leyte Leyte”
properly. and “Leyte
Furthermore Poblacion”
“Leyte alsoand
Leyte” recorded much
“Leyte lower
Poblacion” also
than expected data and might not have recorded precipitation correctly. The
are much lower than expected and might not have recorded precipitation correctly. Thestations “Pagsanjan”,
“PAGASA“Pagsanjan”,
stations Tac”, and “San“PAGASA
Vicente” recorded
Tac”, data
andin“San
the same range as
Vicente” TRMM. data in the same range
recorded
as TRMM.
Doppler radar data from Mactan, Cebu, showed that the heaviest rainfall in Leyte during Haiyan/
Yolanda happened
Doppler radar datain South
fromofMactan,
the eye ofCebu,
the storm
showafterthat
07:00h.
the It appears that
heaviest the high
rainfall rain during
in Leyte
intensity would have been sufficient to create widespread serious flooding if
Haiyan/Yolanda happened South of the eye of the storm after 07:00h. It appears that theit would have been
sustained.
high rain intensity would have been sufficient to create widespread serious flooding if it
would have been sustained.
182nd Edition - GIZ: Assessment of Early Warning Efforts in Leyte for Typhoon Haiyan/Yolanda
hhhh
GIZ DRAFT-
– Assessment of the Tsunami
GIZ: Assessment Alert Warning
of Early on 31 August 2012
Efforts in Eastern
in Leyte SamarHaiyan/Yolanda
for Typhoon and Leyte
hhhh
GIZ DRAFT-
– Assessment of the Tsunami
GIZ: Assessment Alert Warning
of Early on 31 August 2012
Efforts in Eastern
in Leyte SamarHaiyan/Yolanda
for Typhoon and Leyte
Map 7, 8: Rain from Doppler Radar at 7:00h and 7:10h on 08.11.13
Map 7, 8: Rain from Doppler Radar at 7:00h and 7:10h on 08.11.13
Map 7, 8: Rain from Doppler Radar at 7:00h and 7:10h on 08.11.13
27
Doppler
Doppler radar
radar images fromPAGASA/NOAH.
images from PAGASA/NOAH.Date Date andon
and time time
topon top
left. 27left .
The typhoon moved quickly Westward and after 09:00 there were only
Doppler radar imagesWestward
from PAGASA/NOAH. Date andwere
time only 27 sporadic showers
on top left . showers in Leyte
The typhoon moved
in Leyte werequickly
Haiyan/Yolanda and after
made 09:00
landfall. there sporadic
were Haiyan/Yolanda made landfall.
The typhoon moved quickly Westward and after 09:00 there were only sporadic showers
Map
in 9, 10:
Leyte Rain
were from Doppler Radar
Haiyan/Yolanda at 9:14h and 9:33h on 08.11.13
made landfall.
Map
Map 9, 10: Rain 9, 10:
from Rain from
Doppler Doppler
Radar Radar
at 9:14h at 9:33h
and 9:14h and 9:33h on 08.11.13
on 08.11.13
Doppler radar images from PAGASA/NOAH. Date and time on top left. Source as above.
The Doppler radar is not yet properly calibrated and the amount of rain indicated with
Doppler
Dopplerradar
radarimages
images from PAGASA/NOAH.
from PAGASA/NOAH. DateDate and on
and time time
topon topSource
left. left. Source as above.
as above.
colours is only very approximate and not suitable for quantitative calculations of rain.
The Doppler
The Doppler radar was radar is not
not yet yet properly
properly calibrated
calibrated theand the amount of rain indicated with
Considering PAGASA/NOAH, TRMM and and
Doppler amount of rain
radar data indicated
it appears thatwith colours
there was
colours is only very approximate and not suitable for quantitative calculations of rain.
100-150mm
are only estimates andofnot
rain in the for
suitable central Southern
quantitative part of Leyte
calculations and less than 100mm in the
of rain.
Northern part of the island on 7/8 Nov. 2013. These amounts of rain are small for a
Considering PAGASA/NOAH, TRMM and Doppler radar data it appears that there was
typhoon the size of Haiyan/Yolanda and in Leyte such amounts usually do not cause
100-150mm
Considering of rain in the
PAGASA/NOAH, TRMMcentraland
Southern
Doppler part of Leyte
radar and
data itcausedless than
appeared 100mmwas100-
in the
floods. Only one localized flood was reported and this flood only that
little there
damages.
Northern part of the island on 7/8 Nov. 2013. These amounts of rain
150mm of rain in the central Southern part of Leyte and less than 100mm in the Northern part are small for of
a
typhoon the size of Haiyan/Yolanda and in Leyte such amounts usually do not cause
the islandfloods.
on 7/8 Nov.
Only 2013.
one Theseflood
localized amounts of rain were
was reported small
and this forcaused
flood a typhoon
only the
littlesize of Haiyan/
damages.
Yolanda and in Leyte such amounts usually do not cause floods. Only one localized flood was
Page | 17
reported and this flood caused only little damages.
Page | 17
192nd Edition - GIZ: Assessment of Early Warning Efforts in Leyte for Typhoon Haiyan/Yolanda
5.4. Landslide
A few landslides were observed in municipalities in Eastern Leyte. They appeared to be relatively
small in size and there are no reports of casualties from landslides or major damages. None of the
officials interviewed by GIZ reported landslides.
5.5. Summary concerning the event
At the time of writing this report most, but not all aspects of the natural extreme event that
happened in Leyte on 8 November 2014 could be described in detail. The following facts appear
to be certain:
A. At 07:00 h on 08.11.2013 the eye of the typhoon arrived in the Tolosa area heading
West.
B. The maximum sustained windspeed at this time in Tanauan/Palo was approximately
271 km/h with on-shore wind direction. This is worldwide and historically one of
the highest windspeeds of typhoons ever making landfall.
C. The maximum wind speed slowed down to 258 km/h at around 09:00h when the
eye of Haiyan/Yolanda left Leyte to the West.
D. South of Tolosa the maximum wind speed was 231km/h and the direction was off
shore.
E. The storm surge was highest in the Tanauan, Palo, Tacloban area, but the actual
height has not been measured and estimations are between 2.3 and 5m.
F. Rains of 100-150mm fell in the central parts of Leyte, but in the Northern parts of
Leyte it was less than 100mm. This is unusually low for a strong typhoon.
G. Only one river flooding event is known (in Dagami) and no significant landslides
were recorded.
6 Risk knowledge
Professionals dealing with risks connected to natural hazards can access an array of sources of
information describing hazards, vulnerabilities and to some extent risks. Apparently not all persons
tasked with disaster risk management in a professional way are aware of all information available
or if they are they seem to utilize such information only to a limited degree.
Some information about risks, like the 1:50,000 hazard maps of the READY project, were
provided to LGUs, specifically the Disaster Risk Reduction and Management Officers. However,
for other information, the persons in charge would have to actively search for it from different
sources inside and outside of the Philippines. It seems that only few DRRMOs do that and, as
such, relatively small part of relevant information available is known to them.
202nd Edition - GIZ: Assessment of Early Warning Efforts in Leyte for Typhoon Haiyan/Yolanda
Obviously some political decision makers were not fully aware of different natural hazards. For
example, one Councilor said “It was not a storm surge; it was definitely a tsunami.”28 Even if
information was present (e.g. READY hazard maps) some officials tasked with disaster management
did not utilize it 29, 30. The same applies to some members of the national government who
awaited the typhoon in Tacloban and became initially victims themselves without any means of
communication 31.
Because risk knowledge was limited, the utilization of such knowledge was naturally also limited.
This lead to inadequate (or no) actions by responsible disaster managers. Only parts of the people
in the storm surge area were evacuated and many of those who remained in their homes died. Even
evacuation centres became into death traps as they were located in the inundation area 32,33.
Citizens are not expected to do their own research into sources of information about hazards.
They have to rely on what government officials and media tell them. However, the most reliable
source of knowledge for many citizens is apparently their own experience. They are able to relate
to frequently occurring hazard events like river floods or average type of typhoons but not so much
to rarely happening events with return periods far beyond normal expected lifetime. For those rare
events media or official information must play a crucial role. This is apparent for tsunamis. No
significant tsunami hit the Eastern coast of Leyte within living memory but the media coverage of
the tsunamis in the Indian Ocean in 2003 and in Japan in 2011 raised the awareness of the dangers
of a tsunami considerably.
6.1. Storm
PAGASA did not publish a wind/
storm hazard map for Region 8 of
the Philippines yet, but there are a
number of other sources of information
available.
CAPRA (Central American Probabilistic
Risk Assessment) published a
worldwide Wind / Storm Hazard map
in GIS format34. GIZ converted this
to printable maps. Examples covering
Leyte are shown in Maps 11, 12 for
100 and 250 years return periods.
© Photo by Brenda Samson on November 9, 2013
Commercial buildings such as the Metro Supermarket were destroyed
after Super Typhoon Haiyan battered Tacloban city.
212nd Edition - GIZ: Assessment of Early Warning Efforts in Leyte for Typhoon Haiyan/Yolanda
DRAFT - GIZ: Assessment of Early Warning Efforts in Leyte for Typhoon Haiyan/Yolanda
Map 11, 12: Storm Hazard from CAPRA
Map 11, 12: Storm Hazard from CAPRA
Return
Return Period
Period ofof 100
100 years
years Return Periodof of
Return Period 250250 35 35
years
years
Isolines
Isolines of windspeed
of wind speed calculated
calculated by GIZ.
by GIZ.
The CAPRA maps show that the Eastern coast of Leyte lies in the area of a 100 years
return period of Saffir Simpson Category 4 and in the 250 years return period of a
The CAPRA5 maps
Category show
storm. thatmeans
This the Eastern coast of Leyte
a tropical cyclonelies like
in theHaiyan/Yolanda
area of a 100 yearsisreturn period
statistically
of Saffir Simpson
expected once inCategory 4 andHowever,
250 years. in the 250the
years return period
calculated of a for
speeds Category 5 storm.
Eastern Leyte This meansa
suggest
a tropical
return cyclone
period liketoHaiyan/Yolanda
closer 200 years. is statistically expected once in 250 years. However, the
calculated speeds for Eastern Leyte suggest a return period closer to 200 years.
Manila Observatory published a typhoon risk map. It is a qualitative map comparing the
risk
Manilaof Observatory
different provinces
published but not giving
a typhoon indications
risk map. of probabilities
It is a qualitative or categories
map comparing of
the risk of
typhoons.
different provinces but it does not provide indications of probabilities or categories of typhoons.
A cargo ship washed
ashore after super Typhoon
Haiyan hit Anibong town,
Tacloban city.
Barangay Anibong, Tacloban, 16.12.2013
222nd Edition - GIZ: Assessment of Early Warning Efforts in Leyte for Typhoon Haiyan/Yolanda
hhhh
GIZ DRAFT-
– Assessment of the Tsunami
GIZ: Assessment Alert Warning
of Early on 31 August 2012
Efforts in Eastern
in Leyte SamarHaiyan/Yolanda
for Typhoon and Leyte
Map 13: Typhoon Risk Map by Manila Observatory
Map 13: Typhoon Risk Map by Manila Observatory
GIZ analysedGIZhistorical typhoons
analysed historical in Region
typhoons in Region 88 by
bycalculating
calculating windand
wind speeds speeds
countingand counting the
the times
imes the same wind
the same wind speed
speed hit hit an Reference
an area. area. Reference
period was theperiod was Itthe
last 60 years. last 60 that
is noteworthy years. It is
no tropical
noteworthy that cyclone of cyclone
no tropical Saffir Simpson Category
of Saffir 5 hit the Eastern
Simpson CategoryVisayas5during theseEastern
hit the 60 Years. Visayas
Therefore the map displaying SSS5 is blank (Map 14).
during these 60 Years. Therefore the map displaying SSS5 is blank (Map 14).
232nd Edition - GIZ: Assessment of Early Warning Efforts in Leyte for Typhoon Haiyan/Yolanda
DRAFT - GIZ: Assessment of Early Warning Efforts in Leyte for Typhoon Haiyan/Yolanda
Map 14: Historical Wind Speeds in Region 8 by GIZ
Map 14: Historical Wind Speeds in Region 8 by GIZ
SSS:
SSS: Saffir
Saffir Simpson Scale
Simpson Scale
The GIZ generated map is a historic map and not a hazard map displaying future
The probabilities,
GIZ-generated butmap is a historic
in hazard mapping mapit isand not a hazard
generally accepted mapthatdisplaying future
historic maps canprobabilities.
serve
However, in hazard
as probability mapping
maps for the itsame
is generally accepted
future time period that historic
as the analysedmaps can serve
period. as probability
This means a
similar wind speed distribution could be expected for the next 60 years.
maps for the same future time period as the analysed period. This means a similar wind speed The non-
occurrence
distribution of be
could SSS5 in 120foryears
expected does60not
the next contradict
years. the CAPRA maps.
The non-occurrence of SSS5The
in 200
120 year
years does
return period of CAPRA is consistent with GIZ’s findings.
not contradict the CAPRA maps. The 200 year return period of CAPRA is consistent with GIZ’s
findings.
The reinsurance
The company
reinsurance MunichRe
compa-
ny MunichRe
published published
a tropical
a tropical storm hazard
storm hazard map for
map typhoons with a with
for typhoons return
period of 100 years
a return period of 100
(Map 15). The Pacific
yearscoast
(Map 15). The
of Leyte is in
Pacific
Zone coast of Leyte
4. This meansis a
storm4. of
in Zone ThisSSS5
meansis
expected to be less
a storm of SSS5 is ex-
frequent than once in
pected
100 toyears.
be less frequent
than once in 100 years.
Looting in Tacloban on 09.11.13, Photo by Brenda Samson
People driven to desperation
looted business establishments
Page
for| 22
food in Tacloban city. © Photo by Brenda Samson on November 9, 2013
242nd Edition - GIZ: Assessment of Early Warning Efforts in Leyte for Typhoon Haiyan/Yolanda
Map 15: Tropical Storm Hazard by MunichRe
All four sources are consistent in seeing Leyte to be less likely to be hit by strong storms than more
Northern provinces. From the CAPRA and MunichRe maps it may be concluded that the return
period for storms with wind speeds as Haiyan/Yolanda have a return period of about 200 years in
Eastern Leyte.
6.2. Storm surge
Only one source of storm surge hazard maps is known. This scarcity probably indicates that this
hazard was underestimated in the past. In the context of the READY project PAGASA published
storm surge hazard maps (Maps 16, 17).
The city was turned
into a “ghost-town”
after Typhoon Haiyan
has broken downtown
Tacloban and its
people.
25DRAFT - GIZ: Assessment of Early Warning Efforts in Leyte for Typhoon Haiyan/Yolanda
2nd Edition - GIZ: Assessment of Early Warning Efforts in Leyte for Typhoon Haiyan/Yolanda
Map 16: Storm Surge Hazard Map for Tacloban
Map 16: Map
Storm Surge
16: Storm SurgeHazard Map
Hazard Map for Tacloban
for Tacloban
Map 17:
Map 17: Strom Strom Hazard
Surge Surge Hazard
MapMap covering
covering Palo,Palo,
Tanauan, Tolosa
Tanauan, Tolosa
Map 17: Strom Surge Hazard Map covering Palo, Tanauan, Tolosa
262nd Edition - GIZ: Assessment of Early Warning Efforts in Leyte for Typhoon Haiyan/Yolanda
Interestingly the storm surge hazard maps by PAGASA only display inundation areas for 1-4 meter
surges, but not for lower and higher surges although these are indicated in the legend of the
map (enlarged inset). For a reader of the map it might be difficult to judge whether the lack of
4-12 meter inundations on the actual map mean that this is not expected to happen in this area
or whether it was omitted for some other reason. According to JRC, NOAH and Deltares (see
chapter The Disaster Event) the water height during the Haiyan storm surge was in the range of
2.3 -5 meter. With this it appears that the hazard map of PAGASA underestimated the possible
inundation area for a surge of this magnitude.
The PAGASA maps only included up to 4 meter water heights, but the forecast of PAGASA for the
Haiyan surge height was 7 meter. Therefore it would appear to be reasonable consulting the hazard
maps for a similar hazard, the tsunami, where higher wave heights (4-5 meter) were used as a basis
for the inundation area.
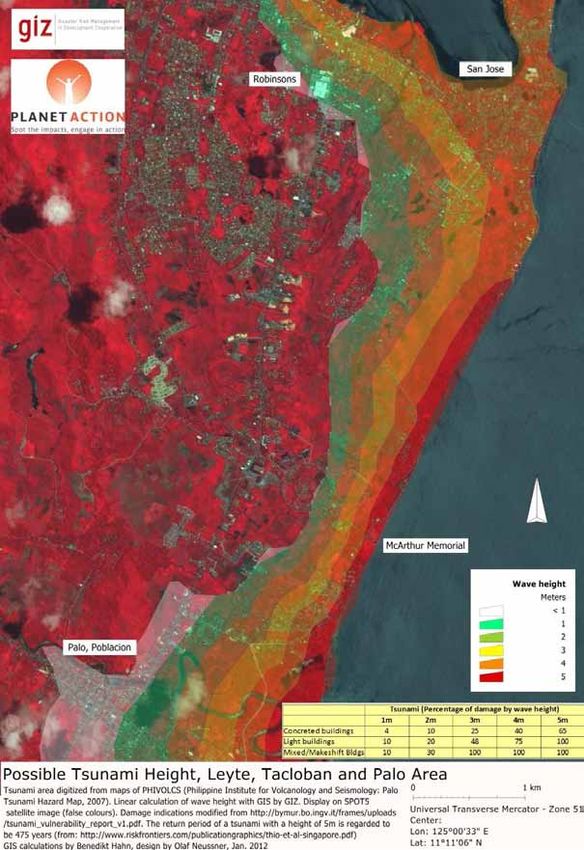
PHIVOLCS contributed tsunami hazard maps for the Eastern coast of Leyte (Maps 18, 19).
The maps do not display the height of the water in the inundated area but there are points in the
ocean indicating wave heights in a certain area. In the area of interest the height is 4-5 meter. This
happens to be comparable to the height of the storm surge caused by Haiyan/Yolanda.
Map 17, enlarged detail
Enlarged part of the legend of PAGASA storm surge
hazard
A tangled mess of
destroyed houses,
piles of debris and
toppled trees a day
after super typhoon
Haiyan hit Tacloban. © Photo by Brenda Samson on November 9, 2013
27Map 18: Tacloban Tsunami Hazard Map by PHIVOLCS
2nd Edition - GIZ: Assessment of Early Warning Efforts in Leyte for Typhoon Haiyan/Yolanda
Map 18: Tacloban Tsunami Hazard Map by PHIVOLCS
Map 18: Tacloban Tsunami Hazard Map by PHIVOLCS
Map 19: Tsunami Hazard Map covering Palo, Tanauan, Tolosa by PHIVOLCS
Map 19: Tsunami Hazard Map covering Palo, Tanauan, Tolosa by PHIVOLCS
Map 19: Tsunami Hazard Map covering Palo, Tanauan, Tolosa by PHIVOLCS
28hhhh
GIZ DRAFT-
– Assessment of the
2ndTsunami
GIZ: Assessment
Editionof Alert
Early
- GIZ: on 31 August
Warning
Assessment Efforts
of Early 2012 in Eastern
in Leyte
Warning Efforts for Samar
Typhoon
in Leyte and Leyte
Haiyan/Yolanda
for Typhoon Haiyan/Yolanda
Map 20: Tsunami Hazard Map produced by Tacloban City
Map 20: Tsunami Hazard Map produced by Tacloban City
The
The PHIVOLCS
PHIVOLCS map map was slightly
was slightly modified
modified by the City ofby the City
Tacloban of Tacloban in 2012.
in 2012.
On
Onthe
the basis
basis ofofthis
thismap
map GIZ
GIZ calculated
calculated inundation
inundation heights
heights and displayed
and displayed this with
this in maps in maps
the with
the background
background of a satellite
of a satellite image.
image. This mapThis
was map
given was
to thegiven toTacloban
City of the Cityfor
of Tacloban
reference. for
Page29| 27DRAFT - GIZ: Assessment of Early Warning Efforts in Leyte for Typhoon Haiyan/Yolanda
2nd Edition - GIZ: Assessment of Early Warning Efforts in Leyte for Typhoon Haiyan/Yolanda
reference.
Map 21: Tsunami Hazard Map of Southern Tacloban by GIZ
Map 21: Tsunami Hazard Map of Southern Tacloban by GIZ
Most LGU
Most LGU officials
officialstasked withwith
tasked disaster management
disaster in the coastal
management LGUs
in the said they
coastal LGUschecked
said they
checked hazard maps to determine who needs to be evacuated and which Only
hazard maps to determine who needs to be evacuated and which evacuation centres are safe. evacuation
two out of ten interviewees said they did not check this. The respondents who stated that they
Page | 28verified the location of evacuation centres include Tacloban and Palo. In both places many people
died from the storm surge in evacuation centres.
302nd Edition - GIZ: Assessment of Early Warning Efforts in Leyte for Typhoon Haiyan/Yolanda
GIZ interviewed 29 coastal residents in early December 2013. Nine of them said they either did
not know whether their houses were in potential storm surge areas or they assumed it was not (e.g.
500 meter from shore). This means approximately a third of those people whose houses were most
likely in storm surge hazard areas were not aware of this fact.
6.3. Rain and river floods
The MGB published a flood hazard map for the province of Leyte in 2007 (Map 23). This map
displays rain induced floods and not storm surge. It does not quantify the flood hazard in terms
of probability or water height. It appears that the map needs some verification. Community based
mapping efforts in some LGUs revealed discrepancies to the MGB map. According to accounts
of communities flood prone areas are often smaller than the map of MGB indicates. This applies
especially to beaches which are not flood prone, but in some case barangay residents also identified
areas as flood prone which are not marked on the MGB map.
© Photo by Ruth Cabangangan on November 8, 2013
Houses submerged in floodwaters in the aftermath of Typhoon Haiyan in the town of Dagami.
31DRAFT - GIZ: Assessment of Early Warning Efforts in Leyte for Typhoon Haiyan/Yolanda
2nd Edition - GIZ: Assessment of Early Warning Efforts in Leyte for Typhoon Haiyan/Yolanda
Map 23: Flood Hazard Map by MGB
Map 23: Flood Hazard Map by MGB
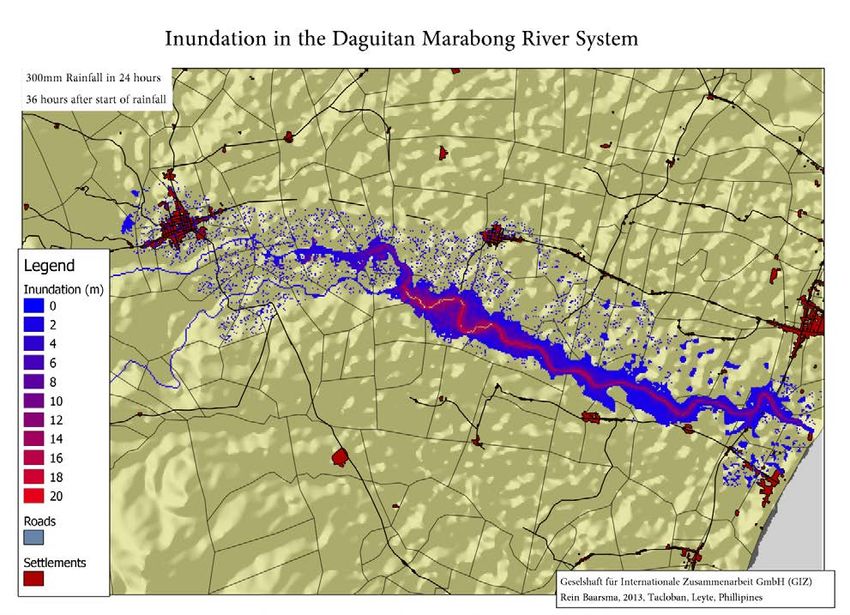
GIZsupported
GIZ supported the
thedevelopment
development of computerized flood flood
of computerized modelsmodels
in four in
rivers
fourin rivers
Leyte. in
Two of Two
Leyte.
the finished models cover watersheds affected by Haiyan/Yolanda on the East coast of Leyte. The
models cover most parts of Mahaplag, Abuyog, Javier, Burauen, Julita, and Dulag (Maps 24, 25).
Page | 30
32of the finished models cover- GIZ:
2nd Edition watersheds
Assessment ofaffected byEfforts
Early Warning Haiyan/Yolanda
in Leyte for Typhoonon the East coast of
Haiyan/Yolanda
Leyte. The models cover most parts of Mahaplag, Abuyog, Javier, Burauen, Julita, and
Dulag (Maps 24, 25).
Map 24: Modelled Flood in the Daguitan-Marabong Watersheds
Map 24: Modelled Flood in the Daguitan-Marabong Watersheds
© Photo by Ruth Cabangangan on November 8, 2013
Flooding
Submerged in floodwaters
cars sit in Dagami on 08.11.13,
in the 14:00h,
aftermath of Typhoon Photo
Haiyan inby
theRuth Cabangangan
town of Dagami.
Page | 3
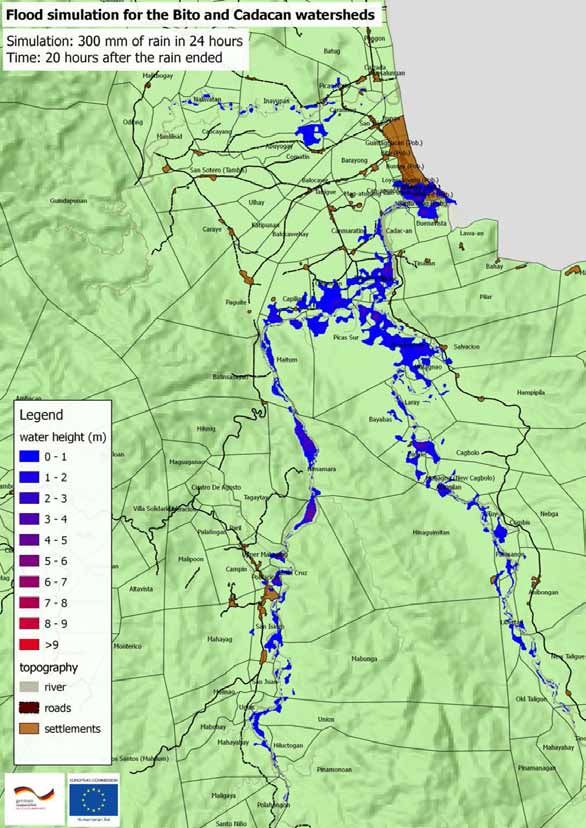
332nd Edition - GIZ: Assessment of Early Warning Efforts in Leyte for Typhoon Haiyan/Yolanda
DRAFT - GIZ: Assessment of Early Warning Efforts in Leyte for Typhoon Haiyan/Yolanda
Map 25: Modelled Flood in the Cadac-an - Bito Watersheds
Map 25: Modelled Flood in the Cadac-an - Bito Watersheds
Sets of maps with time steps of different rain scenarios were handed over to the operation centres
Sets of maps with
of the Localtime
Floodsteps of different
Early Warning Systemsrain scenarios
of the were
respective river handed over to the operation
systems.
centres of the Local Flood Early Warning Systems of the respective river systems.
342nd Edition - GIZ: Assessment of Early Warning Efforts in Leyte for Typhoon Haiyan/Yolanda
6.4. Landslides
The Mines and Geoscience Bureau (MGB) published a map displaying the susceptibility to rain-
induced landslides in three categories, high, moderate and low (Map 22). The map of MGB does
not quantify
hhhh the danger of the different categories, therefore estimations of the danger in these areas
GIZ DRAFT-
are difficult.–Based
Assessment
on of the Tsunami
GIZ:historic Alert Warning
landslides
Assessment of Early on Leyte
in 31 August
GIZ 2012
Efforts in Eastern
inestimated
Leyte Samar
that and
the
for Typhoon Leyte
probability
Haiyan/Yolanda of an actual
landslide happening is approximately 1:2500 for the high susceptibility area.
The mapIn ofcase
MGB of a strong typhoon excessive rains may be expected and precautions for people
shows that most of Leyte is landslide prone, though to varying degrees. In case
in these areas are advisable. At least the amount of rain falling should be observed. In
of a strong
case typhoon excessive
it is unusually highrains
(e.g. may beinexpected
80 mm 3 hours) and precautions
evacuation to less for peopleprone
landslide in these
areasareas are
advisable.is At least recommended.
strongly the amount of rain falling should be observed. In case it is unusually high (e.g.
80 mm in 3 hours) evacuation to less landslide prone areas is strongly recommended.
Map 22: Rain Induced Landslide Susceptibility by MGB
Data (shape files) from MGB based on survey from 2007. Corrections for consistency by
GIZ. Map 22: Rain Induced Landslide Susceptibility by MGB
Data (shape files) from MGB based on survey from 2007. Corrections for consistency by GIZ.
352nd Edition - GIZ: Assessment of Early Warning Efforts in Leyte for Typhoon Haiyan/Yolanda
6.5. Vulnerabilities
Vulnerability is defined as the characteristics and circumstances of a community, system or
asset that -makes
DRAFT it susceptible
GIZ: Assessment to Warning
of Early the damaging
Efforts ineffects of Typhoon
Leyte for a hazardHaiyan/Yolanda
(from UNISDR: UNISDR
Terminology on Disaster Risk Reduction (2009)). Here the physical dimension of vulnerability
and the social dimension are discussed in some detail.
6.5. Vulnerabilities
Vulnerability is defined as the characteristics and circumstances of a community, system
Physical
or asset assets include
that makes different forms
it susceptible to theofdamaging
land use effects
like forests, agricultural
of a hazard (fromcrops and build-up
UNISDR:
areas,
UNISDR including infrastructure.
Terminology on DisasterTheir vulnerability
Risk Reduction is described
(2009)). Here thebyphysical
vulnerability curves
dimension of showing
vulnerability and the social dimension are discussed in some detail.
the degree of damage caused by different levels of the hazard. In the context of casualties caused
by Haiyan/Yolanda
Physical thedifferent
assets include vulnerability
forms curves
of land for
usebuildings areagricultural
like forests, important.cropsTheyand
should
build-be specific
for typicalincluding
up areas, Philippines buildings,Their
infrastructure. but unfortunately relatively few
vulnerability is described locally adjusted
by vulnerability curvesdata exist.
showing the degree of damage caused by different levels of the hazard.
However, available data can be used in the absence of more locally adjusted data. GIZIn the context of compiled
casualties caused by Haiyan/Yolanda the vulnerability curves for buildings are important.
physical vulnerability data for many hazards and they are displayed in Appendix 2 for the two
They should be specific for typical Philippines buildings but unfortunately relatively few
main
locallyhazards
adjustedindata
connection to Haiyan/Yolanda,
exist. However, available data givehighindications
winds and andstorm
can be surge.
usedThe data give a
in the
good
absence of more locally adjusted data. GIZ compiled physical vulnerability data for many caused
indication that the forecasted wind speeds and storm surge heights would have
hazards and
damages they
up to 80%areofdisplayed in Appendix
the exposed assets. 2 for the two main hazards in connection to
Haiyan/Yolanda, high winds and storm surge. The data give a good indication that the
forecasted wind speeds and storm surge heights would have caused damages up to 80%
Storms with wind
of the exposed speeds of more than 250km/h are known to cause major damages on buildings.
assets.
Many residential dwellings are made of light materials particularly vulnerable to high winds. An
Storms with
example of awind
mapspeeds of more
with such than 250km/h
dwellings are in
is displayed known
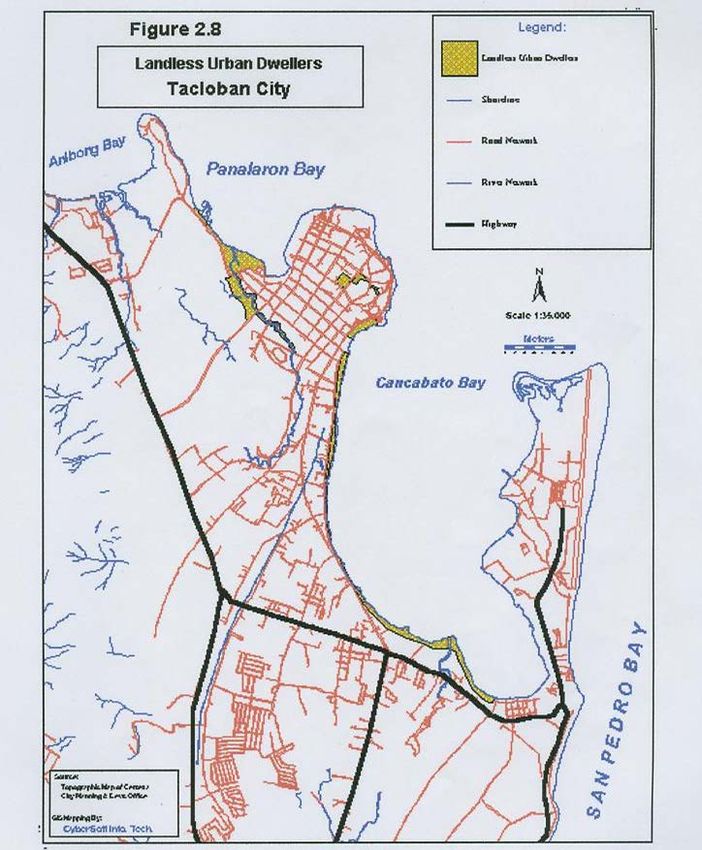
Mapto26.
cause major damages on
buildings. Many residential dwellings are made of light materials particularly vulnerable to
high winds. An example of a map with such dwellings is displayed in Map 26.
© Photo by Benni Thiebes on November 8, 2013
Paterno Street,
Debris lines theTacloban,
streets of 08.11.13,
Paterno inPhoto by Benni
Tacloban ThiebesHaiyan.
after Typhoon
36
Page | 342nd Edition - GIZ: Assessment of Early Warning Efforts in Leyte for Typhoon Haiyan/Yolanda
hhhh
GIZ DRAFT-
– Assessment of the Tsunami
GIZ: Assessment Alert Warning
of Early on 31 August 2012
Efforts in Eastern
in Leyte SamarHaiyan/Yolanda
for Typhoon and Leyte
Map 26: Informal Settlements in Tacloban
Map 26: Informal Settlements in Tacloban
It is noteworthy that this map of Tacloban is not up to date. In November 2013 the extent of
It is noteworthy that this map of Tacloban is not up to date. In November 2013 the extent of
informal urban settlements with light material was considerably bigger than indicated in
Mapinformal
26. urban settlements with light material was considerably bigger than indicated in Map 26.
A special
A special concernisisthe
concern the vulnerability
vulnerability of of evacuation
evacuation centres. According
centres. to different
According hazard hazard
to different maps
(PAGASA: storm surge; PHIVOLCS: tsunami) a number of them
maps (PAGASA: storm surge; PHIVOLCS: tsunami) a number of them were located within were located within these hazard
theseareas and should
hazard areashave andbeen especially
should have retrofitted to shelterretrofitted
been especially persons from waves and
to shelter high water
persons from
waveslevels
and(e.g. builtwater
high on very strong(e.g.
levels stilts). It appears
built on very that they were
strong not Itdesigned
stilts). appearsto host
that people seeking
they were not
protection from storm surges or tsunamis as most of them were single
designed to host people seeking protection from storm surges or tsunamis as most of floor buildings without stilts.
themAnwere
exception
single is the
floorAstrodome
buildingsin without
Tacloban.stilts.
It is higher than expected
An exception is thewater levels, but in
Astrodome people were
Tacloban.
It is higher than expected water levels, but people were also hosted in the ground floor.
also hosted in the ground floor.
372nd Edition - GIZ: Assessment of Early Warning Efforts in Leyte for Typhoon Haiyan/Yolanda
DRAFT - GIZ: Assessment of Early Warning Efforts in Leyte for Typhoon Haiyan/Yolanda
According to eye witnesses
According some
to eye witnesses of ofthem
some themdrowned.
drowned.
Map 27: Selected EvacuationMap 27: Selected
Centres Evacuation Centres in Tacloban
in Tacloban
36
Shades ofShades
blue: of
Water heightheight
blue: Water calculated
calculatedbybyGIZ
GIZfromfrom tsunami hazard
tsunami hazard mapmap (0-5m)
(0-5m) 36, green, green
pentagons:pentagons:
evacuation centres,
evacuation grey
centres, greylines: roads
lines: roads (from
(from OpenOpen
Street Street
Map) Map)
At least four evacuation
At least centres
four evacuation lie lie
centres in the
in thetsunami hazard
tsunami hazard area
area and and they
they are notare not retro-fitted
retro-fitted to
to withstand
withstand tsunamis or storm surges. Several evacuation centres in other LGUs were also located were
tsunamis or storm surges. Several evacuation centres in other LGUs
also located in the
in the tsunami
tsunami hazard hazard
area (e.g. area (e.g. San
San Joaquin Joaquin
Central School inCentral School
San Joaquin, Palo)inand
San Joaquin,
many
Palo) and people
manydied people
there.died there.
The Regional
The Regional Office
Office of of Civil
Civil Defence
Defence (OCD)was
(OCD) was asked
asked by by
the the
OCDOCDHead Head
Office in ManilaintoManila
Office
checksafety
to check the the safety
of of thelocation
the location ofofevacuation
evacuationsites insites
relation
in to natural hazards
relation (see Appendix
to natural hazards (see
1). OCD Region 8 told GIZ that this check was carried out together with DPWH, MGB and
Appendix 1). OCD Region 8 told GIZ that this check was carried out together with DPWH,
DOH, led by OCD. Results of such checks are not known to GIZ. The utilization of many
MGB and evacuation
DOH, ledsitesbyduring
OCD.Haiyan/Yolanda
Results of such checks are not known to GIZ. The utilization
in hazardous areas suggested that the check was either
of many evacuation
not carried outsites during manner
in a responsible Haiyan/Yolanda
or did not leadintohazardous
adequate actionareas suggests
by responsible that the
offices.
check was either not carried out in a responsible manner or did not lead to adequate
action by responsible offices. As many people reportedly died from the storm surge in
these
38 evacuation sites this appears to be a major omission or misjudgement with deadly
consequences.You can also read