Assessment of Green Recovery Plans after Covid-19
←
→
Page content transcription
If your browser does not render page correctly, please read the page content below
We Mean Business Coalition

Assessment of Green Recovery
Plans after Covid-19

  Final Report               September   Cambridge Econometrics   info@camecon.com
                             2020        Cambridge, UK            www.camecon.com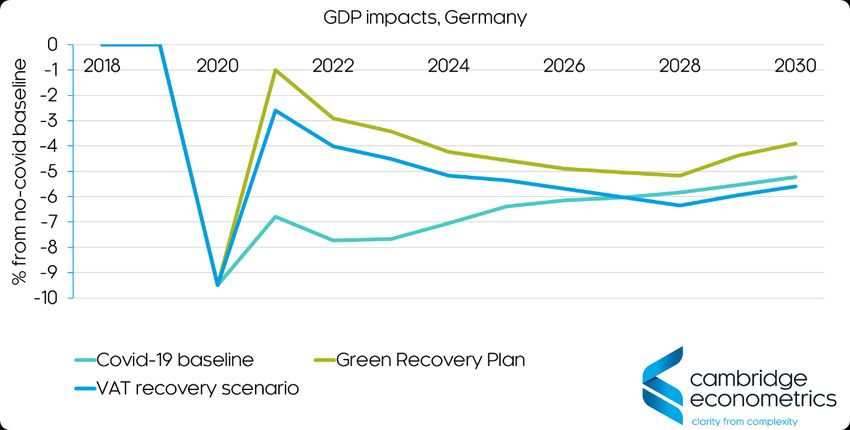
Assessment of Green Recovery Plans after Covid-19

Contact person:            Hector Pollitt, hp@camecon.com

    Cambridge Econometrics’ mission is to provide clear insights, based on rigorous and independent
   economic analysis, to support policy-makers and strategic planners in government, civil society and
                    business in addressing the complex challenges facing society.

                         Cambridge Econometrics Limited is owned by a charitable body,
                             the Cambridge Trust for New Thinking in Economics.
                                       www.neweconomicthinking.org

Cambridge Econometrics                                                                                             2
Contents

                                      Page

1   Covid-19 and the Green Recovery      5

2   Global Results                       8

3   Results for the EU                  11

4   Results for Germany                 14

5   Results for Poland                  17

6   Results for the UK                  20

7   Results for the US                  23

8   Results for Japan                   26

9   Results for India                   29

10 Overall Conclusions                  32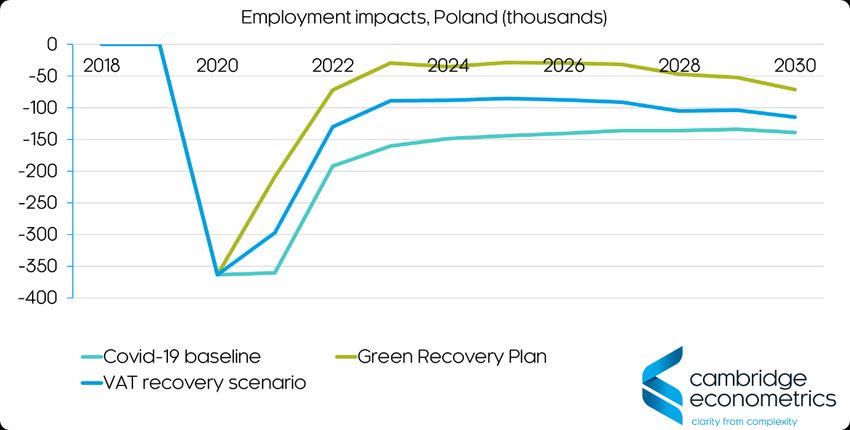
Assessment of Green Recovery Plans after Covid-19

                Executive Summary

 Background     It is now clear that Covid-19 is going to result in a substantial economic cost,
     context    in terms of both GDP and lost jobs, in the first half of the 2020s. In most
                countries, the economic recovery will not be immediate and much of the lost
                output will never be made up. The model results presented in this report
                suggest that labour markets may not start to recover until the mid-2020s.
                This report assesses two recovery plans that could boost both GDP and
                protect jobs. The first plan follows a ‘return to normal’ approach by reducing
                VAT rates and encouraging households to resume spending. The second plan
                is a ‘Green’ Recovery Plan that aims to boost economic activity while
                simultaneously reducing CO2 emissions.
   The Green    Both plans have the same cost to government. The Green Recovery Plan
Recovery Plan   includes a (smaller) reduction in VAT and otherwise consists of:
                •   Public investment in energy efficiency
                •   Subsidies for wind and solar power
                •   Public investment in upgrading electricity grids
                •   A car scrappage scheme in which subsidies are only provided to electric
                    vehicles
                •   A tree planting programme
 Key findings   The two recovery plans were assessed using Cambridge Econometrics’ E3ME
                macroeconomic model. The key findings are:
                • Both recovery plans provide immediate boosts to output and employment,
                  but the impact is consistently larger in the Green Recovery Plan. The
                  Green Recovery Plan may also provide long-term economic benefits.
                • The VAT recovery plan is effective at increasing consumer spending but
                  does not increase investment by much. A broader set of policies, such as in
                  the Green Recovery Plan, is required to increase production and jobs
                  across the whole economy.
                • Although Covid-19 may reduce global CO2 emissions substantially in 2020,
                  by 2030 the reduction is expected to be only 2%. The VAT recovery
                  scenario would not reduce emissions further. The Green Recovery Plan
                  could reduce emissions by a further 7% globally. While not enough to be
                  consistent with the Paris Agreement, this reduction would provide a starting
                  point for further policy.
                • All five environmental policies boost GDP and employment. The car
                  scrappage scheme has the largest overall impacts on GDP and
                  employment up to 2030. However, it does not always provide the largest
                  reduction in emissions, especially in countries that still use coal to generate
                  electricity. Some tailoring of policies is therefore needed at national level.
                This report presents the model results at global level, EU level and for six
                countries. In all countries the Green Recovery Plan produces the best results
                for GDP, employment and emission reductions. The results suggest there is a
                strong case for including the policies listed above in national responses to
                Covid-19.

                Cambridge Econometrics                                                                  4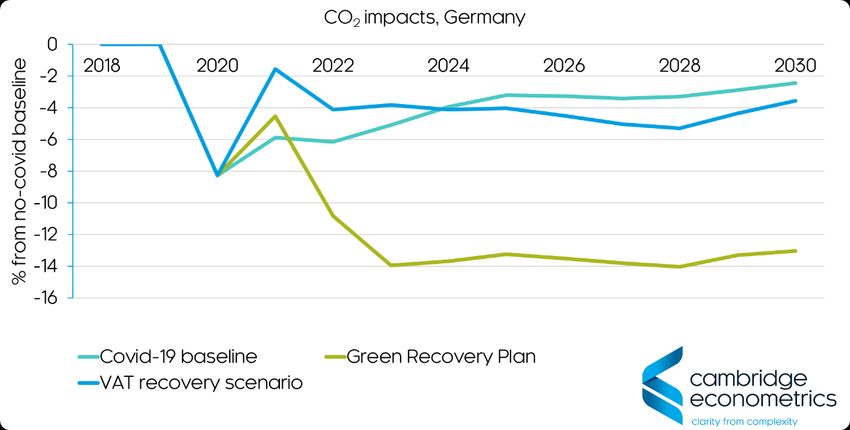
Assessment of Green Recovery Plans after Covid-19

                   1           Covid-19 and the Green Recovery

                   1.1         The economic impacts of Covid-19
‘Unprecedented’    As 2020 has progressed, the economic impacts of Covid-19 have become
  economic cost    clearer. Falls in production have been unprecedented. Millions of people
                   around the world have come to rely on government support mechanisms.
                   The effects of the pandemic have been quite different to those of the global
                   financial crisis. The sectors impacted are primarily those that serve
                   consumers, especially in ‘social’ sectors such as hospitality, although falls in
                   investment have now made the impacts much wider. However, the scale and
                   nature of the impacts has meant that no sector has been left unaffected.
                   The modelling of Covid-19 in this report builds on the approach developed by
                   Cambridge Econometrics in mid-20201. The scenario has been updated to
                   take in more recent information, with the macro level outcomes for each
                   country remaining similar to those predicted by the IMF2.
                   Although Covid-19 continues to cause economic damage, thoughts are now
                   turning to ‘what next’? Eventually, government support schemes will transition
                   to economic recovery measures. But the nature of the recovery is also
                   important, with impacts that could last well beyond the current short-term
                   timeframe that policy makers are currently focusing on.
  The costs of a   At the same time, the effects of climate change are becoming increasingly
changing climate   obvious worldwide. The costs of both meeting the climate challenge are
                   considerable. However, if large amounts of public spending are required
                   anyway, why not direct it towards reducing our carbon footprints?
                   This question is the reason that the We Mean Business coalition, among
                   others, have called for a Green Recovery Plan to Covid-19. This report
                   assesses whether it is possible to have such a recovery plan that is effective
                   at reducing greenhouse gas emissions while simultaneously boosting incomes
                   and employment.

                   1.2         Assessing a green recovery plan

                   We use Cambridge Econometrics E3ME macroeconomic model3 to assess the
                   socio-economic and environmental impacts of such a green recovery plan.
                   Four scenarios are developed to carry out the assessment:
                   •      A pre-covid ‘business as usual’ base case
                   •      No recovery plan (Covid-19 baseline case)
                   •      A VAT recovery scenario (VAT rates reduced by five percentage points
                          worldwide4)

                   1
                       https://www.e3me.com/developments/economic-impacts-coronavirus-e3me/
                   2
                       https://www.imf.org/en/Publications/WEO/Issues/2020/06/24/WEOUpdateJune2020
                   3
                       https://www.e3me.com
                   4
                       Sales taxes in the US.

                   Cambridge Econometrics                                                                             5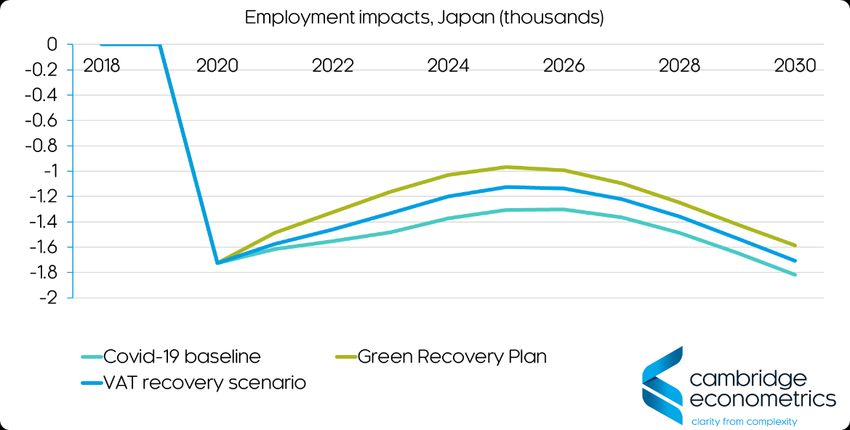
Assessment of Green Recovery Plans after Covid-19

                     •      The Green Recovery Plan (see below)

                     The level of support in both the VAT and green recovery packages remains in
                     full force over the period 2021-2023, and is gradually phased out over time as
                     the global economy recovers from the effects of Covid-19.
                     When presenting results in the following sections, we show the impacts as
                     deviations from the pre-covid base case, so that the charts show both the
                     impacts of Covid-19 and how the recovery packages mitigate these impacts.

                     1.3         The Green Recovery Plan
                     The Green Recovery Plan in this report consists of five distinct policies,
                     described in turn below. These five policies are combined with a more
                     conventional measure (VAT cuts) to provide an economic stimulus that
                     reduces job losses over the period 2021-2024.
                     The recovery plan is additional to any government support measures that
                     have already been implemented during the pandemic (these measures are
                     included in all the scenarios except the pre-covid baseline).
Increased energy     Due to inertia and long-lived capital stock, buildings will be one of the most
     efficiency in   difficult sectors to decarbonise. In most countries, the impacts of policy so far
        buildings    have been relatively limited.
                     This policy sets a mandate to increase energy efficiency in buildings. It is
                     assumed that energy consumption in buildings falls by 8% compared to what it
                     otherwise would have been, with most of the energy saving measures being
                     implemented over 2021-2023. This scale of reductions is seen as ambitious
                     but achievable; for example, it would cover the gap in the EU to be consistent
                     with its proposed new 2030 targets.
                     The investment costs are derived from IEA analysis5. It is assumed that the
                     costs are covered by national governments as part of the economic recovery
                     measures.
   Subsidies for     Decarbonising the power sector remains the priority for reducing emissions in
  wind and solar     many countries. The costs of wind and solar power have fallen dramatically in
     deployment      recent years, with the technologies now becoming established in most
                     countries.
                     Rates of uptake remain limited, however, by the long lifetimes of existing
                     infrastructure and industry inertia. This policy aims to boost uptake by offering
                     a capital subsidy of 50% on new wind and solar equipment. This subsidy is
                     paid by national governments as part of the recovery package. It aims to lead
                     to both a less carbon-intensive energy system and lower electricity prices.
                     The subsidy rate of 50% was chosen because it should lead to a high rate of
                     uptake6, but places a limit on the public sector contribution to costs.
Improvements to      The combination of a more electrified energy system and a higher share of
 electricity grids   intermittent renewable generation will lead to a need for improved electricity
                     grid infrastructure. Rather than risk this need becoming a bottleneck on energy

                     5
                         https://www.iea.org/topics/energy-efficiency
                     6
                         Higher subsidy rates do not lead to much faster rates of uptake because of grid constraints.

                     Cambridge Econometrics                                                                                   6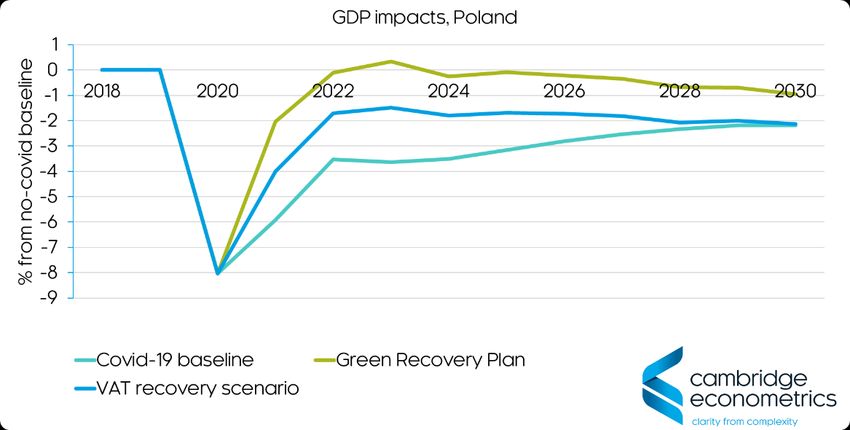
Assessment of Green Recovery Plans after Covid-19

                   system development, in the Green Recovery Plan grid improvements are
                   accelerated.
                   National governments cover the investment costs as part of the recovery plan.
      An EV car    After the 2008 financial crisis, several countries implemented schemes
     scrappage     whereby old vehicles could be replaced by more efficient ones. The scheme
       scheme      modelled here is similar, except it is only available for purchases of battery
                   electric vehicles (EVs, excluding hybrid vehicles).
                   It is assumed that national governments pay 20% of the cost of the new
                   vehicle, bringing costs of EVs closer to average conventional vehicle costs
                   (and much cheaper from a lifetime cost perspective).
                   In the modelling, it is assumed that initially households bring forward vehicle
                   purchases using savings accumulated during lockdown periods. Over time,
                   however, additional spending on vehicles starts to displace other spending,
                   meaning that the stimulus effects are smaller.
   Tree planting   Tree planting provides a relatively easy way to boost employment in a
across the world   struggling economy. In the scenario we assume that an additional 10 billion
                   trees are planted worldwide over 2021-2023. While ambitious, it should be
                   noted that the total number of trees planted would still fall a long way short of
                   the target of the Trillion Tree Campaign7.
                   The 10 billion trees are allocated to countries based on a combination of land
                   mass and the size of the current forestry sector in each country. It is assumed
                   that each tree costs on average $12 to grow and plant, with 50% of the cost
                   accounted for by wages that vary between countries.
                   In our analysis, the emissions savings from each tree are assumed to be 1
                   tCO2, shared equally over a 100-year lifetime.

                   7

                   https://en.wikipedia.org/wiki/Trillion_Tree_Campaign#:~:text=The%20Trillion%20Tree%20Campaign%20is,
                   Movement%20in%20Africa%20in%201977.

                   Cambridge Econometrics                                                                            7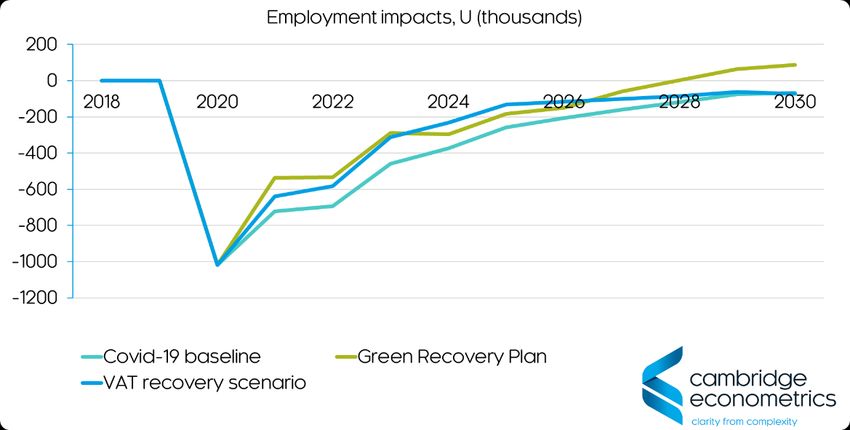
Assessment of Green Recovery Plans after Covid-19

                 2       Global Results

                 2.1     Socio-economic impacts
Macro outcomes   Figure 2.1 shows the global impacts on GDP. Covid-19 is expected to cost 8%
                 of global GDP (measured at market exchange rates) in 2020. Some of the lost
                 output is made up in future years, but even by 2030 GDP is 4% below the pre-
                 covid baseline value.
                 The VAT reduction scenario gives an immediate boost to the global economy,
                 that gradually reduces up to 2030. In comparison, the Green Recovery Plan
                 gives a larger stimulus and also shows a permanent benefit to GDP.
                 Figure 2.2 shows the impacts on employment. Global employment falls by
                 more than 50 million people in 2020 and, without support, employment keeps
                 on falling until 2023. The recovery plans aim to stop further reductions in
                 employment. Again, the Green Recovery Plan produces better results, both in
                 2021 and in the long term.

                 Figure 2.1: GDP impacts at global level

                 Figure 2.2: Employment impacts at global level

                 Cambridge Econometrics                                                                     8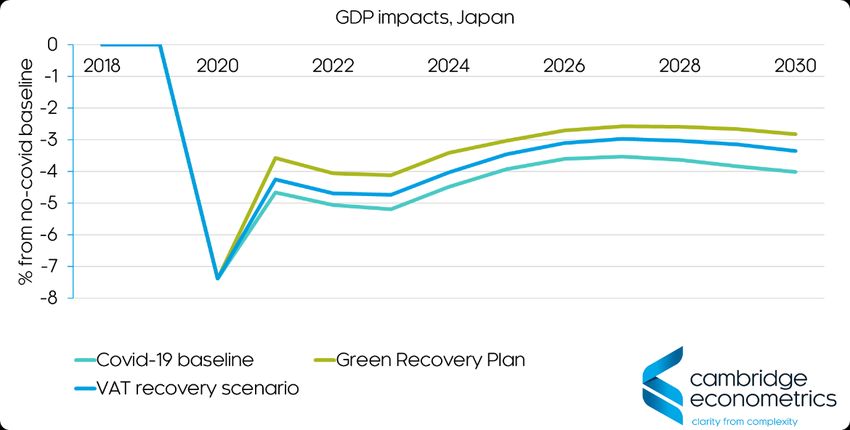
Assessment of Green Recovery Plans after Covid-19

Sectoral impacts   Covid-19 has affected all sectors of the global economy (see Table 2.1). The
                   most affected sectors are those that produce investment goods and consumer
                   services. The VAT recovery scenario is effective at boosting demand for
                   consumer services (which it lowers the price of). However, the Green
                   Recovery Plan leads to better results across all sectors except for energy and
                   utilities.

                   Table 2.1: Sectoral production impacts at global level (2024), % from no-covid baseline

                                                         Covid-19           Green             VAT recovery
                                                         baseline        Recovery Plan          scenario
                    Agriculture                                  -1.4              -0.4                 -0.6
                    Energy and Utilities                         -2.4              -4.1                 -2.0
                    Basic Manufacturing                          -4.1              -2.4                 -3.2
                    Advanced Manufacturing                       -7.2              -5.2                 -6.5
                    Construction                                 -6.5              -5.1                 -6.2
                    Consumer Services                            -5.0              -2.9                 -3.3
                    Transport and Comms.                         -3.2              -2.2                 -2.1
                    Business Services                            -4.5              -2.6                 -3.2
                    Public Services                              -0.9               0.2                 -0.4

                   2.2     Impacts on CO2 emissions
                   Figure 2.3 shows the impact of the scenarios on CO2 emissions. Global
                   emissions are expected to fall by at least 4% in 2020 but the effect is expected
                   to be temporary. However, the Green Recovery Plan could lead to a long-term
                   reduction in emissions of around 9%, with contributions from all the different
                   policies included in it (see below).

                   Figure 2.3: CO2 impacts at global level

                   Cambridge Econometrics                                                                      9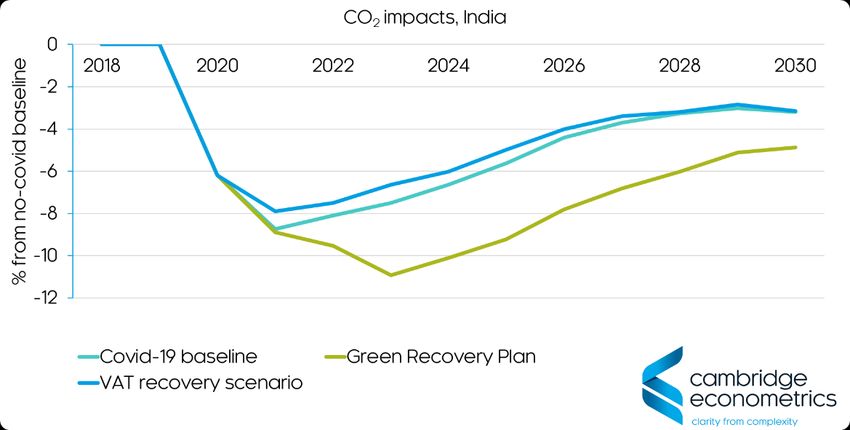
Assessment of Green Recovery Plans after Covid-19

2.3     Contribution of each policy
Figure 2.4 shows the contribution that each policy makes to the impacts on
GDP, employment and CO2 emissions. The chart shows that the single
biggest impact on GDP comes from the car scrappage scheme. However, the
tree planting programme is more effective for creating jobs, particularly in
developing countries with low labour costs.
We do not attribute any direct emission reductions to grid improvements (it is
more of an enabling technology), but all four of the other policies make a
substantial contribution over 2021-30. The largest impacts are from the
renewables subsidies, followed by the energy efficiency measures.

Figure 2.4: Contribution of each policy, global level (2021-2030)

Cambridge Econometrics                                                                     10
Assessment of Green Recovery Plans after Covid-19

                 3       Results for the EU

                 3.1     Socio-economic impacts
Macro outcomes   The Covid-19 pandemic is expected to cost the EU between 8 and 9% of
                 GDP, with around half of that being made up by 2030 (see Figure 3.1). The
                 two recovery packages have immediate benefits to GDP in 2021, with the
                 Green Recovery Plan being slightly better. By 2030, however, the results for
                 the Green Recovery Plan are much better. This is in part driven by reductions
                 in fuel imports to Europe, which outlast the initial investment stimulus.
                 Figure 3.2 shows the impacts on employment. The model results show that,
                 without support, a prolonged slump in employment to 2023 is possible. The
                 VAT recovery scenario and Green Recovery Plan are effective at stopping the
                 slump getting worse. The Green Recovery Plan also has long-term benefits for
                 employment levels in the EU.

                 Figure 3.2: GDP impacts in the EU

                 Figure 3.1: Employment impacts in the EU

                 Cambridge Econometrics                                                                  11
Assessment of Green Recovery Plans after Covid-19
Sectoral impacts Table 3.1 shows the impacts of Covid-19 and the recovery plans on each
sector in 2024. Consumer services were initially affected by the pandemic, but
a loss of investment means that manufacturing and construction have also
been hit hard. The VAT recovery scenario largely benefits the consumer
services sector (which can lower prices if VAT is reduced). The Green
Recovery Plan also brings back some of the lost output in manufacturing and
construction, for example driven by renewables construction and purchases of
electric vehicles.
Table 3.1: Sectoral production impacts at global level (2024), % from no-covid baseline
Covid-19 Green VAT recovery
baseline Recovery Plan scenario
Agriculture -3.2 -0.9 -1.9
Energy and Utilities -4.8 -6.3 -3.6
Basic Manufacturing -7.1 -4.5 -5.8
Advanced Manufacturing -11.8 -9.6 -11.0
Construction -9.8 -8.0 -9.3
Consumer Services -6.7 -4.1 -4.6
Transport and Comms. -4.6 -4.8 -3.4
Business Services -4.6 -2.7 -3.2
Public Services -1.1 -0.3 -0.6
3.2 Impacts on CO2 emissions
Figure 3.3 shows the impact of the scenarios on CO2 emissions. The
estimated reduction in emissions from Covid-19 is conservative and does not
include the early closure of some coal plants. However, the model results
match the consensus that by 2030 the impacts of Covid-19 will be limited.
The Green Recovery Plan scenario shows a large reduction in emissions,
reaching 16% by 2030. All the policies contribute to this reduction (see below).
It is noticeable that reductions in emissions continue after 2021-2023,
indicating the long-term benefits of establishing low-carbon technologies in the
European market.
Figure 3.3: CO2 impacts in the EU
Cambridge Econometrics 12Assessment of Green Recovery Plans after Covid-19 3.3 Contribution of each policy Figure 3.4 shows the percentage contribution of each environmental policy to the aggregate outcomes in the Green Recovery Plan, aggregated across 2021-2030. For GDP, the largest contribution comes from the car scrappage scheme that promotes EVs. The impact of the renewables subsidies is less, in part because renewables are being built anyway in Europe. The energy efficiency investment creates activity over the crucial period 2021-2023 but less thereafter, so has a more modest impact overall. The contribution of each policy to jobs is similar to that for GDP, but the tree planting programme has a larger impact. The main reason is that the jobs related to tree planting are lower skilled than those related to electric vehicles, so the same amount of funding can create more jobs. The right-hand bar on the figure shows that the biggest contribution to reducing emissions comes from the renewables subsidies, which push large amounts of coal power in Europe out of the market and so are effective at reducing total emissions. The energy efficiency and EV promotion also make a substantial contribution to the total, with the tree planting accounting for the remaining 14% of emission reductions. Figure 3.4: Contribution of each policy in the EU (2021-2030) Cambridge Econometrics 13
Assessment of Green Recovery Plans after Covid-19
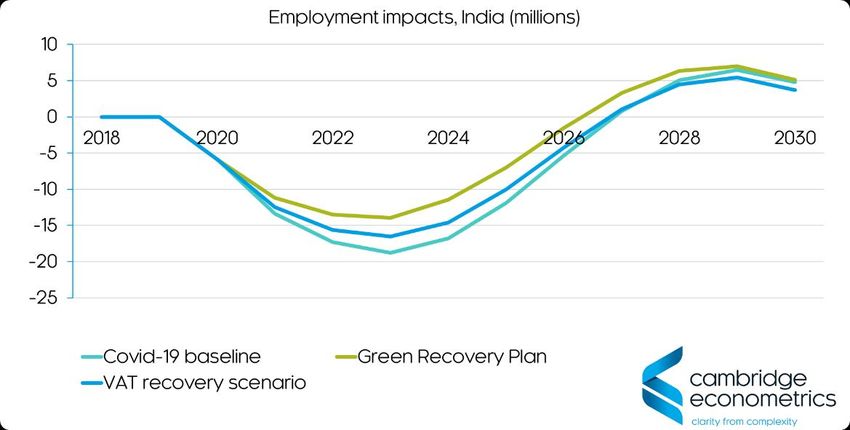
4 Results for Germany
4.1 Socio-economic impacts
Macro outcomes Figure 4.1 and Figure 4.2 show the impacts of the five measures on GDP and
employment. The VAT recovery scenario is added for comparison.
Although the consensus is that Germany has handled the Covid-19 crisis
relatively well, its economy has been weakened by a global fall in demand for
the high-value machinery that it exports. Some of its neighbours have also
been severely affected by the pandemic. Without support, the German
economy is therefore not expected to rebound quickly.
Both the VAT and Green Recovery Plan scenarios have an immediate effect
on stimulating the economy and preventing further job losses. However, the
model results suggest that some further longer-term support could be
required.
The results from the Green Recovery Plan are consistently better than those
from the VAT recovery scenario, both in terms of GDP and employment.
Figure 4.1: GDP impacts in Germany
Figure 4.2: Employment impacts in Germany
Cambridge Econometrics 14Assessment of Green Recovery Plans after Covid-19
Sectoral impacts Table 4.1 shows the impacts of the measures on each sector in 2024. The
impacts of Covid-19 are greatest in the manufacturing sectors that supply
investment goods and consumer services.
The VAT and Green Recovery Plan scenarios are both effective at boosting
activity in most sectors. Results for the Green Recovery Plan are better,
particularly in the services sectors. The only sectors that fare worse under the
Green Recovery Plan are the energy sectors, which see reduced demand
from the efficiency measures.
Table 4.1: Sectoral production impacts in Germany (2024), % from no-covid baseline
Covid-19 Green VAT recovery
baseline Recovery Plan scenario
Agriculture -6.0 2.1 2.5
Energy and Utilities -6.0 -6.8 -4.4
Basic Manufacturing -10.2 -7.1 -7.8
Advanced Manufacturing -13.4 -12.0 -13.1
Construction -11.5 -9.1 -10.8
Consumer Services -8.2 -3.8 -5.1
Transport and Comms. -7.2 -3.8 -4.8
Business Services -5.9 -2.9 -3.8
Public Services -1.3 -0.2 -0.7
4.2 Impacts on CO2 emissions
Figure 4.3 shows the impact of the scenarios on CO2 emissions. In both the
Covid-19 and VAT recovery scenarios emissions end up by 2030 only slightly
below the no-covid baseline. However, the Green Recovery Plan could lead to
a large and sustained reduction in emissions. Overall CO2 emissions in
Germany fall by more than 12% by 2023 compared to baseline; by 2030 the
relative reduction in emissions is similar.
Figure 4.3: CO2 impacts in Germany
Cambridge Econometrics 15Assessment of Green Recovery Plans after Covid-19 4.3 Contribution of each policy Figure 4.4 shows the percentage contribution of each environmental policy to the aggregate outcomes in the Green Recovery Plan, aggregated across 2021-2030. For both GDP and employment, around 80% of the benefits come from the car scrappage scheme and EV promotion. This result reflects both the potential of building the EV market share in Germany, but also the impact of exporting additional vehicles to other countries. In contrast, around half of the domestic emission reductions in Germany come through the renewables subsidies, with another quarter coming from the energy efficiency measures. The contribution from EVs is smaller, although it should be noted that there is an additional benefit from the interaction of having more EVs and increased renewables to power them that is not shown in the chart. The tree planting scheme makes a small additional contribution. Figure 4.4: Contribution of each policy in Germany (2021-2030) Cambridge Econometrics 16
Assessment of Green Recovery Plans after Covid-19

                 5       Results for Poland

                 5.1     Socio-economic impacts
Macro outcomes   The Polish economy has been less affected by Covid-19 than many other
                 countries’ economies and is expected to rebound back to strong growth in
                 2021. However, the modelling suggests that the recovery in jobs could lag that
                 for GDP, so there is a case for economic stimulus.
                 Figure 5.1 shows the impacts of the three scenarios on GDP. The VAT
                 recovery scenario could get the Polish economy almost back to baseline,
                 nearly neutralising the effects of Covid-19. The Green Recovery Scenario
                 could do even better, offsetting all the negative effects of Covid-19.
                 The results for employment (Figure 5.2) follow a similar pattern. Instead of
                 sustained job losses due to Covid-19, the Green Recovery Plan is able to
                 create enough jobs so that the overall net change in employment is close to
                 zero.

                 Figure 5.1: GDP impacts in Poland

                 Figure 5.2: Employment impacts in Poland

                 Cambridge Econometrics                                                                  17
Assessment of Green Recovery Plans after Covid-19
Sectoral impacts Table 5.1 shows the impacts of the pandemic and recovery plans on each
sector in 2024. By 2024, Poland is in recovery even in the Covid-19 baseline,
so in most sectors the impacts are smaller than in the other countries
presented in this report.
The Green Recovery Plan provides a boost to all sectors. All sectors except
energy and utilities, advanced manufacturing and construction could end up
with output above pre-covid baseline levels. However, the fall in the energy
sector is more substantial.
Table 5.1: Sectoral production impacts in Poland (2024), % from no-covid baseline
Covid-19 Green VAT recovery
baseline Recovery Plan scenario
Agriculture -1.2 1.3 0.0
Energy and Utilities -0.7 -4.4 -0.3
Basic Manufacturing -2.6 0.6 -1.4
Advanced Manufacturing -3.6 -1.9 -2.9
Construction -6.6 -5.0 -5.9
Consumer Services -4.6 1.4 -2.5
Transport and Comms. -1.2 -0.3 -0.7
Business Services -3.7 -0.5 -1.9
Public Services -0.8 0.6 -0.2
5.2 Impacts on CO2 emissions
The impact of the pandemic on emissions in Poland is close to zero
throughout the period up to 2030 (see Figure 5.3). In contrast, the Green
Recovery Plan has the potential to reduce Poland’s emissions by up to 10%
by 2024. However, it is noticeable that not all of the effects persist; although
emissions from vehicles keep decreasing after 2024, the ending of renewables
subsidies is too soon for renewables to displace conventional power sources
in Poland and some of the initial reductions in emissions are offset.
Figure 5.3: CO2 impacts in Poland
Cambridge Econometrics 18Assessment of Green Recovery Plans after Covid-19 5.3 Contribution of each policy Figure 5.4 shows the percentage contribution of each environmental policy to the aggregate outcomes in the Green Recovery Plan, aggregated across 2021-2030. For GDP and employment, the results are similar to those for Germany, with 70-80% of the benefits accruing through the EV promotion car scrappage scheme. Again, similarly to Germany, this result reflects a combination of domestic uptake of EVs and exports of cars or components. The tree planting programme also makes a notable contribution, including around a quarter of the jobs that are created. In contrast, the reductions in emissions accrue largely to the renewables subsidies and the energy efficiency measures. This outcome reflects the carbon-intensive nature of Poland’s power sector, which limits the benefits of increasing the use of EVs; but allows for large potential emission reductions from renewable substitution or reducing electricity consumption through efficiency measures. Figure 5.4: Contribution of each policy in Poland (2021-2030) Cambridge Econometrics 19
Assessment of Green Recovery Plans after Covid-19

                 6       Results for the UK

                 6.1     Socio-economic impacts
Macro outcomes   The UK economy has been severely affected by Covid-19 and is likely to
                 make up lost production only slowly (see Figure 6.1). The effects on
                 employment have been smaller but remain uncertain going forward once
                 existing support schemes are phased out (see Figure 6.2).
                 The two recovery plans modelled both help the UK over the period 2021-2024,
                 but have little long-term impact. The Green Recovery Plan again shows better
                 outcomes for GDP and jobs in both the short and long runs, but the difference
                 is less pronounced than in other countries. One reason is that the VAT
                 reductions are particularly effective in the UK’s service-oriented economy.

                 Figure 6.1: GDP impacts in the UK

                 Figure 6.2: Employment impacts in the UK

                 Cambridge Econometrics                                                                  20
Assessment of Green Recovery Plans after Covid-19
Sectoral impacts Table 6.1 shows the impacts on sectoral production in the UK. Like other
countries, manufacturing and construction are affected by the most because of
the effects of the pandemic on investment. It is noted, however, that the
impacts on consumer services are more modest by 2024.
The Green Recovery Plan lessens the effects on manufacturing. Primarily this
impact arises through a small increase in the demand for investment goods
(e.g. electric vehicles). There is less spillover to other sectors, however, than
in other countries, which is another reason for the overall impacts being
limited.
Table 6.1: Sectoral production impacts in the UK (2024), % from no-covid baseline
Covid-19 Green VAT recovery
baseline Recovery Plan scenario
Agriculture -0.3 -0.3 -0.3
Energy and Utilities -5.2 -9.4 -4.9
Basic Manufacturing -10.3 -8.9 -10.0
Advanced Manufacturing -13.1 -10.0 -12.9
Construction -7.8 -7.6 -8.0
Consumer Services -2.6 -2.8 -2.6
Transport and Comms. -4.7 -4.7 -4.5
Business Services -2.7 -2.6 -2.6
Public Services -0.5 -0.3 -0.5
6.2 Impacts on CO2 emissions
Figure 6.3 shows the impact of the scenarios on emissions. Although Covid-19
has a large short-term impact on UK emissions, by 2030 the difference is
reduced to around 2%.
The VAT recovery scenario has almost no impact on CO2 emissions in the UK.
However, the Green Recovery Plan leads to falls in emissions that continue
increasing beyond the end of the stimulus period. There are two reasons for
this long-term impact:
• The support for renewables provides additional stimulus to a growing
sector and conventional capacity is reduced over 2021-2024.
• Electric vehicles become established as a mainstream technology and the
vehicle fleet starts to transition even after the subsidies are withdrawn.
Cambridge Econometrics 21Assessment of Green Recovery Plans after Covid-19 Figure 6.3: CO2 impacts in the UK 6.3 Contribution from each policy Figure 6.4 shows the percentage contribution of each environmental policy to the aggregate outcomes in the Green Recovery Plan, aggregated across 2021-2030. As with the results for the EU, the shift to EVs through a car scrappage scheme makes the largest contribution to the GDP and employment impacts. However, the UK sees a much larger contribution from the renewables subsidies and grid improvements (around 30% combined) than in other European countries. The renewables subsidies make the largest contribution to emission reductions in the UK (around 50%), with a further 20% coming from energy efficiency. Most of the remaining emission reductions come from the uptake of electric vehicles. Figure 6.4: Contribution of each policy in the UK (2021-2030) Cambridge Econometrics 22
Assessment of Green Recovery Plans after Covid-19

                 7       Results for the US

                 7.1     Socio-economic impacts
Macro outcomes   The impacts of Covid-19 in the US are shown in Figure 7.1. The initial loss of
                 GDP is around 9% compared to the baseline. There is a gradual recovery but
                 by 2030 the difference is still more than 3%. The VAT scenario provides
                 economic benefits across the whole projection period. However, despite the
                 US’s large domestic energy sector, the Green Recovery performs slightly
                 better in all years.
                 Both recovery scenarios are also successful in reducing the number of jobs
                 lost to Covid-19 (see Figure 7.2). Again, the Green Recovery Plan is slightly
                 better for creating jobs.

                 Figure 7.1: GDP impacts in the US

                 Figure 7.2: Employment impacts in the US

                 Cambridge Econometrics                                                                  23
Assessment of Green Recovery Plans after Covid-19
Sectoral impacts Table 7.1 shows the sectoral impacts in each scenario for the year 2024. In
almost all sectors the Green Recovery Plan reduces the losses from Covid-19
by the most. The exception is the energy sector, which sees reduced demand
from the efficiency measures and the renewables subsidies.
Table 7.1: Sectoral production impacts in the US (2024), % from no-covid baseline
Covid-19 Green VAT recovery
baseline Recovery Plan scenario
Agriculture -5.5 -4.3 -4.9
Energy and Utilities -1.3 -3.6 -0.9
Basic Manufacturing -5.4 -3.3 -4.2
Advanced Manufacturing -8.4 -5.6 -7.1
Construction -8.8 -7.7 -8.0
Consumer Services -4.9 -3.0 -3.7
Transport and Comms. -1.1 0.3 -0.1
Business Services -2.3 -0.7 -1.2
Public Services -0.5 0.3 -0.1
7.2 Impacts on CO2 emissions
The pattern in CO2 emissions in the US is similar to that seen in other
countries. Although Covid-19 causes an immediate fall in emissions, by 2030
the difference is reduced to 2%. The Green Recovery Plan leads to a much
larger reduction in emissions, however. Power sector emissions fall by around
10% over 2021-2024 because of higher renewable penetration (and do not
increase after 2024). Promotion of electric vehicles also reduces road
transport emissions, and allows EVs to become established in the US market,
with further uptake even once the subsidies have been removed.
Figure 7.3: CO2 impacts in the US
Cambridge Econometrics 24Assessment of Green Recovery Plans after Covid-19 7.3 Contribution of each policy Figure 7.4 shows the percentage contribution of each environmental policy in the US to the aggregate outcomes in the Green Recovery Plan, aggregated across 2021-2030. More than half of the benefits to GDP and employment accrue from the promotion of electric vehicles. When interpreting these results, it must be remembered that the US has a large domestic energy sector, which exports to other countries. This means that any policy that reduces gas demand (i.e. energy efficiency or renewable subsidies) anywhere in the world will harm US energy production. As these results come from a global scenario, we therefore see no benefit to the US from these measures. This does not mean that energy efficiency or renewables subsidies within the US would cause negative impacts; it means that any benefits to the US from implementing these policies are outweighed by reduced demand for US gas from other countries. The same logic applies to oil demand from vehicles, but the domestic stimulus from the scrappage scheme to promote electric vehicles is large enough to show a net benefit overall. The tree planting programme does not impact on energy demand and hence shows positive results. In terms of the US’s emissions, the car scrappage scheme provides around 40% of the benefits, with around 25% each for the energy efficiency investment and renewables subsidies. The tree planting makes up the remainder. Figure 7.4: Contribution of each policy in the US (2021-2030) Cambridge Econometrics 25
Assessment of Green Recovery Plans after Covid-19

                 8       Results for Japan

                 8.1     Socio-economic impacts
Macro outcomes   Japan’s economy has been less affected by Covid-19 than some of the
                 world’s other major economies. However, while GDP is expected to rebound
                 somewhat in 2021, the economy will not catch up further and there is a
                 permanent reduction in GDP in the model results (see Figure 8.1). The nature
                 of Japan’s labour market means that the impacts on employment could also
                 be long-lasting (see Figure 8.2).
                 The recovery plans have a modest positive effect in Japan. The reason they
                 are less effective than in other countries is that high household savings rates
                 reduce additional expenditure, making the VAT reductions in both recovery
                 plans relatively ineffective. The Green Recovery Plan is therefore more
                 effective because it pushes spending into the economy directly. The effects
                 last up to 2030.

                 Figure 8.1: GDP impacts in Japan

                 Figure 8.2: Employment impacts in Japan

                 Cambridge Econometrics                                                                 26
Assessment of Green Recovery Plans after Covid-19
Sectoral impacts Table 8.1 shows the impacts of the measures on each sector in 2024. It is
notable that the benefits of the VAT scenario are restricted mainly to the
sectors that produce consumer goods. The Green Recovery Plan produces a
broader set of economic impacts, also advanced manufacturing sectors and
construction. In general it boosts all sectors (except energy) slightly more.
Table 8.1: Sectoral production impacts in Japan (2024), % from no-covid baseline
Covid-19 Green VAT recovery
baseline Recovery Plan scenario
Agriculture -2.4 -1.1 -1.6
Energy and Utilities -1.0 -2.5 -0.6
Basic Manufacturing -4.2 -3.1 -3.7
Advanced Manufacturing -6.3 -5.2 -6.1
Construction -7.1 -6.4 -7.2
Consumer Services -4.5 -3.1 -3.6
Transport and Comms. -2.3 -2.0 -2.4
Business Services -5.3 -3.8 -4.7
Public Services -1.5 -0.8 -1.0
8.2 Impacts on CO2 emissions
Japan’s economy has been less affected by Covid-19 that other countries’ and
the immediate impact on CO2 emissions is also less. Like other countries, this
reduction is expected to be short lived, with a long-term reduction in emissions
of just 2%.
The Green Recovery Plan leads to further emission reductions, reaching 10%
from baseline by 2023. This reduction is driven mostly by the power sector
bringing in more renewables, with a smaller contribution from the electrification
of road transport.
Figure 8.3: CO2 impacts in Japan
Cambridge Econometrics 27Assessment of Green Recovery Plans after Covid-19 8.3 Contribution of each policy Figure 8.4 shows the percentage contribution of each environmental policy to the aggregate outcomes in the Green Recovery Plan, aggregated across 2021-2030. Around two thirds of the increase in GDP comes from the vehicle scrappage scheme to promote electric vehicles (and 60% of jobs). Most of the rest of the positive impact comes from the renewables subsidies (20%) and grid improvements (10%). There is a small contribution from the energy efficiency measures. It is assumed that there is little space for tree planting in Japan. Assumptions about Japan’s power mix remaining fossil fuel dependent (after the closure of many of its nuclear plants) mean that the emissions savings from switching to electric vehicles (from vehicles that are already efficient) are small. Instead, the reductions in emissions come from efforts to reduce the level of fossil-based generation, either through renewables substitution or energy efficiency measures to reduce gas and electricity consumption. Figure 8.4: Contribution of each policy in Japan (2021-2030) Cambridge Econometrics 28
Assessment of Green Recovery Plans after Covid-19

                 9       Results for India

                 9.1     Socio-economic impacts
Macro outcomes   Figure 9.1 shows the impact of Covid-19 and the recovery plans on GDP in
                 India. Although only a small drop in GDP is expected in India in 2020, this
                 compares to a high baseline growth rate, and so the net change is -10%. Over
                 the period up to 2030, India is expected to make up for much of the lost
                 growth, albeit slowly.
                 Both the VAT and Green Recovery scenarios have immediate benefits in
                 2021. The impacts of the VAT reductions dissipate once they are phased out,
                 but the Green Recovery Plan leads to a permanent increase in GDP that fully
                 offsets the effects of Covid-19 by 2030.

                 Figure 9.2: GDP impacts in India

                 Figure 9.1: Employment impacts in India

                 Employment effects in India are driven largely by the construction sector,
                 which has been hit particularly badly by Covid-19. The lagged effects suggest
                 lower employment in the first half of the 2020s, with some catching up beyond
                 2025. The Green Recovery Plan plays a role in reducing the immediate
                 Cambridge Econometrics                                                                 29
Assessment of Green Recovery Plans after Covid-19
negative effects on employment, partly in construction but also in other
sectors.
Sectoral impacts Table 4.1Table 9.1 shows the impacts of the measures on each sector by
2024. The sectors most affected by Covid-19 are those related to investment
and consumer products. The VAT recovery plan provides benefits to the
consumer services and transport sectors but the Green Recovery Plan also
benefits other sectors, including construction and business services. The only
negative impacts are on the energy sector, which suffers from loss of demand
due to the efficiency measures.
Table 9.1: Sectoral production impacts in India (2024), % from no-covid baseline
Covid-19 Green VAT recovery
baseline Recovery Plan scenario
Agriculture -0.2 0.1 0.0
Energy and Utilities -4.8 -9.5 -4.3
Basic Manufacturing -6.5 -3.7 -5.8
Advanced Manufacturing -13.8 -9.4 -13.3
Construction -8.4 -6.5 -8.3
Consumer Services -6.5 -4.4 -4.8
Transport and Comms. -2.9 -0.9 -1.3
Business Services -5.6 -3.6 -5.2
Public Services -0.2 0.8 -0.2
9.2 Impacts on CO2 emissions
The impact of Covid-19 on CO2 emissions in India follows the pattern for GDP
impacts, with larger reductions initially, but decreasing over time. The VAT
recovery scenario increases emissions slightly by boosting GDP. The Green
Recovery Plan reduces emissions further, by 1-2%. The benefits arise
primarily due to greater energy efficiency and a small increase in renewables
(see below). The model results suggest that further measures would be
needed to lock in permanent emission reductions.
Figure 9.3: CO2 impacts in India
Cambridge Econometrics 30Assessment of Green Recovery Plans after Covid-19 9.3 Contribution of each policy Figure 9.4 shows the percentage contribution of each environmental policy in India to the aggregate outcomes in the Green Recovery Plan, aggregated across 2021-2030. The largest contribution to both GDP (79%) and employment (64%) is the car scrappage scheme to promote uptake of EVs. The tree planting programme accounts for 10% of the additional GDP and 27% of the additional employment. There contributions to GDP and employment from the renewables subsidies, grid improvements and energy efficiency policies are important over the period 2021-2023, but are partially offset by reductions in employment after 2025, once the support comes to an end. This also reflects that employment (and emissions) in India head back towards baseline levels relatively quickly, so the timing of the support is important. The contribution of each policy to reducing CO2 emissions is quite different. Because India remains coal-intensive, the benefits of electric vehicles (some of which replace CNG cars) are limited. Instead, the emissions reductions come from measures that would lead to lower levels of coal-fired generation. Hence most of the emission reductions come from energy efficiency measures and renewables subsidies. The tree planting programme adds a further 16%. Figure 9.4: Contribution of each policy in India (2021-2030) Cambridge Econometrics 31
Assessment of Green Recovery Plans after Covid-19

                   10 Overall Conclusions

                   10.1    Conclusions from the analysis
                   Although there are many differences between the economies assessed in this
                   report, there are some consistent themes in the modelling results. Most
                   obviously, Covid-19 is going to result in a substantial economic cost, in terms
                   of both GDP and lost jobs, in the first half of the 2020s. In most countries, the
                   recovery will not be immediate and much of the lost output will never be made
                   up. The sectors most affected are consumer services and sectors that
                   produce investment goods (e.g. advanced manufacturing and construction).
                   National governments have already stepped in to provide support measures to
                   stabilise their economies. However, to prevent a longer-term slump, more
                   support will be needed.
      Economic     Two types of support were assessed in this report, both at global level but with
       recovery    results disaggregated by country. The VAT recovery plan reduces VAT by five
                   percentage points and is effective at boosting household spending and
                   production of consumer services. It has no environmental benefits and may
                   even increase CO2 emissions.
                   The Green Recovery Plan also includes VAT reductions, but combines them
                   with measures to promote energy efficiency, renewable electricity generation,
                   the take-up of electric vehicles and tree planting. It costs government the
                   same amount as the VAT reduction scenario, but:
                   •   it provides a bigger initial stimulus to jobs and employment
                   •   it has more positive long-lasting economic benefits
                   •   it benefits a broader group of sectors

A green recovery   In addition, the Green Recovery Plan could lead to CO2 emission reductions of
                   7% by 2030, on top of the 2% reduction from Covid-19 itself. All five of the
                   individual policies contribute substantially to the reduction in emissions,
                   although it is not possible to attribute directly the effects of grid improvements
                   to lower CO2.
                   These reductions in emissions would not be sufficient to put the world on a
                   path that is consistent with the goals of the Paris Agreement, but they would
                   provide a start, while simultaneously supporting economic recovery. It should
                   also be noted that there are several sectors (e.g. agriculture, industry, freight
                   or public transport) that have not been directly affected by these policies. The
                   addition of further policies could therefore ensure Paris compatibility.

                   10.2    Getting the policies right
                   In this report, the same policies are implemented in each country. However,
                   the results point towards important differences in national circumstances that
                   suggest different policy mixes may be better.
                   One important point that comes out from the results is that the car scrappage
                   schemes tend to be the most beneficial policy in terms of GDP and

                   Cambridge Econometrics                                                                 32
Assessment of Green Recovery Plans after Covid-19
employment. This is consistent with the finding from analysis of the recovery
measures implemented after the financial crisis in 20088. This time around, the
environmental benefits may be greater, especially if they allow electric
vehicles to become established in national markets.
The environmental benefits of electric vehicles will only be realised, however,
if the power sector fuel mix has moved away from coal. This report includes
countries where this is not the case and where therefore (up to 2030)
environmental benefits are limited9. However, it should be noted that there are
still longer-term benefits of electrifying transport, even if there are no short-
term CO2 emission reductions. Nevertheless, in these countries larger short-
term emission reductions can be achieved through renewables subsidies and
efficiency measures.
The role of the domestic energy sector must also be considered when
assessing economic impacts. Here, there is an important difference to the
findings from 2008. With renewable shares increasing, the power sector is
now much more capital-intensive than previously. Energy efficiency measures
that would previously have led to less imported gas, now mean fewer new
wind and solar installations, and a larger impact on the domestic economy.
Countries that export gas will lose out from both domestic and external
measures to improve efficiency.
Finally, the potential for tree planting is largely dependent on geographical
factors. Where an ambitious tree planting scheme is possible, there are large
potential economic and environmental benefits. While such a policy is often
seen as modest, the effects could be real.
In summary, to maximise the potential benefits of a green recovery plan, a
mixture of policies is needed. The Green Recovery Plan in this report provides
an example of such a mixture. Even though this example is not the best mix of
policies for every country covered, it still provides economic and
environmental benefits in every country, over and above those in the VAT
recovery scenario that we used for comparison. Further tailoring of policies
could improve results further, but the results here provide strong support for
greening the response to Covid-19.
8
https://ec.europa.eu/environment/enveco/growth_jobs_social/pdf/studies/green_recovery_plans.pdf
9
Results are consistent with recent academic literature: https://www.nature.com/articles/s41893-020-0488-7
Cambridge Econometrics 33You can also read