Assessment of Oceanic Anomalies of Predictive Potential - Zenodo
←
→
Page content transcription
If your browser does not render page correctly, please read the page content below
Assessment of Oceanic Anomalies of Predictive Potential
Greenland ice sheets. Credits: SAMS
Blue-Action: Arctic Impact on Weather and Climate is a Research and Innovation action (RIA) funded by the Horizon 2020 Work
programme topics addressed: BG-10-2016 Impact of Arctic changes on the weather and climate of the Northern Hemisphere.
Start date: 1 December 2016. End date: 1 March 2021.
The Blue-Action project has received funding from the European Union’s Horizon
2020 Research and Innovation Programme under Grant Agreement No 727852.
1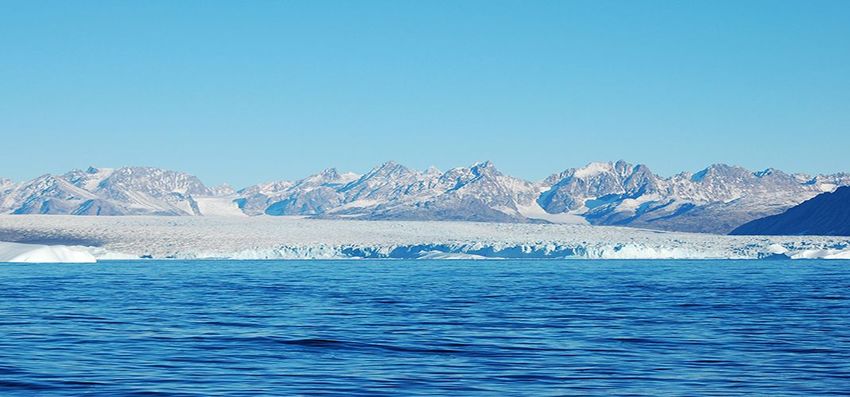
About this document
Deliverable: D2.5 Assessment of Oceanic anomalies of predictive potential
Work package in charge: WP2 Lower latitude drivers of Arctic changes
Actual delivery date for this deliverable: Project-month 30
Dissemination level: The general public (PU)
Lead authors
University of Bergen (UiB): Tor Eldevik, Marius Årthun
Other contributing authors
Havstovan (HAV): Hjálmar Hátún, Karin Margretha H. Larsen, and Bogi Hansen
Nansen Environmental and Remote Sensing Center (NERSC): Helene R. Langehaug
Norwegian Research Centre AS (NORCE): Svein Østerhus
Reviewers
Maynooth University (NUIM): Gerard McCarthy
Danmarks Meteorologiske Institut (DMI): Chiara Bearzotti
We support Blue Growth!
Visit us on: www.blue-action.eu
Follow us on Twitter: @BG10Blueaction
Disclaimer: This material reflects only the author’s view and the Commission is not responsible for any use that may be made of the information
it contains.
2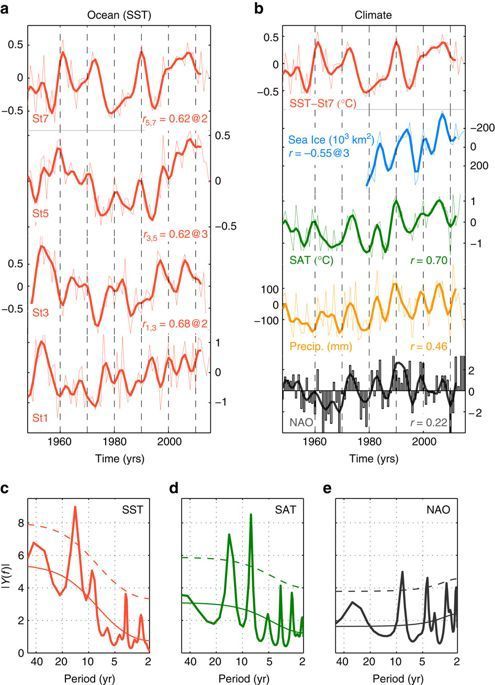
Index

Summary for publication…………          ……………… …              4

Work carried out………………… ……………………                           5

Main results achieved……………………… …………                       10

Progress beyond the state of the art……………………              17

Impact……………………………………………………                                17

Lessons learned and links built………………………….                18

Contribution to the top level objectives of Blue-Action   18

References (Bibliography)........…………………………               19
    Dissemination activities                              21
    Other publications                                    24
    Uptake by the targeted audiences                      24

                                                          3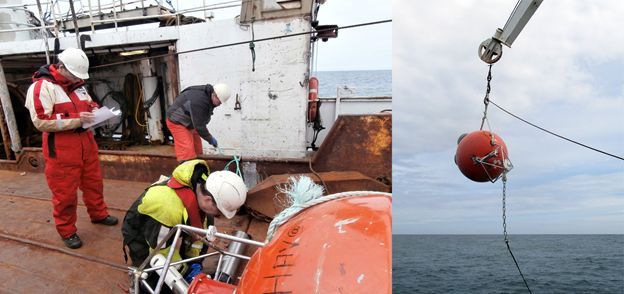
Summary for publication………… ……………… …
Climate prediction is the challenge to forecast climatic conditions months to decades into the future with a skill and
regional detail that is of practical use. Will, for example, Arctic sea ice cover increase the next winter? Will
Scandinavian hydroclimate be particularly beneficial for hydropower production? Will Southern European summers be
excessively warm through the 2020s?
To what extent such conditions are predictable in nature and to what extent predictability can be realised in
operational climate forecast systems and translated to useful stakeholder information, i.e., the climate equivalent to
weather forecasting, remain unknown.
It is commonly understood that predictability resides with the more inert components of the climate system and
particularly—as is the focus of Blue-Action—with ocean circulation. Blue-Action has substantiated this premise by
exploring observations, climate models, and reanalyses (model simulations tightly constrained by available
observations).
Successful avenues of research and progress made in Blue-Action include mapping out the dominant timescales of
European interannual-to-decadal climate variability, the identification of consistent and predictable variability in
Atlantic-to-Arctic ocean circulation, the link of ocean variability to fluctuating climate over land and sea ice extent,
and making actual climate forecasts toward 2020.
We find that winter surface air temperatures for much of continental Europe, and generally for Eastern Europe, are
characterized by a 5–10 year timescale. This reflects the variable strength of the large-scale westerly winds,
commonly summarized in the so-called North Atlantic Oscillation (NAO) index. The longest timescale that our
observation-based record resolves is a 25–40 year fluctuation characteristic for Western Europe (Iberia and England).
This we associate with more hemisphere-scale coherent temperature fluctuations, the so-called Atlantic Multidecadal
Oscillation (AMO).
The winter temperature over Northwest Europe (Norway, Sweden and parts of Finland), on the other hand, is
dominated by an intermediate 14-year timescale coherent with the sea surface temperature of the Norwegian Sea.
Fluctuating warm and cold ocean states off the east coast of Newfoundland progress persistently with ocean
circulation to and through the Norwegian Sea subsequently to face the Arctic sea ice cover. Our analyses show that
this variable ocean heat arrives predictably in the Norwegian Sea and imprints on the surface air temperature carried
in over Scandinavia “downwind” with the mean westerly wind with a forecast horizon of 7–10 years.
We particularly predict (from data through to 2016) that Norwegian mean temperature and precipitation will
decrease, although very marginally so (and remain above 1981–2010 climatology), toward 2020. And a general mean
temperature decrease was indeed observed from 2014 through to 2018 (but only slightly from 2016). Similarly,
winter sea ice extent in the Atlantic sector is predicted slightly to increase (but remain below climatology). This is
qualitatively reflected in the fact that Arctic March winter maximum increased – also relatively slightly – from 2017 to
2018, and then again from 2018 to 2019.
A basis for exploring climate predictability is the access to, and maintenance of, key observational time series.
Blue-Action benefits from the collective effort of the scientific community in making repeated observations of the
4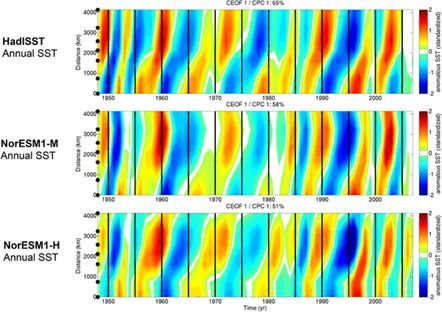
ocean and from satellite remote sensing of the sea surface. Importantly, Blue-Action contributes observations to this
effort with full-depth hydrographic and current meter measurements of the water mass exchanges at the
Greenland-Scotland Ridge, the main gateway between the North Atlantic and the Arctic region—including the
passage into the Norwegian Sea of the Gulf Stream’s northern limb and the cold and warm ocean states giving rise to
climate predictability as alluded to above.
A priority for Blue-Action is therefore both the maintenance and consistency of these main time series of northern
ocean climate, and further to deepen the understanding of the full spectrum of variability reflected at the mooring
sites (predictable and otherwise). We find that at seasonal time scales, the vigour of the exchanges generally reflects
that of the regional wind (broadly speaking the NAO), but that changes in so-called buoyancy forcing (heat loss and
freshwater input) seems increasingly important with increasing timescales.
The current meter measurement records, initiated by several of the Blue-Action partners through the 1990s, are still
too short for confidently concluding on the nature of observed variability at timescales longer than the interannual.
Further progress in “taking the pulse” of the Gulf Stream’s interaction with the Arctic is therefore from an
observational perspective critically dependent on the future maintenance and thus increasing temporal range
covered by the Greenland-Scotland Ridge observational array.
Work carried out………………… ……………………
The Description of Action for D2.5 Assessment of Oceanic Anomalies of Predictive Potential reads:
In order to enhance climate predictability provided by the ocean, the observed thermohaline anomalies travelling
the Nordic Seas and into Arctic Ocean will be assessed and compared with their representation in state-of-the-art
models and the underlying mechanisms will be scrutinized. Particular emphasis will be on the models’
representation of the flow through key hydrographic sections in the GSR, the Norwegian Sea and into the Arctic
(Barents Sea Opening, Fram Strait), as well as the air-sea interaction associated with persistent anomalies
identified accordingly – and thus including also potential impact by and on atmospheric circulation (D2.5).
We have emphasized in bold what points to work carried out and have organized this part of the report accordingly.
The itemized reporting is kept concise and relatively short for work that has been published or is in the process of
peer review; work still in progress is described in a little more detail.
Assessment of anomalies [Partners involved: UiB, NERSC, NORCE, NCAR]. The manifestation and degree of
persistence/predictability in the propagation of thermohaline anomalies from the North Atlantic through the Nordic
Seas and eventually into the Arctic proper have been assessed based on observations (Fig. 1; Årthun et al. 2017),
ocean reanalyses (Asbjørnsen et al. 2019), and climate model simulations (Langehaug et al. 2019; Årthun et al. 2019).
5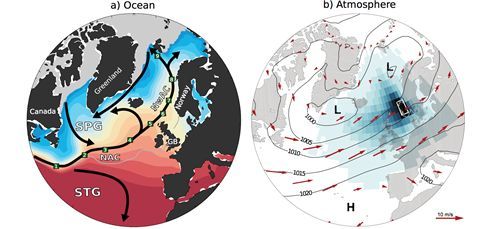
Figure 1. Dominant ocean and atmosphere circulation in the North Atlantic sector. (a) Climatological SST (colour) and major
ocean surface currents (black arrows). Sea ice is indicated by the grey shading. The green squares represent the selected stations
(St1–9) along the Atlantic water pathway [along which the propagation of thermohaline anomalies is considered]. The boundary
between the subtropical gyre (STG) and subpolar gyre (SPG) is indicated by the time-mean zero sea surface height contour (grey
line). (b) Mean winds (925 hPa; arrows) and sea level pressure (black contours) between 1998–2008 from Era-Interim reanalysis.
H/L indicates high/low-pressure centers. The maritime influence on Norwegian climate is highlighted by the distribution of air
(shading) in the planetary boundary layer one day before the air reaches western Norway (white box; calculated using a
Lagrangian trajectory model), indicating the moisture source for downwind rainfall. [Figure and caption from Årthun et al. 2017.]
Anomalies have been identified by constructing and analysing hydrographic time series—both at virtual and standard
hydrographic sections—along representative ocean pathways considering interannual and low-pass (typically
pentadal) variability. The resulting variability and coherence were compared using, e.g., power spectra and spatial
maps of lagged correlation/regression; and the nature and degree of persistent propagation were identified
objectively using complex principal component (CPC; Fig. 2) analysis (e.g., Årthun et al. 2017; Langehaug et al. 2019).
When a complete and internally consistent data set is available for analyses, e.g., using the ECCOv4 Ocean State
Estimate (Asbjørnsen et al. 2019), analyses are extended also to scrutinizing anomalies based on first principles
(conservation of volume, heat and salt). Asbjørnsen et al. (2019) assess the oceanic transports and ocean-atmosphere
fluxes constraining the heat content of the Norwegian Sea accordingly, after first having compared ECCOv4 relatively
favourably with observed variability at standard regional hydrographic sections.
Representation in models [Partners involved: UiB, NERSC, HAV, NORCE, NCAR]. The representation of anomalous
hydrography and ocean circulation has been assessed in a suite of global climate models (CMIP5 repository; Heuzé
and Årthun 2019), in a large ensemble simulation of one climate model (CESM-LE; Årthun et al. 2019), and in two
versions of the Norwegian Earth System Model (NorESM) subject to prescribed atmospheric forcing (Langehaug et al.
2019).
The methodology for assessing anomalies described above (e.g., power spectra, regression maps, CPC analyses) has
generally been used for model evaluation against observations and model-model intercomparison. Basic comparison
of climatological features, e.g., the magnitude of mean water mass exchange across the Greenland-Scotland Ridge, is
also performed (Heuzé and Årthun 2019).
6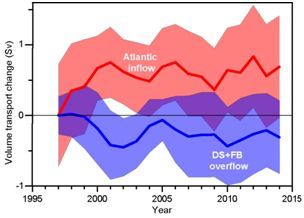
In addition, considering anomalous flow from the Arctic back to the North Atlantic, the high resolution ocean-only
model NEMO has been evaluated against observed variance of overflow through the Faroe Bank Channel (Chafik et
al., in prep).
Underlying mechanisms [Partners involved: UiB, NERSC, NORCE]. Broadly, two classes of mechanisms have been
assessed.
1. The poleward progression of oceanic anomalies, e.g., to what extent is it intrinsic ocean circulation, and to
what extent is it the atmosphere imprinting a seemingly advective signal on the surface ocean (Årthun et al.
2017; Langehaug et al. 2019; Asbjørnsen et al. 2019).
2. How the anomalous state of the ocean translates into climate variability over land (Kolstad and Årthun 2018;
Årthun et al. 2018), and Arctic sea ice extent (Årthun et al. 2017, 2019; cf. D2.6 “Oceanic heat anomalies and
Arctic sea-ice variability”1).
The assessment of “an oceanic advective signal vs atmospheric imprint” (class #1) was performed according to the
statistical methods described above (e.g., power spectra, regression maps, CPC analyses) but also importantly by
comparing with the accompanying anomalous circulation of salt and radioactive isotopes (Årthun et al. 2017) which
are more conservative tracers of ocean advection than SST/heat. In the case of reanalysis or model simulations, there
is also more direct analysis done based on first principles, e.g., explicitly diagnosing the contributions of ocean
advection and atmospheric heat flux in anomalous Norwegian Sea heat content (Asbjørnsen et al. 2019).
Figure 2. Observation-based and modelled SST anomalies. The poleward progression (vertical axis) of SST anomalies as a
function of time from CPC analyses for HadISST (top panel) and a medium (middle) and relatively high resolution version (bottom)
of the NorESM1. [ Figure from Langehaug et al. 2019. ]
The associated climate variability over land (class #2) is assessed in Årthun et al. (2017, 2018b). In Årthun et al.
(2017), the assessment is relatively basic. The degree of common time scales and co-variance between selected time
series in the ocean (Norwegian Sea) and over land (Norwegian surface air temperature, SAT, and precipitation;
Central England Temperature) is identified, and retrospective predictability is quantified from regressional relations.
1
Available in Zenodo: https://www.zenodo.org/communities/blue-actionh2020
7The underlying assumption is that anomalous ocean heat can be carried over land by the mean westerlies. This
assumption is put to test by Årthun et al. (2018b) using a dynamical analysis – the “constructed circulation analog”
method – with data provided by a relatively novel coupled climate reanalysis (CERA-20C of the ECMWF).
Key hydrographic sections [Partners involved: HAV, NORCE, UiB, NERSC]. Available observations from key sections
of poleward ocean heat transport, e.g., the Greenland-Scotland Ridge and the Barents Opening, are included either in
the progression of oceanic anomalies (e.g., Årthun et al. 2017), or as evaluation of reanalysis or model data (e.g.,
Asbjørnsen et al. 2019; Årthun et al. 2019). Furthermore, the current meter measurements at all available gateways
were synthesized and combined into a consistent total volume budget for the mean balance and eventual trends of
Arctic Mediterranean exchanges, uncertainties included (Østerhus et al. 2019).
The Greenland-Scotland Ridge is a particular focal point of Arctic-Atlantic exchanges and of the Blue-Action project.
During the project period, monitoring the volume transport and transports of heat (relative to 0°C) and salt of the
strongest Atlantic inflow branch, which enters the Nordic Seas between Iceland and the Faroes and continues in the
Faroe Current has been sustained. This has been carried out by regular CTD cruises and current measuring (ADCP)
deployments funded by the Danish National project FARMON. To enhance the sustainability of the monitoring
system, a major effort has been to evaluate and calibrate remote sensing (especially satellite altimetry) data in order
to determine the minimum necessary component of (resource-demanding) in situ observations in the future
monitoring system (Hansen et al., 2019).
For the distribution of heat downstream, including associated predictability—and also for general model evaluation, a
main unknown has been how large a portion of the Faroe Current flows towards the Faroe-Shetland Channel, and
joins the slope current towards the Barents Sea and the Arctic Ocean, and how much continues in a deeper branch
heading for the Norwegian Sea interior (Hátún etl., in prep).
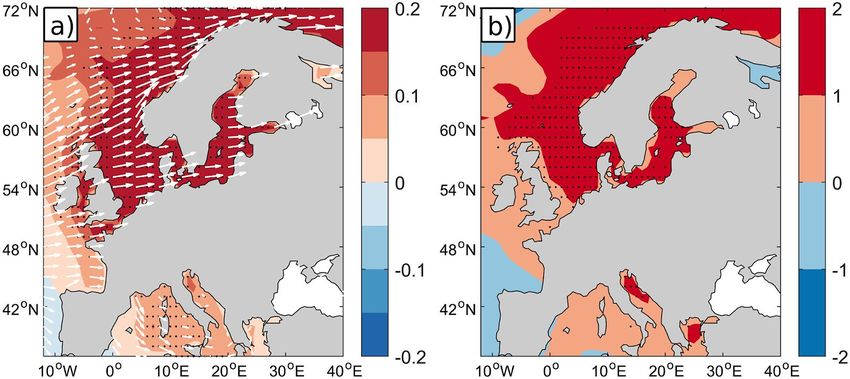
Figure 3. Deployment of mooring in the Faroe Current. Final control and verification of mooring details (left) prior to deployment
of ADCP mooring (right).
In June 2017, two Acoustic Doppler Current Profiler (ADCP; Fig. 3) moorings (funded by FARMON) on the Faroese side
of the Faroe-Shetland Channel just south of the entrance in order to observe the bifurcation of the Faroe Current
8were deployed. These instruments were recovered in May 2018 and the data have been analysed within the FARMON
and Blue-Action projects. The ADCP observations have been compared with satellite altimetry data, available surface
drifter data and vessel mounted ADCP data and XBT data from the high seas ferry M/F Norrøna. The aim is to develop
algorithms that will allow monitoring of the bifurcation by satellite altimetry (Hátún et al., in prep.). Hansen et al.
(2017) analysed available in situ and satellite altimetry data in order to trace the further pathway of the bifurcated
waters.
The well-constrained exchange of the Faroe Bank Channel (FBC) has also been further scrutinized as part of
Blue-Action by combining observational data and altimetry, the latter specifically to identify the link between FBC
overflow transport and the sea surface height in the southwest Norwegian Sea (Chafik et al., in prep).
Bringedal et al. (2018) synthesized all available current meter time series at the Greenland-Scotland Ridge
distinguishing seasonal and interannual variability, assessing co-variance of the branches of in- and outflow in terms
of anomalous horizontal and overturning ocean circulation. Modes and timescales of observed exchange were related
to forcing patterns and variance of reanalysis wind and to theory also accounting for buoyancy forcing.
Air-sea interaction [Partners involved: UiB, NORCE]. Air-sea interaction, and in our case the interaction associated
with persistent oceanic anomalies, can only be directly assessed in model or reanalysis-like data (at least for the
observational data considered in D2.5). This was part of the Norwegian Sea heat budget analysis of Asbjørnsen et al.
(2019) based on first principles to detail the relative role of the net air-sea heat flux in explaining the changing heat
content of the Norwegian Sea (according to the ECCOv4 ocean state estimate). Årthun et al. (2018b), using coupled
climate reanalysis, relate by regression “upwind” oceanic turbulent heat fluxes to the variable winter SAT over
Europe.
Atmospheric circulation [Partners involved: UiB, HAV, NORCE]. The ocean and atmosphere are a fundamentally
coupled component of the climate system . On one hand, for the anomalous state of the ocean to imprint on the
climate over land it must first imprint on the atmosphere. And on the other hand, the mean and variable state of the
atmosphere drives ocean circulation.
The variable state of the atmosphere, typically in terms of sea level pressure (SLP), has been related to the
manifestation of thermohaline anomalies (Årthun et al. 2017), and to variable oceanic pathways and their strength
(Årthun et al. 2019). Emphasis has been on documenting the eventual independence of oceanic variance –
subsequently reflected over land – from that intrinsic to the dominant regional atmospheric teleconnection pattern,
the NAO (Årthun et al. 2017, 2018b).
From the perspective of continental climate, Årthun et al. (2018b) have by means of combined dynamical and
statistical analysis diagnosed the nature of spatial variability in European winter SAT to sort out what projects on
variable atmospheric circulation (“dynamical” anomalies in the nomenclature of the analysis), e.g., the NAO, and
what does not (“thermodynamic”) and thus can be traced back to an oceanic source “upwind”.
For the evolving heat content of the Norwegian Sea, Asbjørnsen et al. (2019) specifically assess the influence of local
wind forcing thus disentangling the Ekman transport contribution to ocean advection. The atmospheric forcing of
Greenland-Scotland Ridge exchanges have been assessed by relating atmospheric reanalysis, typically using
regression, with observed current meter observations (Bringedal et al. 2018) and observed hydrography (Kristiansen
et al. 2019).
9Main results achieved……………………… …………
The organization of this part of the report is consistent with that of “Work carried out” above. The itemized reporting
is kept concise and relatively short for results that has been published or is in the process of peer review; work still in
progress is described a little more in detail.
Assessment of anomalies [Partners involved: UiB, NERSC, NORCE, NCAR]. Årthun et al. (2017) find that North
Atlantic sea surface temperature (SST) anomalies progress persistently and predictably along the Gulf Stream’s
poleward extension—the North Atlantic Current—and its partial continuation with the Norwegian Atlantic Current,
through to facing Arctic sea ice in the Svalbard region (Barents Sea and Fram Strait). For multiannual variance (using a
5-year low-pass filter), we find that the leading mode of SST propagation explains 55% of the total SST variance and is
characterized by a 14-year cycle. The propagation of SST is generally found to be accompanied by a consistent and
coherent propagation of anomalous salinity.
Figure 4. Oceanic anomalies of predictive potential. (a) Observed SST anomalies (°C) from the subpolar North Atlantic and
Nordic Seas (increasing station number going downstream, cf. Fig. 1). Lagged correlations between low-passed and detrended
time series are shown. (b) Time series of observed winter-spring Nordic Seas SST (St7), winter Arctic sea ice extent, annual
Norwegian SAT and precipitation, and the annual NAO index. Correlations between low-pass filtered SST and other time series
are given. In (a) and (b) thick lines show low-pass filtered data (Methods). All anomalies are relative to 1981–2010 climatology.
(c–e) Power spectra, estimated by the maximum entropy method, for Nordic Seas SST (St7), Norwegian SAT, and the NAO index
10based on unfiltered data from 1948 to 2015. Thin solid lines are the theoretical red noise spectrum computed by fitting a first
order autoregressive process with a 95% confidence interval (thin dashed lines) around the red noise. [ Figure and caption from
Årthun et al. 2017 ]
In particular, Årthun et al. (2017) find that Norwegian Sea SST can be explained by upstream conditions in the
subpolar North Atlantic off North America with a forecast horizon of 7 years, with warm/cold anomalies subsequently
reflected in the decreasing/increasing Arctic winter sea ice extent 3 years later (relative to the decreasing long-term
trend). The predictive potential is further documented by the covariance (50%) between Norwegian Sea SST and the
mean surface air temperature (SAT) over Norway, including sharing the same 14-year time scale (Fig. 4). A weaker
potential predictive influence was also inferred for precipitation over Norway (likely via precipitation linked to SAT
as, in a maritime climate, warm air is generally moist) and for Central England Temperature (which finds its oceanic
influence in multidecadal basin-scale variability, cf. Årthun et al. 2018b).
The manifestation of anomalous conditions in the Norwegian Sea was further assessed in Asbjørnsen et al. (2019).
The dominant source of variability was found to be ocean advection, broadly consistent with the above but with the
variable heat transport mostly related to changing volume transport . Furthermore, the active influence of regional
air-sea heat fluxes was found to contribute to substantial additional interannual variance.
Representation in models [Partners involved: UiB, NERSC, HAV, NORCE, NCAR]. The observation-based
documentation of propagating oceanographic anomalies guided the subsequent evaluation of anomalies in two
versions of the Norwegian Earth System Model (NorESM; low vs higher horizontal spatial resolution) that were
subject to prescribed atmospheric forcing (Langehaug et al. 2019). The SST propagation is qualitatively represented in
these two model versions, but by no means perfectly simulated. There is not in every aspect a clear-cut distinction
between the low-resolution and the high-resolution versions in performance. However, the higher resolution version
is generally found to be the more accurate, both in terms of simulated inflowing anomalies from the North Atlantic to
the Norwegian Sea and its relation to the structure and strength of the Subpolar Gyre. Langehaug et al. (2019)
promote—and emphasize the need—further to assess the representation of these (and other) oceanographic
anomalies of predictive potential in a broader suite of models (both forced and coupled).
A so-called “ocean state estimate”, as utilized by Asbjørnsen et al. (2019; in their case ECCOv4), is both a model
simulation and observation-based; the simulation is consistently being constrained by observations or data products
derived thereof. Asbjørnsen et al. (2019) provide evidence that the ECCOv4 – a complete and internally consistent
data set – is both a realistic representation of and useful for assessing the state of the Nordic Seas, in their case
specifically relating to poleward ocean heat transport and changing ocean heat content. A prime source for evaluating
ECCOv4 realism prior to analyses was the generally favourable (but not perfect) comparison with repeated
hydrographic sections at the Faroe-Shetland Channel and the Barents Sea Opening.
Similarly, reanalysis data products are now also available for the coupled air-ocean-sea ice system, and one such
product (CERA-20C of the ECMWF) was used for the mechanistic analysis of cause-and-effect in variable and possibly
predictable winter temperatures over Europe (Årthun et al. 2018b). The coupled reanalysis was in particular found to
be consistent in the representation—importantly including characteristic time scales—of Norwegian Sea SST and
surface air temperature observed over Scandinavia.
Heuzé and Årthun (2019) present the first multi-model assessment of the poleward ocean heat transport with the
three main inflows to the Nordic Seas, using 23 state-of-the-art global climate models that participated in the Climate
Model Intercomparison Project phase 5 (CMIP5). The majority of CMIP5 models have weaker poleward heat
11transports than observed in the Denmark Strait and across the Iceland-Faroe Ridge. In contrast, in the Faroe-Shetland
Channel, the majority of models have stronger transport than reported in observations. Discrepancies depend on the
inflow branch considered. In Denmark Strait, model resolution is key, with high resolution being associated with
strong transport, and low resolution and/or a too narrow strait with weak heat transport. In the Faroe-Scotland
channel the linear relationship between resolution and heat transport is only valid for models coarser than 1°,
whereas the resolution has no significant impact on the inflow across the Iceland-Faroe ridge. The representation of
atmospheric dynamics, and in particular the relative location of the low/high pressure systems in the North Atlantic,
are also crucial. Models with too weak heat transports have their Iceland-low pressure center shifted towards the
central Atlantic, thus shifting the wind stress that controls the inflow.
Årthun et al. (2019) assess the temperature, volume- and heat transport through the Barents Sea Opening in the
CESM large ensemble. Compared with observations the heat transport into the Barents Sea is underestimated as a
result of lower temperatures than observed. The lower temperatures are furthermore reflected in an overestimated
sea ice cover, especially during recent decades. The model nevertheless represents well present-day ice-ocean
interaction in the Barents Sea, quantified as the sensitivity of simulated sea ice extent to interannual heat transport
variations.
Underlying mechanisms [Partners involved: UiB, NERSC, NORCE]. We generally corroborate that “anomalies of
predictive potential” are indeed intrinsic to Subpolar-to-Arctic ocean circulation (Årthun et al. 2017; Langehaug et al.
2019; Asbjørnsen et al. 2019). There is nevertheless a relatively broad literature that explains similar anomalous
ocean heat, and particularly SST, from atmospheric forcing (see Årthun et al. 2017 for a brief discussion and relevant
references). However, our inference that the propagating anomalies are not the atmosphere imprinting on the ocean
surface is supported by two additional lines of independent evidence. First, there is a consistent pattern of
propagation and persistence in accompanying subsurface salinity anomalies; second, radioactive tracers are observed
to travel from release sites in France and the UK to and through the Norwegian Sea having consistent characteristics
(Årthun et al. 2017). This does not exclude the possibility that the atmosphere is also contributing to the anomalies’
manifestation, although this process is secondary in magnitude as the bulk of the heat is carried by the ocean. The
analysis of Asbjørnsen et al. (2019) of the ocean state estimate ECCOv4, shows that air-sea heat flux—although of
lesser physical magnitude—contributes variance explained to the Norwegian Sea heat budget similar to that
associated with ocean advection.
The poleward reach of warm ocean circulation anomalies is found to restrict the Arctic winter sea ice extent in the
Atlantic sector (Fram Strait and Barents Sea; Årthun et al. 2017, 2018a, 2019, cf. D2.6 “ Oceanic heat anomalies and
Arctic sea-ice variability” deliverable report for on the specific topic of sea ice). This predictable ice-free Atlantic
domain is what defines the possible habitat for Barents Sea cod: this physical constraint “capture[s] well multi-year to
decadal variations in cod stock biomass”, with variance explained exceeding 60% considering retrospective
predictions (Årthun et al. 2018a). Prediction errors are particularly associated with harvest rates and additional
unexplained variance intrinsic to the marine ecosystem that is not accounted for only considering hydrography.
We readily admit that in nature, it is generally not a case of anomalies strictly being either of oceanographic or of
atmospheric origin. And the inference for a specific case will always be somewhat dependent on the premise for the
analysis done. Hydrographic anomalies truly imbedded in ocean circulation can have a source upstream or back in
time rooted in the atmosphere; the pathway of ocean circulation considered can very well be sustained or vary from
atmospheric forcing. The further pursuit of the origin and maintenance of the oceanic anomalies addressed here will
remain a priority in our present and future research, both as a fundamental quest for understanding coupled
12air-ocean-ice climate-scale interactions in the Atlantic-Arctic sector and for the practical realisation of eventual
climate predictability.
Key hydrographic sections [Partners involved: HAV, NORCE, UiB, NERSC]
Time series of volume transport through the key hydrographic sections over the GSR have been included into a recent
synthesis supported by Blue-Action of all the observed exchanges between the Arctic Mediterranean and its
neighbouring oceans (Østerhus et al., 2019). The synthesis emphasizes the key role of the Atlantic inflow across the
GSR for the marine Arctic. The total Atlantic inflow has a seasonal variation on the order of 1 Sv with maximum inflow
in early winter, which mainly derives from the inflow through the Faroe-Shetland Channel. Although considerably
stronger on the average, the inflow between Iceland and Faroes has a much weaker seasonal signal (Østerhus et al.
2019; Bringedal et al. 2018).
On longer time scales, the total Atlantic inflow and outflow/overflow across the GSR has remained remarkably stable
during the two decades of monitoring (Fig. 5). There may have been an increase in transport during the last years of
the 20th century, although not statistically significant. Any weakening of the total inflow through the two decades can,
however, be excluded. This finding is strengthened by the stable transport of the two main overflow branches that
return most of the Atlantic inflow back to the Atlantic Ocean (Østerhus et al., 2019). Although the Atlantic inflow and
the outflow/overflow is an integral part of the AMOC, the reported weakening of the AMOC during this period (e.g.,
Smeed et al., 2018) has not affected the volume transport of Atlantic inflow to the Arctic Mediterranean (Østerhus et
al., 2019).
Figure 5. Anomalous Atlantic inflow and dense overflow. Low-passed (3-year running mean) volume transport change (from the
value in 1997) of the sum of the four Atlantic inflow branches (thick red line) and the sum of the two main overflow branches
(thick blue line). All changes are shown as positive into the Arctic Mediterranean. The coloured areas represent the 95 %
confidence interval [ figure from Østerhus et al., 2019 ].
For the strongest inflow branch, the Faroe Current, transport time series have been updated to May 2018 and for this
branch there is indications of a long-term increasing trend (Fig. 6). Indeed, 2017 was the year with highest volume
transport in the 25 year long series. Note, however, that the 95%-confidence interval of the the trend estimate (0.012
± 0.013 Sv yr-1) does include the null-hypothesis of no trend, if barely. For heat transport, inter-annual variations are
governed by the variations in volume transport (Fig. 6), but the long-term increase in temperature (Fig. 7) has added
to the increasing trend in volume transport so that the overall increasing trend for the 25 year series of heat transport
(0.70 ± 0.46) TW yr-1 is significant at the 95% confidence level.
13Figure 6. Observed Faroe Current Transports. Annually averaged transport of volume (black) and heat relative to 0°C (which is
close to the average temperature of water returning from the Arctic Mediterranean, red). Updated from Hansen et al. (2015).
Around 70% of the total Atlantic inflow is converted to dense water and leaves the Arctic Mediterranean as overflow
(Østerhus et al., 2019), which underscores the importance of the overflow in maintaining a stable Atlantic inflow
(Hansen et al., 2010). Since the salinity of the inflowing Atlantic water determines the density that it can achieve by
cooling, the observed freshening of the inflow (Fig. 7) is a warning signal that needs following up. This freshening is
caused by a severe freshening of the subpolar North Atlantic (Holliday et al., in review). Associated with this
freshening, there has been a change in the hydrographic character of the inflow. Up to 2016, changes in temperature
and salinity have generally been parallel, but since then they have diverged (Fig. 7).
Figure 7. Atlantic inflow hydrography (Faroe Current). Deseasonalised salinity (blue) and temperature (red) in the Atlantic water
core of the Faroe Current. Thin lines are values from individual cruises and thick lines are 1-year running means. Updated from
Larsen et al. (2012).
The main result in Hátún et al (In Prep) is that a part of the inter-annual and seasonal wind-driven variability observed
in the Norwegian Atlantic Slope Current is caused by a variable contribution from the Faroe Current. This means that
within the Nordic Seas, interaction between the Atlantic inflows via the Iceland-Faroe gap and the Faroe-Shetland
Channel, respectively, must be assessed to progress in estimates of the Atlantic heat transport through to the high
Arctic. Furthermore, analyses of deep current observations acquired by HAV show that the Faroe Bank Channel
overflow feeds from several sources. The good correspondence between these observations and results from a high
resolution ocean-only model (NEMO) verify that the source waters for the overflow are variable and geographically
distributed, suggesting a net stabilizing role of this “flexible” dense-water reservoir (Chafik et al., in prep) –
corroborating the main conclusion of the synthesis by Østerhus et al. (2019) that the exchanges between the Arctic
Mediterranean and the Atlantic Ocean—particularly in terms of volume transport—have been remarkably stable over
the last two decades.
14Bringedal et al. (2018) further scrutinized the observed variability at the Greenland-Scotland Ridge (three branches of
Atlantic inflow and two branches of dense overflow). For seasonal to interannual timescales, wind-forcing and a
horizontal barotropic-like circulation is found to carry the observed variance. An influence of the wind remains, but
buoyancy forcing within the Nordic Seas and vertical overturning circulation from inflow to overflow are suggested to
be of increasing importance the longer the timescale considered (inference on this aspect will presumably be better
constrained as the observations are maintained into the future extending the present 20 yr record).
Considering the further evolution through the 21st century, Årthun et al. (2019) find in their analyses of a
large-ensemble climate model simulation (CESM-LE, RCP8.5) that AMOC will weaken under continued global warming
(in line with the general finding from the CMIP5 suite of models), but that Arctic-Atlantic exchanges, e.g., providing
more heat to a retreating Arctic winter sea ice cover, will strengthen. However, the further downstream branch into
the Barents Sea will provide more heat to the Arctic from persistently warming, but its volume transport is projected
to weaken.
Another somewhat surprising finding, is that even though interannual to decadal thermohaline anomalies are
observed robustly to progress from the Subpolar Gyre region into the Norwegian Sea (e.g., Årthun et al. 2017),
Asbjørnsen et al. (2019) find that the local communication across the ridge is somewhat intermittent and thus not
very pronounced in “low-pass” properties when considering the ECCOv4 ocean state estimate. In this data, the
connection is more robust considering unfiltered (monthly) timeseries.
Relatedly, how variable flow strength interplays with the progression of warm and cold ocean states from the North
Atlantic to the Arctic across the ridge, and thus how the flow strength sustains (or obscures) northern climate
predictability, remains unknown and a main research question in need of resolution.
Air-sea interaction [Partners involved: UiB, NORCE]. Air-sea interaction between anomalous ocean heat or SST,
implicit to much of the above observation-based inference, was explicitly assessed in Årthun et al. (2018b) and
Asbjørnsen et al. (2019) as they had at their disposal sufficiently complete and self-consistent data sets (coupled
reanalysis and an ocean state estimate, respectively). As already summarized above, Asbjørnsen et al. (2019) find
anomalous air-sea heat flux relatively marginal in magnitude compared to the anomalous heat contributed to the
Norwegian Sea by ocean circulation, but the two contribute similarly in terms of variance explained. Directly related
to ocean predictability communicated over land, Årthun et al. (2018b) find that the ~14 yr oceanic mode reflected in
Scandinavian winter temperature is associated with the mean westerlies and in-phase heat loss from the Norwegian
Sea to the atmosphere (Fig. 8).
15Figure 8. SST, mean westerlies, and ocean heat loss reflected over land. (a) Sea surface temperature (SST) variability associated
with so-called “thermodynamic” surface air temperature (SAT) in northern Europe (cf. the “Work carried out” section), calculated
by linear regression (unit: °C/°C). The white arrows show the mean surface winds over the ocean (925 hPa). (b) Surface turbulent
heat fluxes regressed onto the annual rate of change of thermodynamic SAT in northern Europe (unit: Wm−2/Δ°C). Heat fluxes
out of the ocean are defined as positive. Dots indicate correlations significant at the 95% confidence level according to a random
phase test. [ Figure and caption from Årthun et al. (2018b) ]
Atmospheric circulation [Partners involved: UiB, HAV, NORCE]
A main priority for Blue-Action and D2.5 has been to document eventual predictability over land related to the
poleward propagating thermohaline anomalies with the North Atlantic Current/Norwegian Atlantic Current. And,
indeed, Årthun et al. (2017) find Norwegian Sea SST reflected (primarily) in mean SAT over Norway, literally
downwind of the anomalous ocean state. This is documented in how the SST regresses on spatial maps of SAT and
f that
sea level pressure (SLP); it is particularly shown that the oceanic variance reflected over land is independent o
associated with the variable strength of the westerlies, the NAO, which is the main source of variance rooted in the
atmosphere.
The above is corroborated by Årthun et al. (2018b) applying the “constructed circulation analogs” methodology to the
complete data set of a coupled reanalysis. Winter temperatures of Scandinavia are primarily related to the
propagating ocean anomalies of ~14 yr timescale, communicated over land by the mean wind; temperatures over
continental and eastern Europe primarily relate to NAO, the variable interannual wind of ~8 yr timescale; and
temperatures over Iberia and UK again relate to the ocean with the mean westerlies, but then at a multidecadal
timescale, i.e., so-called Atlantic Multidecadal Variability (AMV) to the extent that it is resolved by 110 yr long data
set.
Considering seasonal time scales, Kolstad and Årthun (2018) show that fall SST anomalies in the Norwegian and
Barents seas have the potential to predict wintertime SAT anomalies in Europe. Norwegian Sea SST anomalies in
spring are also significant predictors of European SAT anomalies in summer. The analysis suggests that Barents Sea
SST anomalies in fall causes NAO anomalies in winter, which then again causes SAT anomalies over western Europe
during the same season. However, the strength of this link and, hence, the potential for prediction has not been
stationary in time and highlights that the physical relationships that form the basis of statistical prediction models
should continuously be reassessed.
16In the projected ensemble-mean evolution reflecting the external forcing under continued global warming (RCP8.5),
Årthun et al. (2019) find that the exchanges between the Subpolar North Atlantic and the Nordic Seas will strengthen
due to lower SLP in the Nordic Seas region, in spite of an AMOC weakening. The downstream branch entering the
Arctic through the Barents Sea is weakening from projected change in local winds. Asbjørnsen et al. (2019) find that
Ekman transport adds magnitude to the general ocean heat transport, and Bringedal et al. (2018) relate the
seasonal-to-interannual coherence of Greenland-Scotland Ridge water-mass exchange to regional sea level pressure
and wind stress curl associated with NAO-like variance.
Progress beyond the state of the art……………………
Successful and observation-based avenues of research and progress made in Blue-Action include mapping out the
dominant timescales of European interannual-to-decadal climate variability, the identification of consistent and
predictable variability in Atlantic-to-Arctic ocean circulation, the link of ocean variability to fluctuating climate over
land and sea ice extent, and making actual climate forecasts toward 2020.
The observation-based “benchmarking” has been extended to – and thereby evaluating – the use of ocean state
estimates and coupled climate reanalyses. We foresee a next stage where the benchmarks and predictability proven
from observations will be key for the evaluation and further improvement of numerical climate prediction models,
the basis for eventual future operational (and skilful) climate prediction similar to present weather forecasting.
Impact……………………………………………………
How has this work contributed to the expected impacts of Blue-Action?
The outcomes of this deliverable contribute to an integrated understanding of low-latitude drivers of Arctic change,
and, hence, to an improved capacity to predict climate of the Northern Hemisphere. Based on observations and
model simulations, the work has identified climate variables and regions of high potential predictability, and
established the underlying mechanisms. The assessment of Arctic predictability also includes marine fisheries, which
could help to improve stakeholders’ capacity to adapt to climate variability and change.
The predictable relationships identified in this deliverable provide mechanistic benchmarks for climate prediction
models, which will improve the capacity of these models to represent Arctic climate change and associated
predictability (WP4).
The work performed has contributed to development of new data products by combining in-situ measurements from
the Faroe Current bifurcation monitoring system with satellites Earth Observations. These products may be used by
the modelling community in order to enhance the predictive capacity of climate models. The analysis of these data
provides a better estimate of ocean heat anomaly propagation towards the Arctic.
17The work performed in this deliverable contributed to the Blue-Action first policy briefing (D8.112).
Lessons learned and links built………………………….
● The work carried out in this deliverable links to Blue-Action deliverables D2.1 “Model-observation and
reanalyses comparison at key locations for heat transport to the Arctic”, D2.2 “Seasonal to decadal variability
of the subpolar gyre” and D2.3 “Processes and flow over the Iceland-Faroe Ridge”. These deliverables are in
preparation and will be published in December 2019. Final versions will be available in Zenodo:
https://zenodo.org/communities/blue-actionh2020
● Contributed to the Science-Policy breakfast discussion "The slowing Gulf Stream? What we know and
potential impacts" held at the European Parliament on 4 September 2018 together with H2020 AtlantOS on
invitation of the European Parliament Intergroup Seas, Rivers, Islands & Coastal Areas (Searica). The policy
briefing document is available in Zenodo: https://zenodo.org/record/1409470
● Joint ASOF/Blue-Action workshop on Arctic-Subarctic Ocean Fluxes in Copenhagen April 2019:
http://www.blue-action.eu/index.php?id=5019
● Key European-US partners of both ASOF and Blue-Action came together for the Arctic-Nordic Seas synthesis
of ocean gateway exchanges of Østerhus et al. (2019)
● Blue-Action (including D2.5 scientists Olsen, Årthun, Eldevik) contributes to the upcoming Workshop on
Climate Prediction in the Atlantic-Arctic sector j ointly organised by the Bjerknes Climate Prediction Unit and
the EU Modelling Cluster on 5-7th June 2019, Bergen (NO). The EU Modelling cluster is collecting a number of
H2020 projects: Blue-Action, APPLICATE, PRIMAVERA, CRESCENDO and others H2020 and Norwegian-funded
projects working on modelling topics: http://www.blue-action.eu/index.php?id=4229 Outcomes of this
specific workshop will feed the D6.2 deliverable of Blue-Action “Second Joint workshop to (re)formulate open
research questions of joint interest (2nd Modelling Workshop and ASOF meeting)”
Contribution to the top level objectives of Blue-Action
This deliverable contributes to the achievement of the following objectives and specific goals indicated in the
Description of the Action, part B, Section 1.1: http://blue-action.eu/index.php?id=4019
Objective 2 Enhancing the predictive capacity beyond seasons in the Arctic and the Northern Hemisphere
The potential for climate predictability based on the propagation of ocean heat anomalies from the North Atlantic
through the Nordic Seas and eventually into the Arctic proper have been assessed based on observations, ocean
reanalyses, and climate model simulations. It has been shown that the Arctic winter sea ice cover and temperature
over northwestern Europe can be predicted several years in advance based on the state of the ocean. Skillful climate
based multi-year predictions have also been demonstrated Northeast Arctic cod.
2
Olsen, Steffen, Årthun, Marius, Eldevik, Tor, Fritz, Jan-Stefan, Larsen, Karin, Miller, Raeanne, … Oltmanns, Marilena. (2018, September 3).
The Slowing Gulf Stream? What we know and potential impacts (Policy Brief) (Version 4 September 2018). Zenodo.
http://doi.org/10.5281/zenodo.1408097
18Objective 4 Improving the description of key processes controlling the impact of the polar amplification of global
warming in prediction systems
By assessment of the variable contribution of the Faroe Current to the Norwegian Atlantic Slope Current, which acts
to improve estimates of ocean heat fluxes to the high Arctic.
The mechanisms and predictable relationships identified in observations provide benchmarks against which
dynamical prediction systems can be compared and improved. Major shortcomings in the representation of poleward
ocean heat transport in global climate models (CMIP5) have also identified. Multi-model assessments and the
identification of across-model similarities and differences are important in order to improve climate models. The
large spread in modelled poleward ocean heat transport highlights the uncertainty in future projections of ocean heat
transport and associated climate impacts.
Objective 5 Optimizing observational systems for predictions
HAV has continued its efforts to optimize the monitoring system for the Faroe Current and has added a component
monitoring the bifurcation of this current into the Faroe-Shetland Channel and the easternmost branch of the
pole-ward oceanic heat transport.
Objective 7 Fostering the capacity of key stakeholders to adapt and respond to climate change and boosting their
economic growth
Skillful multi-year predictions of the commercially valuable Barents Sea cod stock demonstrate the potential for
ecosystem-based fisheries management. Integrating the identified relationship between upstream climate variability
and cod stock into management frameworks could enable the possibility of better fisheries management advice on a
longer time scale than today.
Objective 8 Transferring knowledge to a wide range of interested key stakeholders
To policy makers: Blue-Action contributed preparation, context and introductions to the Blue-Action Science-Policy
breakfast discussion "The slowing Gulf Stream? What we know and potential impacts", European Parliament, 4
September 2018 together with AtlantOS with inputs from Steffen M. Olsen (DMI), Tor Eldevik (UiB), Ben Moat
(UKRI-NOC), Karin Margretha Larsen (HAV), Marius Årthun (UiB) and Marilena Oltmanns (GEOMAR).
To policy makers: Steffen Olsen (DMI) and Tor Eldevik (UiB) were part of their respective national delegations at the
Arctic Science Ministerial (ASM2) in Berlin, Germany, 25 October 2018.
To policy and decision makers: Tor Eldevik (UiB, EASAC working group leader) and Gerard McCarthy (NUIM) are part
of the newly established (May 27 2019) working group for the planned EASAC (European Academies Science Advisory
Council) report “Changes in Ocean Circulation and Consequences for European Coastal Regions”.
To policy and decision makers: Marius Årthun (UiB) contributed to the Nordic Workshop on Ocean and Climate,
hosted by the Norwegian Environmental Agency in Oslo, Norway, 14 May 2019.
To policy and decision makers: Marius Årthun (UiB) contributed to the European Climate Research Alliance (ECRA)
general assembly in Brussels, Belgium, 28 February 2019.
References (Bibliography)........…………………………
(*) indicates papers not contributed by the Blue-Action project.
19Årthun, M., B. Bogstad, U. Daewel, N.S. Keenlyside, A.B. Sandø, C. Schrum, and G. Ottersen, 2018a: Climate based
multi-year predictions of the Barents Sea cod stock. PloS one, 13(10), e0206319.
Årthun, M., T. Eldevik, and L.H. Smedsrud, 2019: The role of Atlantic heat transport in future Arctic winter sea ice loss.
J. Climate, 32, 3327–3341.
Årthun, M., T. Eldevik, E. Viste, H. Drange, T. Furevik, H.L. Johnson, and N.S. Keenlyside, 2017: Skillful prediction of
northern climate provided by the ocean. Nature Communications, 8, DOI: 10.1038/ncomms15875.
Årthun, M., E.W. Kolstad, T. Eldevik, and N.S. Keenlyside, 2018b: Time scales and sources of European temperature
variability. Geophys. Res Lett., 45, 3597–3604.
Asbjørnsen, H., M. Årthun, Ø. Skagseth, and T. Eldevik, 2019: Mechanisms of ocean heat anomalies in the Norwegian
Sea. J. Geophys. Res. Oceans, 124, 2908–2923.
Bringedal, C., T. Eldevik, Ø. Skagseth, M. Spall, and S. Østerhus, 2018: Structure and forcing of observed exchanges
across the Greenland-Scotland Ridge. J. Climate, 31, 9881–9901.
Chafik, L., H. Hátún, B. Hansen, Ø. Skagseth, C. Herbaut, and Larsen, K. M. H., In Prep. An eastern source for the Faroe
Bank Overflow.
*Hansen, B., H. Hátún, R. Kristiansen, S. M. Olsen, and S. Østerhus, 2010: Stability and forcing of the Iceland-Faroe
inflow of water, heat, and salt to the Arctic. Ocean Sci., 6, 1013–1026, doi:10.5194/os-6-1013-2010.
*Hansen, B., K. M. H. Larsen, H. Hátún, R. Kristiansen, E. Mortensen, S. Østerhus, 2015: Transport of volume, heat,
and salt towards the Arctic in the Faroe Current 1993–2013. Ocean Sci., 11, 743–757,
https://doi.org/10.5194/os-11-743-2015
Hansen, B., T. Poulsen, K. M. Húsgarð Larsen, H. Hátún, S. Østerhus, E. Darelius, B. Berx, D. Quadfasel, and K.
Jochumsen, 2017: Atlantic water flow through the Faroese Channels, Ocean Sci., 13, 873–888.
*Hansen, B., K. M. H. Larsen, and H. Hátún, 2019: Monitoring the velocity structure of the Faroe Current. Havstovan
Technical Report 19-01, May 2019, http://www.hav.fo/PDF/Ritgerdir/2019/TechRep1901.pdf
Hátún, H., K.M.H. Larsen, B. Hansen, L. Chafik, In Prep. : The Southern Faroe Current.
Heuzé, C., and M. Årthun, 2019: The Atlantic inflow across the Greenland-Scotland ridge in global climate models
(CMIP5). Elem. Sci. Anth. , 7: 16. DOI: https://doi.org/10.1525/elementa.354.
Holliday, N. P., M. Bersch, B. Berx, L. Chafik, S. Cunningham, H. Hátún, W. Johns, S. A. Josey, K. M. H. Larsen, S. Mulet,
M. Oltmanns, G. Reverdin, T. Rossby, V. Thierry, H. Valdimarsson, I. Yashayaev, In review: Ocean circulation changes
cause the largest freshening event for 120 years in Subpolar North Atlantic. Nature Communications.
Kolstad, E.W., and M. Årthun, 2018: Seasonal Prediction from Arctic Sea Surface Temperatures: Opportunities and
Pitfalls. J. Climate, 31, 8197–8210.
Kristiansen, I., H. Hátún, H. Petursdottir, A. Gislason, C. Broms, W. Melle, J.A. Jacobsen, S.K. Eliasen, E. Gaard, 2019:
Decreased influx of Calanus spp. into the south-western Norwegian Sea since 2003. Deep Sea Res.,
https://doi.org/10.1016/j.dsr.2019.05.008.
Langehaug, H.R., A.B. Sandø, M. Årthun, and M. Ilıcak, 2019. Variability along the Atlantic water pathway in the forced
Norwegian Earth System Model. Clim. Dyn., 52, 1211–1230.
20You can also read