Assessment of the hyperbaric oxygen therapy effects in distal femoral necrosis using hyperspectral imaging
←
→
Page content transcription
If your browser does not render page correctly, please read the page content below
Assessment of the hyperbaric oxygen therapy effects in distal femoral necrosis
                                  using hyperspectral imaging

                                  CALIN Mihaela Antonina¹, MACOVEI Adrian², MANEA Dragos1

                                   Editor: Constantin MUNTEANU, E-mail: office@bioclima.ro
              Balneo and PRM Research Journal   DOI: http://dx.doi.org/10.12680/balneo.2021.431 Vol.12, No.2 June 2021   p: 123–128

 Corresponding author: CALIN Mihaela Antonina, E-mail: mantonina_calin@yahoo.com; micalin@inoe.inoe.ro

           1. “National Institute of Research and Development for Optoelectronics INOE 2000”, Magurele, Romania
2. “„Gen. Dr. Aviator Victor Anastasiu” National Institute of Aeronautical and Space Medicine”, Bucharest, Romania

Abstract
 Introduction. Hyperbaric oxygen therapy is a treatment option for an increasing number of conditions. The aim of
 this study was to assess its therapeutic effects in femoral condylar necrosis as well as in normal tissue using
 hyperspectral imaging. Material and method. A 47-year-old female patient diagnosed with avascular necrosis of
 the medial femoral condyle was included in this study. The patient received hyperbaric oxygen therapy for two
 consecutive days (the first day: three stages of 30 min each, separated by two breaks of 5 min at pO2 = 2 ATA; the
 second day: three stages of 30 min each, separated by two breaks of 5 min at pO2 = 2.4 ATA). The effects of
 hyperbaric oxygen therapy on the affected area (patient’s knee) and normal (patient’s hand) tissues oxygenation
 were assessed before and after each treatment session using hyperspectral imaging. Results and discussions. The
 results showed that hyperspectral imaging is quite good for monitoring the hyperbaric oxygen therapy efficacy in
 affected areas, even with deep tissue problems. Conclusions. In conclusion, the hyperspectral imaging-based
 approach for monitoring hyperbaric oxygen therapy could support physicians in extracting prognostic information
 and making the right treatment decisions.
 Keywords: bone   necrosis, image analysis, maps, oxyhemoglobin, deoxyhemoglobin, oxygen saturation,

    1. INTRODUCTION                                                quantitative assessment of the HBOT therapy effects and
Hyperbaric oxygen therapy (HBOT) is a therapeutic                  a better understanding of its action mechanism at the
modality that consists of the administration of high               tissular level, new non-invasive methods with real-time
concentrations of pure oxygen, at pressures exceeding              applications are still required.
atmospheric pressure (101.325 kPa), in patients placed             This paper proposes a new approach for assessing the
inside a hyperbaric chamber, for therapeutic purposes.             effects of HBOT therapy on tissue oxygenation based on
The action mechanism of this therapeutic modality is a             hyperspectral imaging (HSI). The hyperspectral imaging
complex one and it has been proven that it can lead to a           technique (also known as imaging spectroscopy)
series of biochemical, cellular and physiological effects          introduced by Goetz (16) in the late 1980s for Earth
(1) that could be exploited for the treatment of several           observations has more recently aroused interest in the
different diseases. Nowadays, the HBOT therapy is                  medical field for: cancer detection, diabetic foot ulcer
recommended as the main or complementary therapy for:              prognosis, peripheral vascular disease assessment, burn
decompression sickness and CO poisoning (2), gas                   characterization, etc. (17,18). This is because the HSI
embolism (3), necrotizing soft tissue infections (4),              technique, by combining the facilities offered by two
diabetic foot lesions (5), femoral head necrosis (6),              optical methods (digital imaging and spectroscopy), has
radiation injury (7), burns (8), and acute anemia (9). The         the ability to simultaneously provide spatial and spectral
effects of hyperbaric oxygen therapy are usually assessed          information about an investigated area, which can be
using methods such as: pulse oximetry (10,11),                     particularly useful to support clinicians in diagnosing
transcutaneous oximetry (12,13), thermal imaging and               various pathologies or monitoring the treatment
planimetry (14) or magnetic resonance imaging for lesion           efficiency.
progressing (15). However, for a more accurate

                                                              123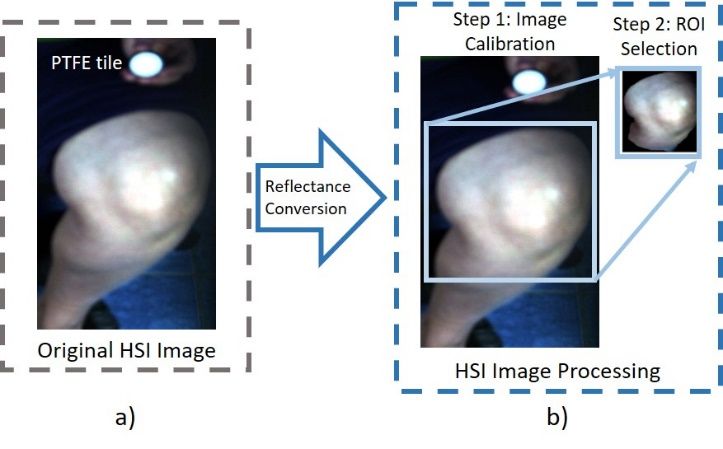
The aim of this paper was to explore the possibility of       2.3 Hyperspectral images acquisition
using spectral-spatial information provided by                Hyperspectral images of the patient's hand and knee
hyperspectral imaging, via a chemometric regression           (normal and pathological tissues, respectively) were
approach, to generate distribution maps of tissue             acquired using a line-scanning hyperspectral imaging
constituents (oxyhemoglobin and deoxyhemoglobin) in           system. This system consists of: (1) a hyperspectral
the investigated areas (pathologic-knee and normal-           sensor (ImSpector V8E, Specim, Oulu, Finland) that
hand). These maps can be considered as new tools for          allows the simultaneous acquisition of 205 spectral bands
non-invasive assessment and easier interpretation of the      in the spectral range (400-800) nm, at a spectral
effects of HBOT therapy.                                      resolution of 1.95 nm; (2) an illumination unit consisting
The main objectives of this study were: (1) setting the       of two 300W halogen lamps (OSRAM, Munich,
conditions for hyperspectral images acquisition; (2)          Germany) equipped with diffusion filters for uniform
establishing the appropriate method for preprocessing         illumination of the area of interest; (3) a galvanometric
hyperspectral images; (3) analysis of hyperspectral data      scan mirror (GVS211, Thorlabs, New Jersey, USA) for
and generation of distribution maps of oxyhemoglobin          scanning of the region of interest; (4) a computer with
and deoxyhemoglobin concentrations in affected and            specialized software installed for the acquisition,
adjacent areas exposed to HBOT therapy; and (4)               processing and analysis of hyperspectral data, such as
interpretation of results with the extraction of prognostic   SpectralDAQ software (Specim, Oulu, Finland) and
information and orientations towards therapeutic options.     ENVI v.5.1 software (Exelis Visual Information
                                                              Solutions, Boulder, Colorado, USA), and (5) a tripod
2 Materials and Methods                                       (Manfrotto, Cassola, Italy) for mounting the
2.1 Patient                                                   hyperspectral sensor in a suitable position to acquire the
A 47-year-old female patient (height = 168 cm, weight =       image of a region of interest (Fig 1.)
95 kg) diagnosed with avascular necrosis of the medial
femoral condyle was selected for this preliminary study.
An informed consent was obtained from the patient prior
to participation in the study. The procedures performed in
this study involving human participants were in
accordance with the ethical standards of the “Gen. Dr.
Aviator Victor Anastasiu” National Institute of
Aeronautical and Space Medicine Research and Ethics
Committee and with the 1964 Helsinki declaration and its
later amendments or comparable ethical standards. On
clinical examination, the patient presented pain, function
limitation and swelling of the knee. Diagnosis was
confirmed by magnetic resonance imaging investigation.
HBOT therapy was recommended as a possible treatment
by an orthopedic surgeon.

2.2 Hyperbaric oxygen therapy (HBOT)                          Fig. 1. The experimental setup used for the acquisition of
Hyperbaric oxygen therapy was performed using a                 normal and pathological tissues hyperspectral images
BARAMED monoplace hyperbaric chamber (ETC,                    Hyperspectral images acquired with this hyperspectral
Southampton, USA). The patient received HBOT once a           system often contain artifacts and aberrations associated
day for several days, the first two days being selected for   with the type of line-by-line scanning that affects image
this study. On the first day, the patient was exposed to      quality. Therefore, prior to any further analysis of
HBOT inside the hyperbaric chamber at a O2 pressure of        hyperspectral images, a processing step of the original
2 absolute atmospheres (ATA) for 90 min, in three stages      data is required.
of 30 min each, separated by two breaks of 5 min
breathing ambient air. Oxygen was administered by an          2.4 Hyperspectral images processing
on-demand regulator on a standard care mask. The next         The processing of the original hyperspectral images was
day, the procedure was repeated, but at an O2 pressure        performed in two steps (Fig. 2). The first step was aimed
increased to 2.4 ATA.                                         at minimizing the signal variations of the hyperspectral
The immediate effects of HBOT therapy on the normal           system introduced by the spatial non-uniformity of the
and pathological tissues oxygenation were evaluated           artificial light intensity in the scene to be investigated and
before and after each treatment session using                 by the dark current of the monochrome camera.
hyperspectral imaging.

                                                          124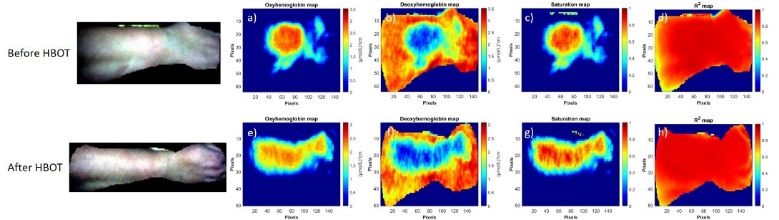
All acquired hyperspectral images were calibrated with (19) and Levenberg-Marquardt method (20). The
white and dark reference images, using Equation (1) : approach assumes, as a first step, the conversion of
hyperspectral images (reflectance images, R (λ)) into
(1) absorbance images Acalc (λ) using Equation (2):
A calc ( λ ) =-log R ( λ ) (2)
where: Icalibrated is the calibrated hyperspectral image, 10
Ioriginal is the original hyperspectral image of the
investigated areas, Idark is the dark reference image In the next step, the absorbance Aest (λ) in each pixel of
acquired by completely covering the hyperspectral sensor the image is estimated according to the Beer-Lambert
lens with its black cap and turning off the illumination law, by Equation (3):
unit, and Iwhite is the white reference image acquired using
a polytetrafluoroethylene (PTFE) reference tile (model (λ)
A est= ε (λ)C
Oxy Oxy
+ ε Deoxy ( λ ) C Deoxy + T (3)
WS-2, Avantes, Apeldoorn, Netherlands), located in the
area to be investigated (Fig. 2.a).
where: COxy and CDeoxy represent the surface molar
concentrations of HbO2 and Hb [(mol ∕ L)⋅cm], εOxy and
εDeoxy are the extinction coefficients (cm-1/(mol/liter)) of
HbO2 and Hb, and T is a term that takes into account the
effect of light scattering. Finally, the terms COxy are CDeoxy
are determined by minimizing the sum of square
difference between the calculated absorbance Acalc and
the estimated absorbance Aest using the nonlinear least-
square method (Eq. 4).
2
(4)
∑ A ( λ ) - A ( λ )
k
calc est
→ min
The minimization of the function described by Eq. 4 is
Fig. 2. Hyperspectral image processing flowchart of the performed using the Levenberg–Marquardt method.
patient left leg. a) original image of the patient's leg; b) The results of this approach are distribution maps of
image processing (image calibration and ROI selection oxyhemoglobin and deoxyhemoglobin concentrations
relative only to the patient's knee) generated both as images (.tif files) and as numerical data
(ASCII text files). In addition, the information contained
The high dimensionality of hyperspectral data was in these maps can also be exploited to evaluate oxygen
reduced in the second step by selecting a region of saturation (StO2) in each pixel of the analyzed region of
interest (ROI) relative only to the area to be investigated interest. This parameter is defined by Equation (5):
(hand/knee) and eliminating other elements present in the
scene, not relevant to the area to be investigated which
would complicate the subsequent analysis of the data StO 2 =
C Oxy
(5)
(Fig. 2.b). Image processing was repeated at the C Oxy
+ C Deoxy
beginning of each experimental measurement, with the
white reference standard placed in the same scene as the These results, in the form of distribution maps of HbO2,
investigated area. Hyperspectral images acquired before Hb concentrations and StO2, allow the analysis of the
and after exposure of patients to HBOT therapy, after changes induced by HBOT therapy in the oxygenation
appropriate processing, were used as a basis for level of the investigated pathological area, in a simple
subsequent chemometric analysis of chromophores and easy to interpret graphical manner.
identified in the investigated tissues.
3 Results
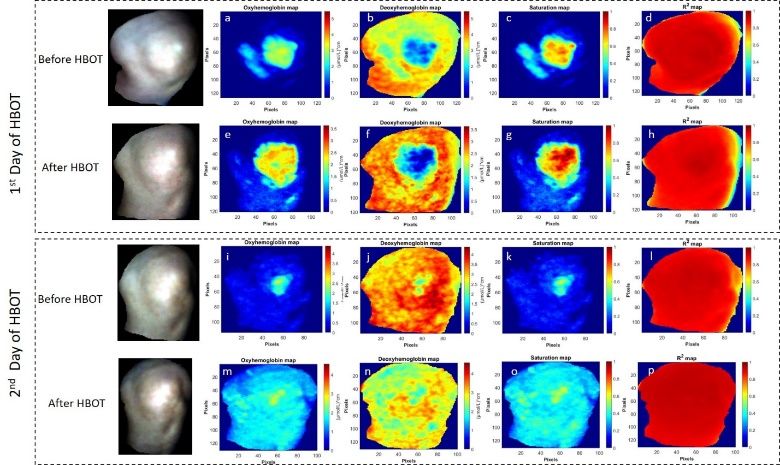
2.5 Hyperspectral data analysis Figure 3 shows the distribution maps of oxyhemoglobin
The spatial and spectral information contained in the and deoxyhemoglobin concentrations, as well as oxygen
processed hyperspectral images was exploited to generate saturation across the region of interest related to the
distribution maps of oxyhemoglobin (HbO2) and patient's pathological area (knee) determined from
deoxyhemoglobin (Hb) concentrations in biological hyperspectral data obtained at different time moments
tissues using an approach based on Beer-Lambert law during HBOT treatment (before and after the first and the
125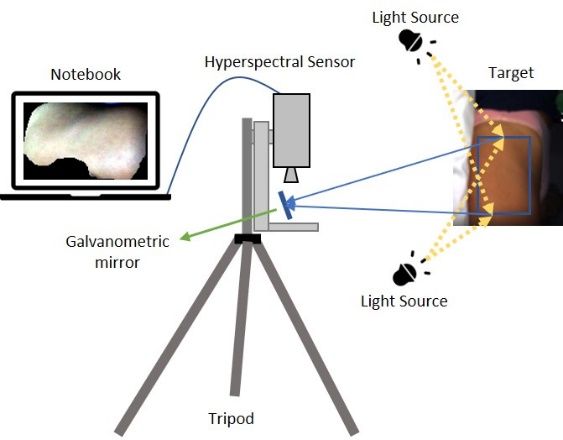
second treatment day). The distribution maps of the             In the case of normal tissues, the effect of HBOT therapy
coefficient of determination (R2) calculated over the same      is much more pronounced as seen in Figure 4. Possible
region of interest indicating the accuracy degree of the        explanations could be related to the different vascular
regression equation adjustment to the experimental data         structure of the examined areas. Taking into account the
are also shown (Fig. 3.d,h,l,p).                                patient's pathology, although the lesion is deep (bone) it
                                                                is likely that some pathological changes in the superficial
                                                                circulation already exist which could justify the
                                                                oxygenation state of the patient's hand).

                                                                       Figure 4. Distribution maps of HbO2 and Hb
                                                                    concentrations, StO2 and R2 values in normal tissue
                                                                    (patient’s hand) before and after a HBOT treatment
                                                                    session. a), e) distribution maps of oxyhemoglobin
     Fig. 3. Distribution maps of oxyhemoglobin and               concentrations before and after HBOT treatment; b), f)
deoxyhemoglobin concentrations, oxygen saturation and              distribution map of deoxyhemoglobin concentrations
   R2 values over the patient's pathological area (knee)              before and after HBOT treatment; c), g) oxygen
 calculated from hyperspectral data obtained at different          saturation before and after HBOT treatment; d), h) R2
time moments during HBOT treatment (before and after                values calculated before and after HBOT treatment
 the first and the second treatment day). a), e), l) and m)     The changes in the oxygen content of the normal and
   distribution maps of oxyhemoglobin concentrations            pathological areas induced by HBOT session, expressed
before and after each HBOT treatment session; b), f), j),       in terms of mean values of oxyhemoglobin and
       and n) distribution map of deoxyhemoglobin               deoxyhemoglobin concentrations and oxygen saturation,
  concentrations before and after each HBOT treatment           are shown in Fig. 5.
 session; c), g), k), and o) oxygen saturation at different
time moments during HBOT treatment; d), h), l), and p)
  R2 values calculated at different time moments during
                       HBOT treatment

It is noticeable from Figure 3 that the HbO2 concentration
increases after the first session of HBOT therapy,
especially in the central area of the knee, thus clearly
highlighting the affected area, but decreases significantly
                                                                   Fig. 5. Difference in the mean values of HbO2 and Hb
in the next 24 h. After the second HBOT therapy session,
                                                                    concentrations, and StO2 of normal and pathological
the significant increase in HbO2 concentration observed
                                                                                 tissues after HBOT therapy
throughout the patient's knee area can be explained by an
                                                                It should be noted that although in Figs. 3 and 4 there are
improvement in blood circulation in the knee region,
                                                                increases/decreases in chromophores concentrations in
probably due to the initiation of the neovascularization
                                                                certain areas of the knee/hand, considerable differences
process by the mechanism of intermittent hypoxia. The
                                                                are recorded only for the mean concentrations of HBO2
deoxyhemoglobin concentration increases after the first
                                                                and StO2. The variation of the mean concentration of
session of HBOT therapy as well as within the 24 h
                                                                deoxyhemoglobin remains approximately constant (0.46).
interval between treatment days, an effect just
                                                                This could be due to the fragile development of
attributable to the intermittent hypoxia mentioned above,
                                                                redistributed blood flow in the first HBOT sessions. The
with the establishment of the neovascularization process.
                                                                effect is expected to be permanent in the affected areas,
The second HBOT session led to only a small decrease in
                                                                but only after a significant number of HBOT sessions
deoxyhemoglobin concentration, due to persistent
                                                                (usually over 5), which we could not monitor for this
neovascularization that did not change during exposure.
                                                                study, even if the patient received a full course. Short-
The R2 values very close to 1 found in all the analyzed
                                                                term monitoring excludes chronic circulatory and
cases indicate a high degree of correlation between the
                                                                metabolic changes attributable to hyperbaric oxygen
calculated and experimental data.
                                                                therapy.

                                                              126
Therefore, HbO2 and StO2 distribution maps generated         protocol, but without significant difference between
from hyperspectral images can be considered as useful        normal and necrotic areas, explained by local
tools for non-invasive monitoring of the local level of      vasoconstriction.
oxygenation of normal and pathological tissues that can      Promising results in the use of HBOT therapy for femoral
be correlated with the evolution of pathology treated by     head necrosis have also been reported in several other
HBOT therapy, thus helping physicians to take correct        studies that have highlighted the HBOT therapy effects
decisions about the treatment efficiency and staging.        based on clinical outcome (range of motion, stabilometry
                                                             and pain (6) or by magnetic resonance imaging (15,22).
4 Discussion                                                 However, to our knowledge, the use of hyperspectral
Herein, a new approach for assessing the effects of          imaging to assess the effects of HBOT therapy on
HBOT therapy on tissue oxygenation based on                  femoral condylar necrosis is presented for the first time in
hyperspectral imaging that has the ability to provide        this study. It has the advantage of providing important
spatial-spectral information that can be used to generate    information about the local effectiveness of HBOT, and
distribution maps of tissue constituents (oxyhemoglobin      can be considered as a useful monitoring option that can
and deoxyhemoglobin), via a chemometric regression           provide evidence of the HBOT effect.
method, was presented. This approach consists mainly of      Although this study has shown the role of hyperspectral
two steps: (1) processing of hyperspectral data (image       imaging in assessing the effects of HBOT therapy, for a
calibration, ROI selection) and (2) analysis of              better understanding of how HBOT therapy may be
hyperspectral data using a Beer-Lambert law-based            beneficial in the treatment of bone disease, further studies
approach and the Levenberg-Marquardt method to               should be conducted on: (1) validation of the HSI method
generate distribution maps of oxyhemoglobin and              by comparison with other methods (e.g. transcutaneous
deoxyhemoglobin concentrations in biological tissues to      oximetry, thermography, planimetry, etc.), but also by
facilitate the highlighting of local oxygenation levels of   using larger groups of patients to confirm its outputs; (2)
normal and pathological areas, and therefore the local       improving the performance of the algorithm for
effects of HBOT therapy. Such distribution maps of           calculating chromophore concentrations, so as to allow
oxyhemoglobin and deoxyhemoglobin concentrations             the generation of total hemoglobin maps useful in
have seldom been reported so far in clinical practice        highlighting the neovascularization process induced by
where pulse oximetry is most widely used method for          HBOT therapy; and (3) identifying modalities to reduce
measuring oxygen saturation levels, but unfortunately of     data analysis time for real-time measurements. All these
limited use in HBOT. Therefore, the proposed approach        issues will be addressed in further studies.
could be considered a particularly useful tool for
evaluating the effects of HBOT therapy, providing            5 Conclusions
valuable information not only about changes in oxygen        In conclusion, the effects of HBOT therapy on affected
saturation levels (that can also be measured by the pulse    and normal areas could be clearly demonstrated by the
oximetry method), but also about changes in the              oxyhemoglobin, deoxyhemoglobin and oxygen saturation
oxyhemoglobin and deoxyhemoglobin concentrations in          maps generated by hyperspectral imaging. The HSI-based
the pathological tissues. Such information gives an          approach proposed in this study for assessing the HBOT
opportunity to enrich knowledge about the HBOT               therapy effects has been shown to be sufficiently accurate
therapy mechanism, which is not yet fully understood         both as critical areas identification and as predictor of
(21), and at the same time to establish a proper             therapeutic effect and it can be an option for HBOT
therapeutic schedule for specific pathologies.               physicians in making the right treatment decision.
In this study, the ability of hyperspectral imaging to
assesses the hyperbaric oxygen therapy effects affected      References
areas was assessed as response to the requirement for        1. Cervaens M, Marques F, Camacho Ó, Barata P.
non-invasive and fast methods to assess the immediate           HYPERBARIC OXYGEN THERAPY IN MUSCLE
and local effects of HBOT therapy.                              INJURIES. 2010;7:294–304.
The results showed that, through an appropriate analysis     2. Shank ES, Muth CM. Decompression illness, latrogenic gas
of hyperspectral images of the patient's knee and hand,         embolism, and carbon monoxide poisoning: The role of
the immediate effects of HBOT therapy could be seen in          hyperbaric oxygen therapy [Internet]. Vol. 38, International
both pathological and normal areas. Increases in mean           Anesthesiology Clinics. Lippincott Williams and Wilkins;
oxyhemoglobin concentration and oxygen saturation               2000 [cited 2021 Apr 6]. p. 111–38. Available from:
levels were recorded in all investigated areas, more            https://pubmed.ncbi.nlm.nih.gov/10723672/
significant in affected areas than in normal tissues. On     3. Moon RE. Hyperbaric treatment of air or gas embolism:
the other hand, local deoxyhemoglobin levels decreased          current recommendations. Undersea Hyperb Med. 2019 Sep
after tissues exposure to the same HBOT therapy                 1;46(5):673–83.

                                                         127
4. Steiner T, Seiffart A, Schumann J, Bucher M. Hyperbaric 8];141(4):1465–75. Available from:
oxygen therapy in necrotizing soft tissue infections: A https://doi.org/10.1007/s10973-019-09129-0
retrospective study. In: Advances in Experimental Medicine 15. Reis ND, Schwartz O, Militianu D, Ramon Y, Levin
and Biology [Internet]. Springer New York LLC; 2018 D, Norman D, et al. Hyperbaric oxygen therapy as a
[cited 2021 Apr 6]. p. 263–7. Available from: treatment for stage-I avascular necrosis of the femoral head.
https://pubmed.ncbi.nlm.nih.gov/30178356/ J Bone Jt Surg - Ser B [Internet]. 2003 Apr [cited 2021 Apr
5. Stoekenbroek RM, Santema TB, Legemate DA, Ubbink 8];85(3):371–5. Available from:
DT, Van Den Brink A, Koelemay MJW. Hyperbaric https://pubmed.ncbi.nlm.nih.gov/12729112/
oxygen for the treatment of diabetic foot ulcers: A 16. Goetz AFH. Three decades of hyperspectral remote
systematic review. Vol. 47, European Journal of Vascular sensing of the Earth: A personal view. Remote Sens
and Endovascular Surgery. W.B. Saunders Ltd; 2014. p. Environ. 2009 Sep 1;113(SUPPL. 1):S5–16.
647–55.
17. Lu G, Fei B. Medical hyperspectral imaging: a review.
6. Camporesi EM, Vezzani G, Bosco G, Mangar D, Bernasek J Biomed Opt [Internet]. 2014 Jan 20 [cited 2021 Apr
TL. Hyperbaric oxygen therapy in femoral head necrosis. J 8];19(1):010901. Available from:
Arthroplasty. 2010 Sep 1;25(SUPPL. 6):118–23. https://pubmed.ncbi.nlm.nih.gov/24441941/
7. Feldmeier JJ. Hyperbaric oxygen for radiation injury: Is it 18. Calin MA, Parasca SV, Savastru D, Manea D.
indicated? [Internet]. Vol. 18, Current Oncology. Multimed Hyperspectral imaging in the medical field: Present and
Inc.; 2011 [cited 2021 Apr 6]. p. 211–2. Available from: future. Appl Spectrosc Rev [Internet]. 2014 Aug 18 [cited
/pmc/articles/PMC3185897/ 2021 Apr 8];49(6):435–47. Available from:
8. Villanueva E, Mh B, Wasiak J, Jp L. Hyperbaric oxygen https://www.tandfonline.com/doi/abs/10.1080/05704928.20
therapy for thermal burns (Review). [cited 2021 Apr 6]; 13.838678
Available from: http://www.thecochranelibrary.com 19. Maikala R V. Modified Beer’s Law - historical
9. Graffeo C, Dishong W. Severe blood loss anemia in a perspectives and relevance in near-infrared monitoring of
Jehovah’s Witness treated with adjunctive hyperbaric optical properties of human tissue. Int J Ind Ergon. 2010
oxygen therapy. Am J Emerg Med [Internet]. 2013 Apr 1 Mar;40(2):125–34.
[cited 2021 Apr 6];31(4):756.e3-756.e4. Available from: 20. Croeze A, Pittman L, Reynolds W. SOLVING
http://dx.doi.org/10.1016/j.ajem.2012.11.013 NONLINEAR LEAST-SQUARES PROBLEMS WITH
10. KE G, JR H, GA S, KJ H, NS P. Assessment of THE GAUSS-NEWTON AND LEVENBERG-
oxygen saturation levels during a mild hyperbaric chamber MARQUARDT METHODS.
treatment. J Clin Investig Stud. 2018;1(2). 21. Sunkari VG, Lind F, Botusan IR, Kashif A, Liu ZJ,
11. Martinelli B, Noronha JM, Sette MFM, dos Santos IP, Ylä-Herttuala S, et al. Hyperbaric oxygen therapy activates
Barrile SR, Simão JC. Cardiorespiratory alterations in hypoxia-inducible factor 1 (HIF-1), which contributes to
patients undergoing hyperbaric oxygen therapy. Rev da Esc improved wound healing in diabetic mice. Wound Repair
Enferm [Internet]. 2019 [cited 2021 Apr 8];53:1–8. Regen. 2015 Jan;23(1):98–103.
Available from: 22. Bosco G, Vezzani G, Enten G, Manelli D, Rao N,
https://pubmed.ncbi.nlm.nih.gov/31508730/ Camporesi EM. Femoral condylar necrosis: treatment with
12. Batenburg MCT, van den Bongard HJGD, Kleynen hyperbaric oxygen therapy. Arthroplast Today. 2018
CE, Maarse W, Witkamp A, Ernst M, et al. Assessing the Dec;4(4):510–5.
effect of hyperbaric oxygen therapy in breast cancer
patients with late radiation toxicity (HONEY trial): a trial
protocol using a trial within a cohort design. Trials
[Internet]. 2020 Dec 1 [cited 2021 Apr 8];21(1):980.
Available from:
https://trialsjournal.biomedcentral.com/articles/10.1186/s13
063-020-04869-z
13. Kaur S, Pawar M, Banerjee N, Garg R. Evaluation of
the efficacy of hyperbaric oxygen therapy in the
management of chronic nonhealing ulcer and role of
periwound transcutaneous oximetry as a predictor of wound
healing response: A randomized prospective controlled
trial. J Anaesthesiol Clin Pharmacol [Internet]. 2012 Jan
[cited 2021 Apr 8];28(1):70–5. Available from:
/pmc/articles/PMC3275977/
14. Englisz-Jurgielewicz B, Cholewka A, Firganek E,
Knefel G, Kawecki M, Glik J, et al. Evaluation of
hyperbaric oxygen therapy effects in hard-to-heal wounds
using thermal imaging and planimetry. J Therm Anal
Calorim [Internet]. 2020 Aug 1 [cited 2021 Apr
128You can also read