Asset Management Plan - July 2012 ASSET MANAGEMENT AND OPERATIONS
←
→
Page content transcription
If your browser does not render page correctly, please read the page content below
Transport
                Asset Management Plan

                              July 2012
ASSET MANAGEMENT AND OPERATIONS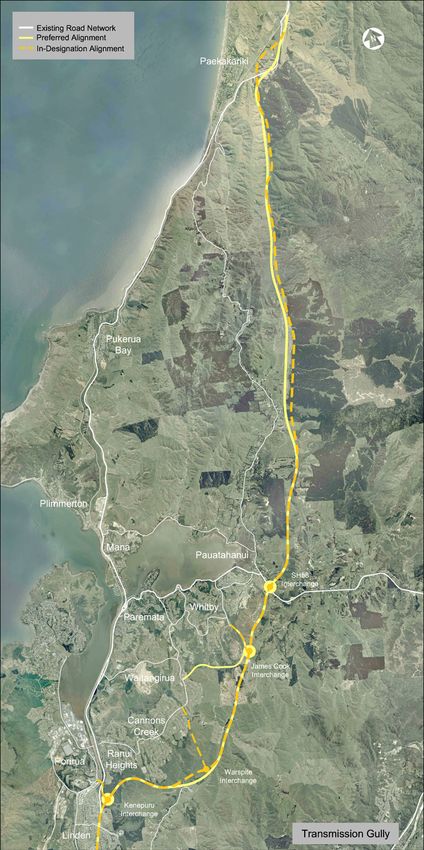
ISBN 978-1-87758-46-8 (print)
ISBN 978-1-87758-47-5 (online)

PCC# 700061													                                 Page i of ii
                All printed documents are uncontrolled
Transport Asset Management Plan 2012

                           TRANSPORT ASSET MANAGEMENT PLAN

       Document Control                                                                          Porirua City
                                                                                                     Council
                                                                                              PO Box 50-218
       Document Ref:                                                                             Porirua City
       PCC-#700061-v3-                                                                       NEW ZEALAND
       PCC_Transport_Asset_Management_Plan_2012.DOC

       Revision                                                    Author/
                      Date                Description                                     Position
         No.                                                      Reviewer
           -5         1996             1st Transport AMP              x          PCC Roading Asset Manager

           -4         1999                        x                   x                      x

           -3         2000                        x                   x                      x

           -2         2003                        x                   x                      x

           -1         2006                        x                   x                      x

           0        Dec 2007                   Updated          Abdul Zaytoun    PCC Roading Asset Manager

           1        Jan 2008             Internal review         John Gibbs      PCC Strategic Asset Manager
                                                                                   Montgomery Watson and
           2        Mar 2008            External review          Debra Onley              Harza

           3        Apr 2008                   Updated           John Gibbs      PCC Strategic Asset Manager

           4        Oct 2008                   Updated           Brian Hasell        Consulting Engineer
                      June
           5                         Internal review (LTP)       John Gibbs       Manager Strategic Assets
                      2009

           6          June                     Updated          Richard Mowll      Asset Manager Roading
                      2011
           7        July 2011           External Review          Brian Hasell            Consultant

           8        July 2011                  Updated          Richard Mowll       Senior Asset Engineer
                                                                                           Roading
           9        July 2012   Final version – LTP 2012-2022   Anthony Clarke   Asset Management Engineer

PCC Transport Asset Management Plan 2012.DOC                                                                    Page 2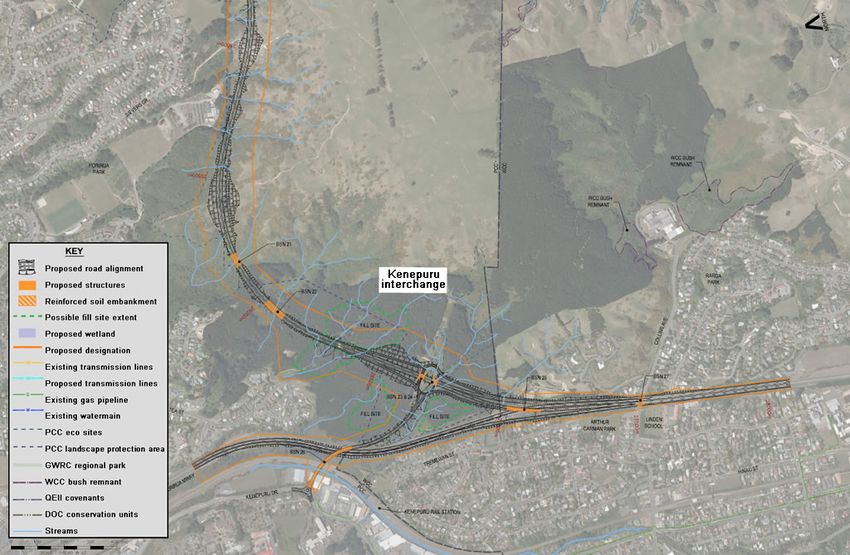
Transport Asset Management Plan 2012

       Please note: -

            1) Persons should accept the risk of using the documents or data in electronic format
               without requesting and checking them for accuracy against the original hard copy
               version; and
            2) Permission must be sought from Porirua City Council prior to publishing any information
               from this document.

PCC Transport Asset Management Plan 2012.DOC                                                             Page 3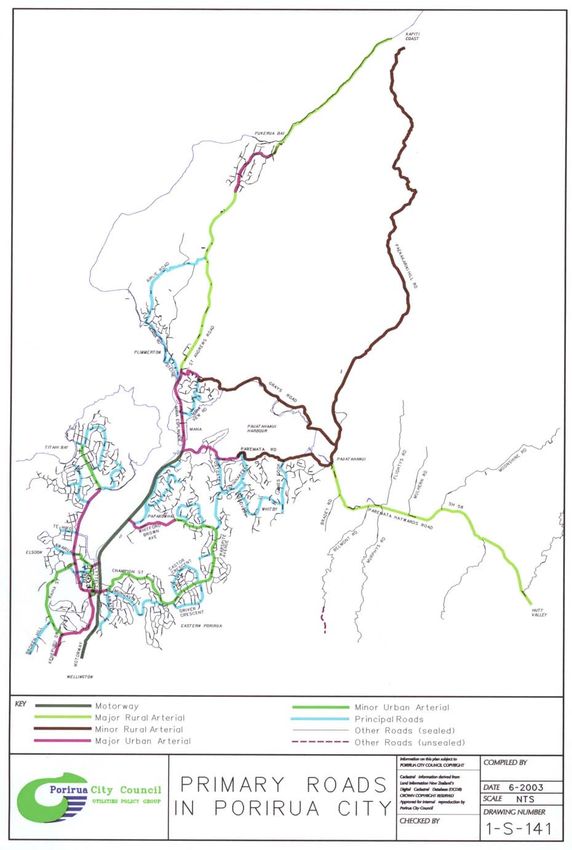
Transport Asset Management Plan 2012

       CONTENTS

       1      ASSET MANAGEMENT STRATEGY AND PLANNING ..........................................................7
              1.1      Asset Management Plan...................................................................................................7
                       1.1.1 Plan Purpose .......................................................................................................7
                       1.1.2 Linking between this Plan and other Council documents ..................................8
                       1.1.3 Layout of the Plan................................................................................................8
              1.2      Policy and Strategy ...........................................................................................................9
                       1.2.1 Policy....................................................................................................................9
                       1.2.2 Strategy............................................................................................................. 10
              1.3      Demand analysis............................................................................................................ 12
                       1.3.1 Demand Forecast Overview............................................................................. 12
                       1.3.2 Population Growth ............................................................................................ 12
                       1.3.3 Changes in Social Patterns.............................................................................. 13
                       1.3.4 Industrial and Commercial Growth................................................................... 13
                       1.3.5 District Plan Effects........................................................................................... 14
                       1.3.6 Demand Management...................................................................................... 16
                       1.3.7 Oil Price............................................................................................................. 16
                       1.3.8 Transmission Gully Motorway.......................................................................... 16
                       1.3.9 Overall Projected Demand on the Roading Network ...................................... 19
              1.4      Desired community outcomes and levels of service..................................................... 21
                       1.4.1 Rationale for Council Involvement ................................................................... 21
                       1.4.2 Desired Community Outcomes ........................................................................ 21
                       1.4.3 Levels of Service and Targets.......................................................................... 21
                       1.4.4 Emergency Response ...................................................................................... 22
              1.5      Negative effects ............................................................................................................. 23
                       1.5.1 Air Quality.......................................................................................................... 23
                       1.5.2 Effects From Surface Water Run-Off............................................................... 23
                       1.5.3 Noise Generation from Road Vehicles ............................................................ 24
                       1.5.4 Crashes on the Transport Network.................................................................. 24
              1.6      Key issues to take forward from Asset Management Strategy and Planning............. 24
       2      WHOLE-LIFE COST APPROACH.......................................................................................... 25
              2.1      Providing Long-term Value for Money........................................................................... 25
              2.2      Asset Valuation .............................................................................................................. 25
                       2.2.1 Objective ........................................................................................................... 25
                       2.2.2 The Basis of Valuation ..................................................................................... 25
                       2.2.3 Asset Valuation................................................................................................. 25
              2.3      Pavement Maintenance ................................................................................................. 27
                       2.3.1 Brief Description of the Pavement Structure ................................................... 27
                       2.3.2 Maintenance Strategy for Pavements.............................................................. 27
                       2.3.3 Strategy for Placement of Asphalt and Chipseal............................................. 28
                       2.3.4 Strategy for the Maintenance of Unsealed Roads .......................................... 28
              2.4      Maintenance Strategy for Roading Structures.............................................................. 29
                       2.4.1 Inspection for Scour.......................................................................................... 29
                       2.4.2 Seismic Screening............................................................................................ 29
                       2.4.3 Remaining Life Analysis ................................................................................... 29
              2.5      Maintenance Strategy for Other Roading Assets ......................................................... 29
                       2.5.1 Footpaths and cyclepaths ................................................................................ 29
                       2.5.2 Other Transport Assets .................................................................................... 30
              2.6      Key issues to take forward from Whole-life Cost Justification...................................... 30
       3      LIFECYCLE DELIVERY .......................................................................................................... 31
              3.1      Asset Creation / Acquisition........................................................................................... 31
                       3.1.1 Initial Asset Creation......................................................................................... 31
                       3.1.2 Road Asset Acquisition .................................................................................... 31
                       3.1.3 Consents........................................................................................................... 31
              3.2      Asset Description ........................................................................................................... 32
                       3.2.1 Length of Route Types ..................................................................................... 33
                       3.2.2 Surface Types................................................................................................... 33
              3.3      Existing Asset Capacity ................................................................................................. 34
                       3.3.1 Existing Capacities ........................................................................................... 34

PCC Transport Asset Management Plan 2012.DOC                                                                                                               Page 4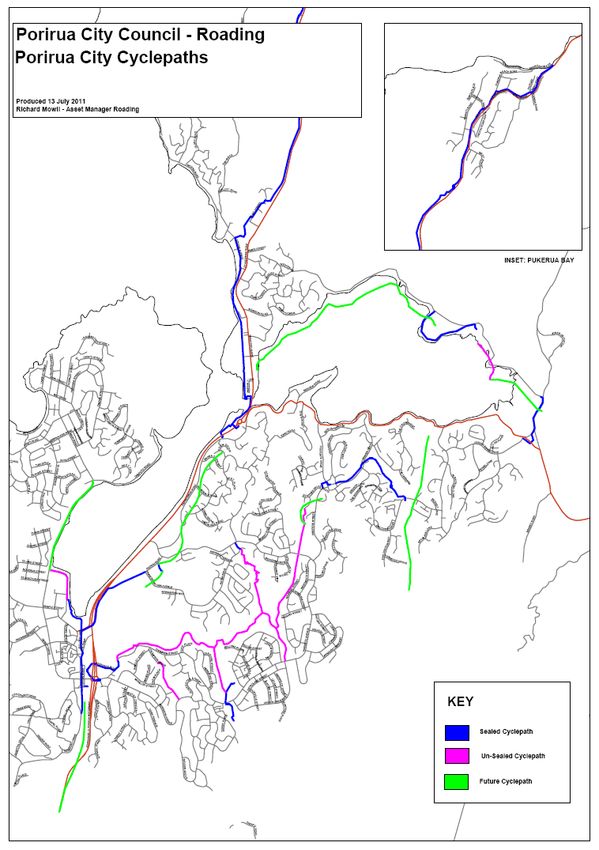
Transport Asset Management Plan 2012

                      3.3.2 Capacity Management ..................................................................................... 34
                      3.3.3 Summary........................................................................................................... 34
              3.4     Asset condition............................................................................................................... 35
                      3.4.1 Pavements ........................................................................................................ 35
                      3.4.2 Structures.......................................................................................................... 36
                      3.4.3 Footpaths .......................................................................................................... 37
                      3.4.4 Other roading assets ........................................................................................ 38
                      3.4.5 Customer satisfaction ....................................................................................... 40
              3.5     Asset maintenance and renewals ................................................................................. 42
                      3.5.1 Road Surface and Pavement Renewals.......................................................... 42
                      3.5.2 Structures maintenance ................................................................................... 42
                      3.5.3 Other Roading Maintenance ............................................................................ 43
                      3.5.4 Professional Services....................................................................................... 44
              3.6     Network improvements .................................................................................................. 44
                      3.6.1 Current Network Issues (overview).................................................................. 44
                      3.6.2 The Transmission Gully Motorway and Links.................................................. 45
                      3.6.3 Potential Roading Improvements – Prioritisation process .............................. 45
                      3.6.4 Potential New Local Large Roading Projects .................................................. 45
                      3.6.5 Road Safety ...................................................................................................... 46
              3.7     Maintenance, renewals, capital improvements summary – 10 year plan .................... 47
              3.8     Asset Disposal ............................................................................................................... 52
              3.9     Key issues to take forward from Lifecycle Delivery ...................................................... 52
       4      ASSET KNOWLEDGE SYSTEMS.......................................................................................... 53
              4.1     Asset Knowledge Standards ......................................................................................... 53
              4.2     Asset Knowledge Systems ............................................................................................ 54
                      4.2.1 Roading Asset Database – Road Assessment Maintenance Management .. 54
                      4.2.2 Data Management System – Hummingbird .................................................... 54
                      4.2.3 Other Knowledge Systems............................................................................... 55
                      4.2.4 Analysis Models................................................................................................ 55
              4.3     Asset Knowledge and Data ........................................................................................... 55
              4.4     Key issues to take forward from Asset Knowledge Systems ....................................... 56
       5      ORGANISATION AND PEOPLE ............................................................................................ 57
              5.1     Organisational Structure and Culture............................................................................ 57
                      5.1.1 Organisation structure ...................................................................................... 57
                      5.1.2 Organisation culture ......................................................................................... 57
              5.2     Individual Competence and Behaviour ......................................................................... 57
                      5.2.1 Competence ..................................................................................................... 57
                      5.2.2 Behaviour.......................................................................................................... 57
                      5.2.3 Keeping Abreast of Changes in the Roading Industry .................................... 57
              5.3     Contract and Supply Management................................................................................ 58
                      5.3.1 In-house and contracted out items of work...................................................... 58
                      5.3.2 Roading Maintenance Contract ....................................................................... 58
                      5.3.3 Procurement of roading services ..................................................................... 59
              5.4     Key issues to take forward from Organisation and People .......................................... 59
       6      RISK, CONFIDENCE LEVELS AND REVIEW....................................................................... 60
              6.1     Risk Assessment and Management.............................................................................. 60
                      6.1.1 Risk identification and treatment...................................................................... 60
              6.2     Assumptions and Confidence Levels ............................................................................ 60
                      6.2.1 Assumptions and data confidence................................................................... 60
              6.3     Future Improvements to this Plan ................................................................................. 62
                      6.3.1 Improvement of Asset Data Quality ................................................................. 62
                      6.3.2 Structures management................................................................................... 62
                      6.3.3 Network capacity .............................................................................................. 63
                      6.3.4 High Risk Rural Roads ..................................................................................... 63
                      6.3.5 Update of the Utilities Major Emergency Response Plan ............................... 63
                      6.3.6 Improvements Summary .................................................................................. 63
       7      FINANCIAL REQUIREMENTS................................................................................................ 64
              7.1     Economic Life and Depreciation.................................................................................... 64
              7.2     Funding Streams and Mechanism ................................................................................ 64

PCC Transport Asset Management Plan 2012.DOC                                                                                                              Page 5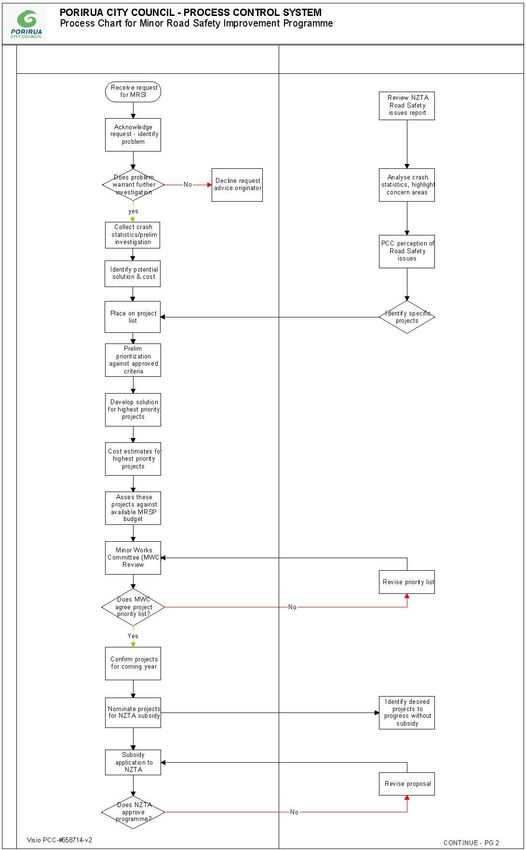
Transport Asset Management Plan 2012

       8      APPENDICES .......................................................................................................................... 65
              8.1      Appendix 1 - Glossary or Definition of Terms ............................................................... 65
              8.2      Map of Porirua cyclepath network ................................................................................. 68
                       8.2.1 Selection process ............................................................................................. 69
                       8.2.2 Prioritisation of Minor Safety Projects .............................................................. 71
              8.3      Appendix 3 - Chipseal and asphalt placement locations.............................................. 72
              8.4      Appendix 4 - Risk Management Framework and Matrix .............................................. 73
                       8.4.1 Risk Framework................................................................................................ 73
                       8.4.2 Roading Risk Matrix ......................................................................................... 76
              8.5      Appendix 5 - Large Project Prioritisation Criteria.......................................................... 80
              8.6      Appendix 6 - Potential large roading projects ............................................................... 88

PCC Transport Asset Management Plan 2012.DOC                                                                                                             Page 6
Transport Asset Management Plan 2012

       1 Asset Management Strategy and Planning

       1.1     Asset Management Plan

       1.1.1    Plan Purpose

       Asset Management may be defined as:

       “The combination of management, financial, economic, engineering and other practices, applied
       to physical assets with the objective of providing the required level of service in the most cost
       effective manner”.
                                     The International Infrastructure Management Manual Version 3 2006.

       The tenth Schedule of the Local Government Act 2002, requires Councils to include in Long
       Term Plans (LTPs) the following information in relation to groups of activities and assets or
       groups of assets –

       Group of Activities:
       (1) A Long-Term Plan must, in relation to each group of activities of the local authority, -
               (a) identify the activities within the group of activities:
               (b) identify the rationale for delivery of the group of activities (including the community
               outcomes to which the group of activities primarily contributes):
               (c) outline any significant negative effects that any activity within the group of activities
               may have on the social, economic, environmental, or cultural well-being of the local
               community:
                (d) identify the assets or groups of assets required by the group of activities and
                identify, in relation to those assets or groups of assets, -
                          (i) how the local authority will assess and manage the asset management
                          implications of changes to –
                                    (A) demand for, or consumption of, relevant services; and
                                    (B) service provision levels of standards:
                          (ii) what additional asset capacity is estimated to be required in respect of
                          changes to each of the matters described in subparagraph (i):
                          (iii) how the provision of additional asset capacity will be undertaken:
                          (iv) the estimated costs of the provision of additional asset capacity identified
                          under subparagraph (ii), and the division of those costs between each of the
                          matters in respect of which additional capacity is required:
                         (v) how the costs of the provision of additional asset capacity will be met:
                         (vi) how the maintenance, renewal, and replacement of assets will be
                         undertaken:
                         (vii) how the costs of the maintenance, renewal, and replacement of assets will
                         be met:
                (e) include the information specified in sub clause (2) –
                         (i) in detail in relation to each of the first 3 financial years covered by the plan;
                         and
                         (ii) in outline in relation to each of the subsequent financial years covered by
                         the plan.
       (2) The information referred to in sub clause (1) (e) is -
                (a) a statement of the intended levels of service provision for the group of activities,
                including the performance targets and other measures by which actual levels of service
                provision may meaningfully be assessed:
                (b) the estimated expenses of achieving and maintaining the identified levels of service
                provision, including the estimated expenses associated with maintaining the service
                capacity and integrity of assets:

PCC Transport Asset Management Plan 2012.DOC                                                                     Page 7
Transport Asset Management Plan 2012
(c) a statement of how the expenses are to be met:
(d) a statement of the estimated revenue levels, the other sources of funds, and the
rationale for their selection in terms of section 101(3).
Asset management planning is “knowing” about assets: what they are, where they are, what
condition they are in, how much they are worth, what level of service is expected of them and at
what cost. Other things that must be known are how the assets are performing, what extra
capacity they have, what future capacity is required, when they need to be replaced or
upgraded, (and at what cost), what further works are required to meet future demand and what
improvements are programmed.
1.1.2 Linking between this Plan and other Council documents
The following diagram shows the linkages between the Council’s various planning documents
including the Long Term Plan (LTP) and Asset Management Plans (AMPs).
Porirua Development
Porirua Development District Plan
Framework District Plan
Framework
Council Input Documents
Council Input Documents Long Term Plan
• Council’s st rat egic plans ASSET MANAGEMENT PLAN/ S Long Term Plan
• Council’s st rat egic plans ASSET MANAGEMENT PLAN/ S
• Communit y out comes
• Communit y out comes
• Levels of services Includes a reconciliat ion of
• Levels of services Includes a reconciliat ion of
• Regional plans financial budgets for planned
• Regional plans financial budgets for planned
• Growt h project ions act ivity
• Growt h project ions act ivity
• Legislat ive requirement s
• Legislat ive requirement s
Annual Plan
Annual Plan
3-yearly review of plan
Figure 1 - Council Planning Activity
Asset Management Plans are the link between the Council’s 'input' documents (shown in the
blue box in the diagram), and what happens at a tactical and operational level.
This Transport Asset Management Plan (the Plan) was first developed in 1997 alongside other
Council plans for core infrastructure assets, such as water supply, wastewater and stormwater,
in accordance with the Local Government Act 1974. Since then, the Plan has been regularly
updated and has become an essential part of the Council’s strategic and operational framework
for the delivery of water services. The Plan is scheduled for triennial updates, to coincide with
and inform the review of Council’s Long Term Council Community Plan.
In 2008, MWH (Consultants) were engaged by the Council to review the then present version of
the Plan. The key issues raised within that peer review have been included within this document
to ensure that this plan matches sector best practice.
1.1.3 Layout of the Plan
The layout of this Plan has been adapted from the template of the AMCL Asset Management
Excellence Model. This model provides for six areas of Asset Management, as shown in Table
1. For this Asset Management Plan, a seventh section entitled 'Finance' has been added. The
PCC Transport Asset Management Plan 2012.DOC Page 8Transport Asset Management Plan 2012
Finance section details funding implications of the Plan and revenue sources. This structure
gives the basis for the logic flow of this document.
Note that a Glossary, or definition of terms, is included in Appendix 1 – Section 8.1.
Chapter Title
1 Asset Management Strategy & Planning
2 Whole-life Cost Justification
3 Lifecycle Delivery
4 Asset Knowledge Systems
5 Organisation & People
6 Risk, Confidence Levels & Review
7 Finance
8 Appendices
Table 1 - AMCL Asset Management Excellence Model
1.2 Policy and Strategy
1.2.1 Policy
This Transport Asset Management Plan is aligned with the following legislation and documents:-
Land Transport Management Act 2003
(1) The purpose of this Act is to contribute to the aim of achieving an affordable, integrated,
safe, responsive, and sustainable land transport system.
(2) To contribute to that purpose, this Act—
(a) provides an integrated approach to land transport funding and management; and
(b) improves social and environmental responsibility in land transport funding, planning,
and management; and
(c) provides the New Zealand Transport Agency (NZTA) with a broad land transport focus;
and
(d) improves long-term planning and investment in land transport, including planning and
investment in coastal shipping and rail; and
(e) ensures that land transport funding is allocated in an efficient and effective manner;
and
(f) improves the flexibility of land transport funding by providing for alternative funding
mechanisms.
It should be noted that, NZTA manages the subsidy of Council roading activities, and assesses
potential Council funding applications against the above criteria. This is important for the
Council, as funding applications will have the greatest chance of success if they align with the
NZTA requirements.
PCC Transport Asset Management Plan 2012.DOC Page 9Transport Asset Management Plan 2012
Land Transport Act 1998
An Act—
(a) To promote safe road user behaviour and vehicle safety; and
(b) To provide for a system of rules governing road user behaviour, the licensing of drivers,
and technical aspects of land transport, and to recognise reciprocal obligations of
persons involved; and
(c) To consolidate and amend various enactments relating to road safety and land
transport; and
(d) To enable New Zealand to implement international agreements relating to road safety
and land transport
The above legislation governs some of the technical aspects that must be included within the
Council's management of its roading network.
New Zealand Transport Strategy
In August 2008, the government launched a set of defined targets and associated actions for
the transport sector to achieve over the next 30 years. This is the first time specific targets have
been set for the whole sector and they are detailed in two key documents: the New Zealand
Transport Strategy 2008 (NZTS) and the first Government Policy Statement on Land Transport
Funding (GPS). These documents are part of a raft of changes to the transport sector and will
be the driving force to achieving an affordable, integrated, safe, responsive and sustainable
transport system.
Government Policy Statement on Land Transport Funding
The Government Policy Statement on Land Transport Funding (GPS) sets out the government’s
priorities for the National Land Transport Fund over the next 10 years.
The Policy Statement details the funding allocation between activities such as road safety
policing, state highways, local roads and public transport. The Statement also discusses how
NZTA may assess funding applications, in accordance with the updated Strategy. It should be
noted, however, that the above Strategy is liable to change if successive governments take
opposing policy directions. This plan aligns with the GPS of 2011, which includes a re-
affirmation of the Governments continued focus on 'Roads of National Significance', including
the proposed Transmission Gully Motorway.
1.2.2 Strategy
The Wellington Regional Land Transport Strategy
The Wellington Regional Land Transport Strategy (RLTS) is a statutory document (prepared
under the Land Transport Act 1998) that Greater Wellington Regional Council is required to
produce via the Regional Land Transport Committee (RLTC). The RLTS guides the
development of the region’s transport system including provisions for; public transport, roads,
walking, cycling and freight for the next ten years and beyond.
The RLTS 2007 – 2016 was adopted by Greater Wellington Regional Council on 19 July 2007,
following the consideration of feedback from 1,300 public submissions and results of a
telephone survey, of 800 residents and 100 businesses.http://www.gw.govt.nz/Market-research-
report-RLTS-review/
The adopted Strategy includes a strong commitment to public transport and reducing
greenhouse gas emissions. It also recognises the importance of a strategic road network which
PCC Transport Asset Management Plan 2012.DOC Page 10Transport Asset Management Plan 2012
operates safely and efficiently. The Strategy contains outcomes and ambitious new targets in
relation to increasing the use of sustainable transport modes such as passenger transport,
walking and cycling. Other focus areas include reducing greenhouse gas emissions, improving
road safety, reducing severe traffic congestion, improving freight efficiency and improving land
use and transport integration.
The RLTS specifically outlines, in specific terms the roading projects that Porirua City Council
may consider in delivering roading improvements on the network.
Compatibility of the Plan with the Wellington Regional Land Transport Strategy
Porirua City Council, as part of its maintenance programme and new land transport projects
supports the objectives of the Wellington Regional Land Transport Strategy in the following
ways:
1. Improve Road Safety:
The Council is determined to achieve Regional and Central Government
targets as stated in the Road Safety Strategy 2010, by undertaking the
followingwork:
Minor safety projects
Community safety works
New roading projects.
2. Pedestrians and Cyclists:
The Council seeks to:
Increase the mode share of pedestrians and cyclists
Provide an acceptable level of service for cycleways and footpaths
Serve most urban road frontages with safe footpath.
3. Reduce Greenhouse Gas Emissions:
Council seeks to mitigate these negative greenhouse effects by encouraging
pedestrian and cycle use, and by road enhancements to reduce congestion.
4. Improve Land Use And Transportation Integration:
Council asset managers contribute to the assessment of subdivision proposals.
The Council encourages good integrated design and assists in this outcome by
contributing to the provision of supporting public infrastructure.
5. Reduce Road Congestion:
The Council assesses the priority for new projects by using national best
practice, which includes consideration of benefits from reduced road
congestion.
The road safety aspect of the above strategy also aligns with the Government strategy of 'Safer
Journeys – NZ's Road Safety Strategy 2010-20.
Council's Strategic Direction
Porirua City Council is managed as a business. The role of elected members is similar to that of
a board of directors; they set the strategic direction in consultation with shareholders – in this
case, the community, and this is set out in the Long Term Plan (LTP) and Annual Plan. The
Executive Management Team (EMT) - comprising the Chief Executive, General Managers and
Communications & Marketing Manager - are responsible for efficient and effective
implementation of these plans. Each business group works within this wider Council context.
PCC Transport Asset Management Plan 2012.DOC Page 11Transport Asset Management Plan 2012
The elected members have set a direction for the Council, in the LTP, to become known for
“City Leadership” - encompassing four strategic priorities:
A City of Villages
A Healthy and Protected Harbour
A Growing City
A Great City Experience.
Porirua Land Transportation Strategy
The Council is developing the Porirua Land Transportation Strategy to analyse traffic modes
and demands. The Strategy will outline proposed improvements and new land transport
projects. The development of strategies for Cycleway and Pedestrian networks and for Travel
Demand Management are nearing completion.
Analysis of the roading network requires consultation with stakeholders and residents. It is
expected that the Strategy will be completed in 2011.
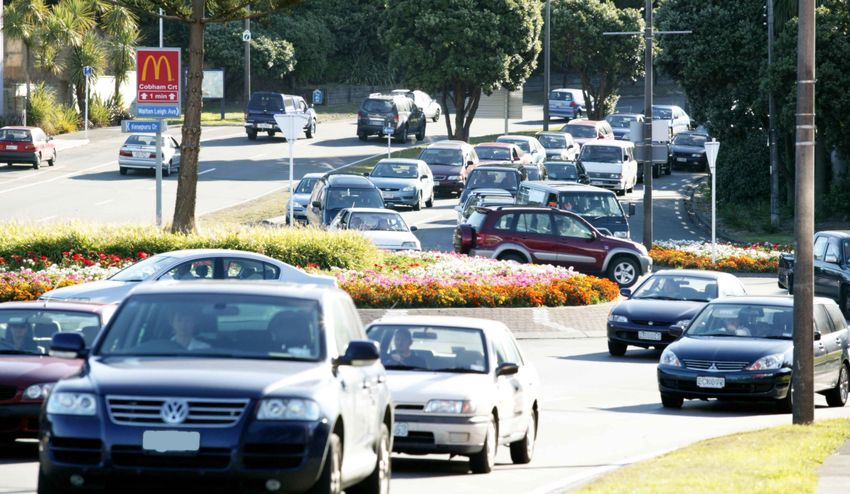
1.3 Demand analysis
1.3.1 Demand Forecast Overview
The effective management of assets must attempt to satisfy demand and promote optimum use,
to ensure present and future returns on the funds invested. Demand management and growth
forecasting have particular significance for roading assets because the majority of assets are
expected to be maintained for a significant period of time. Change in use and the required level
of service through increased or decreased demand, technological advancement or funding
restriction is inevitable. Demand management involves providing a level of service, standard or
capacity appropriate to current and future demand.
Although working as a relatively stable transportation network for some years, the construction
of the Transmission Gully section of State Highway, construction commencing in 2016, partially
running through the area, will have a significant effect on traffic patterns on PCC roads.
The assessment of traffic demand prior to the opening of Transmission Gully is relatively
straightforward, as it is based on existing patterns of road usage adapted to projected increases
in population and development of housing areas in the area. A rigorous assessment of traffic
demand after the opening of Transmission Gully has been carried out by NZTA, and this
assessment has been adopted in this demand forecast, as detailed in Table 4 below.
1.3.2 Population Growth
Population growth is a useful indicator of potential traffic growth. Specific changes in population
or demographics that need to be monitored due to their influence on traffic demand are total
growth (for effects on the overall network, particularly arterials), zonal growth (for effects on
localised areas), and age distribution. Age distribution is important since an increase in the 5-20
year range could possibly result in increased peak traffic demand in some zones, particularly
near educational institutions. A predominately elderly population may reduce traffic demand in
an extreme case where a large percentage of people may be unable to drive.
Statistics New Zealand (SNZ) prepares a summary of population projections as an output from
each five yearly national census. SNZ projections are based on the scenario of medium fertility,
medium mortality and medium migration rates. They are not exact forecasts but are a measure
of future population change by applying such assumptions over the entire projection period.
PCC Transport Asset Management Plan 2012.DOC Page 12Transport Asset Management Plan 2012
The last decade has seen little growth in the City's population and the medium projection is for
the trend of minimal growth to continue over the next two decades.
Table 2 summarises the projected Porirua City populations and households from 2012 to 2022.
The SNZ Medium series have been used, for 'general planning' purposes, for the 2012-22 LTP
period, as shown:
Population Projection for 2012-22 LTP Period - Porirua City
2012 2016 2022
52,940 53,900 54,820
Households Projection for 2012-22 LTP Period - Porirua City
17,680 18,400 19,300
Table 2 - Population and Household projections
The population growth, shown above, is relatively modest. The effects on Porirua roads of the
opening of the Transmission Gully motorway will have a much greater effect on traffic volumes
and patterns than modest population growth. This is demonstrated in the traffic demand figures
in Section 1.3.
The effect of traffic growth in new subdivisions is effectively accounted for at the time of
subdivision through planning control. The Code of Practice relating to the design and
construction of subdivisions requires all predictable traffic demand to be accommodated.
Although population growth projections are important in traffic demand estimations, changes in
social patterns may have a more significant effect. Such change is readily measured through
annual traffic counting and public surveys.
Population growth and subdivision effects have been taken into account in the overall projection
of traffic demand in Porirua.
1.3.3 Changes in Social Patterns
Changes in social patterns can also have a significant effect on traffic demand. Whilst
population change may indicate growth in an area, it may not necessarily reflect any
appreciable increase in traffic.
Changes in social patterns are measured through surveys, including customer satisfaction
surveys, and direct counting of actual traffic volumes.
Traffic surveys are carried out by Porirua City Council. The frequency of traffic counts are as per
the following schedule, shown in Table 3 below.
Road Hierarchy Frequency of Traffic Counts
Primary arterials and other strategic routes Six monthly
Distributors, Collectors Annually
All other roads excluding some minor cul-de-sacs Five yearly
Table 3 - Frequency of traffic counts on Council's roading network
1.3.4 Industrial and Commercial Growth
PCC Transport Asset Management Plan 2012.DOC Page 13Transport Asset Management Plan 2012
Commercial and heavy vehicle movements have a significant effect on the integrity of roads and
are a primary consideration in the design of pavement strength and road surfacing. Industry in
Porirua is currently experiencing growth and this is expected to continue at a significant rate,
anticipated to be prompted by the improved regional access provided by the construction of the
Transmission Gully motorway. This anticipated growth has been incorporated into the traffic
modelling figures shown in Section 1.3.
Prospective industrial or commercial development is of interest, due to the potential effects on
the roading network. Initiatives to ensure that the impact of these activities on existing
infrastructure is minimised or controlled are:
zoning of land to ensure that activities are appropriate to how the land is able to be
serviced and the capacity of existing services
control of activities through the Resource Consent process
study of the effects of existing land use and the capacity of the infrastructure to meet its
needs.
The projected changes in commercial and industrial use in Porirua have been taken into
account in the overall demand calculations for Porirua transport.
High Productivity Motor Vehicles
The government is introducing a new system for allowing 'High Productivity Motor Vehicles'
(HPMVs) on the New Zealand Roading network. HPMVs are normally slightly heavier (they may
be around 50 tonnes rather than the normal limit of 44 tonnes) or slightly longer than current
limits to allow repeated loads to be carried on specific routes. The Council is liaising with NZTA
and local hauliers about this system, and is assessing the impact HPMVs will have on roading
pavements and structures.
1.3.5 District Plan Effects
Zone changes influence the way land is used and similarly affects utilisation of the road
network. Zone changes mainly occur in areas of undeveloped or under utilised land,
predominantly rural land.
PCC Transport Asset Management Plan 2012.DOC Page 14Transport Asset Management Plan 2012
Figure 2 - Council hierarchy of roads
PCC Transport Asset Management Plan 2012.DOC Page 15Transport Asset Management Plan 2012
Initiatives taken to cater for future growth in these areas include the design and implementation
of minimum road widths, during the reconstruction or new construction of roading assets. These
aspects are captured within the re-zoning application processes, and are considered by Council
in relation to the long-term Porirua Development Plan. Comments on zone changes are
provided by the Roading department, to ensure the long-term integrity of the network.
1.3.6 Demand Management
The Council's Demand Management Strategy promotes the best utilisation of roading assets
and reduces the need to physically increase their capacity, strength or performance in the
following ways: -
Education
Education of the public can assist with prolonging the economic life of existing assets and
reduce the need to provide new assets. Such campaigns may include, discouraging parking on
footpaths, encouraging legitimate use of disabled person car parks, and promoting parking in
appropriate parking (time) zones.
Promoting Efficient Modes of Transport
Encouraging the use of public transport, car sharing and alternative forms of transport such as
cycling can reduce demand on congested roads or at congested intersections, thereby reducing
or deferring the need to upgrade assets. These activities are outlined in the Porirua
Transportation Strategy document.
Road Hierarchy/Traffic Management
Establishing a road hierarchy system and managing traffic flow allows demand to be managed
through a network that provides; efficient routes, confines major negative effects (particularly
noise) to specific routes and allows growth on individual streets to occur in a more predictable
manner.
The Council's road hierarchy system is illustrated on the maps on Figure 2 - Council hierarchy
of roads.
The use of traffic calming and signage for route identification are other strategies used to control
traffic demand. Traffic calming reduces traffic speed appropriately for the surrounding
environment, and discourages higher volumes and congestion by through traffic. Calming is
used primarily in areas such as the CBD. Signage assists drivers with route identification and
also encourages traffic to follow a more appropriate and direct route to its destinations.
Installation of roundabouts and traffic signals on primary routes are also methods used to
control the flow of traffic and ensure efficiency of the route by minimising delay.
1.3.7 Oil Price
There is a potential for higher oil prices to lower demand for road use, and increase demand for
public transport use. The Council, in association with Greater Wellington Regional Council, will
monitor this possible change in demand, and form funding and implementation strategies to
address this issue.
1.3.8 Transmission Gully Motorway
PCC Transport Asset Management Plan 2012.DOC Page 16Transport Asset Management Plan 2012
Figure 3 - Overview of the preferred route of Transmission Gully shows an overview of the
preferred route of Transmission Gully, whilst Figure 4 - Overview of the potential Kenepuru
interchange and Figure 5 show the locations and configurations of intersections and link-roads
at Kenepuru and at the James Cook interchange.
Figure 3 - Overview of the preferred route of Transmission Gully
PCC Transport Asset Management Plan 2012.DOC Page 17Transport Asset Management Plan 2012
Figure 4 - Overview of the potential Kenepuru interchange
Figure 5 - Overview of the potential James Cook interchange and Whitby and Waitangirua Link
Roads
It should be noted that the 'Kenepuru Link' shown in Figure 4 will be State Highway. The Whitby
and Waitangirua link roads are intended to be local rural arterial roads, built by the time that the
Transmission Gully Motorway opens. The funding of the construction of these link roads is an
item presently a point of discussion between NZTA and Council.
The NZTA Transmission Gully project team have produced projections of future traffic flows, as
a result of the construction of the Transmission Gully project. These projections were based on
GWRC traffic models, and are the most likely to give 'best fit' projections.
PCC Transport Asset Management Plan 2012.DOC Page 18Transport Asset Management Plan 2012
It is anticipated that the Transmission Gully project will enhance access to, and around, Porirua,
and will have significant positive effects on economic growth in the Porirua area.
Traffic demand, incorporating data from NZTA's traffic modelling of the effects of Transmission
Gully are shown in the 'Overall Projected Demand on the Roading Network' section.
1.3.9 Overall Projected Demand on the Roading Network
The following traffic flow estimations have been produced taking into account: -
NZTA's traffic modelling for the Transmission Gully Motorway.
Council's estimations of population growth.
Traffic demand on the roading network is as shown in Table 4. The figures given for the year
2026 include for traffic flows produced after the opening of the Transmission Gully Motorway. It
should be noted that capacity analysis (see Section 3.3.1) has only been conducted on key
arterials and nodes on the network.
PCC Transport Asset Management Plan 2012.DOC Page 19Transport Asset Management Plan 2012
2006 Carriage
baseline 2026 2031 2041 way
Road AADT Estimate Estimate Estimate Capacity
Prosser Street at Intsct with Titahi Bay Road 5,918 6,818 7,218 7,418 30,000
Raiha Street at Intsct with Upper Main Drive 5,683 6,883 7,383 7,883 30,000
Broken Hill at Intsct of Raiha Street 4,690 6,590 6,890 7,090 30,000
Raiha Street North of Broken Hill Intsct 7,136 10,136 10,136 11,136 30,000
Main Road South of Raiha Street Intsct 14,928 14,928 15,928 16,928 30,000
Kenepuru Drive South of Bowland 16,043 24,043 25,043 25,043 30,000
Kenepuru Drive North of Bowland 17,850 17,850 17,850 18,850 30,000
Lyttelton Avenue East of Kenepuru Drive Intsct 1,230 2,390 2,650 2,930 30,000
Kenepuru Drive South of Titahi Bay Road Intsct 24,049 22,049 22,049 23,049 30,000
Champion Street North of Mungavin Ave Intsct 6,681 7,021 7,541 7,631 30,000
Mungavin Avenue East of Champion St Intsct 16,379 18,379 18,379 18,379 30,000
Mungavin Avenue West of Champion St Intsct 24,853 26,853 27,853 27,853 60,000
Titahi Bay Road on Mungavin Overbridge 39,953 39,953 39,953 39,953 60,000
Titahi Bay Road West of Kenepuru Intsct 24,376 32,376 33,376 33,376 60,000
Titahi Bay Road Sth of Lyttelton Ave Traffic Lights 15,955 16,955 16,955 16,955 60,000
Titahi Bay Road South of Prosser Stt Intsct 15,117 18,117 18,117 18,117 60,000
Titahi Bay Road Adjacent To Elsdon Park 17,405 20,405 21,405 21,405 30,000
Titahi Bay Road North of Te Hiko St Lights 18,205 19,205 20,205 20,205 30,000
Awarua Street East of Titahi Bay Road Intsct 6,195 7,050 7,150 6,950 30,000
Semple Street East of Titahi Bay Road Intsct 8,706 9,706 11,106 11,106 30,000
Parumoana Street West of The Ramp 12,776 12,476 12,576 12,376 30,000
Parumoana Street South of The Ramp 15,514 16,514 17,514 17,514 30,000
Lyttelton Avenue North of Walton Leigh Avenue 6,952 8,532 8,932 9,232 30,000
Walton Leigh Avenue North of Titahi Bay Road 11,245 12,955 13,155 13,155 30,000
Omapere St, Warspite to Postgate 7,714 6,814 6,914 6,914 30,000
Postgate Dr, Bosun tce to SH58 6,728 4,728 4,728 4,628 30,000
Spinnaker Dr, Bosun Tce to SH58 2,368 2,288 2,308 2,288 30,000
Discovery Dr, Spinnaker to James Cook 5,766 6,576 6,606 6,646 30,000
James Cook Dr, Discovery to Joseph Banks 3,428 1,778 1,778 1,778 30,000
James Cook Dr, Joseph Banks to SH58 3,522 2,092 2,102 2,092 30,000
Joseph Banks Dr, Navigation Dr to SH58 3,090 3,368 3,448 3,488 30,000
Grays Rd, SH1 to Pope St 6,358 3,068 3,148 3,188 30,000
Paekakariki Hill Rd, SH1 to Grays 2,252 1,102 1,112 1,132 30,000
Airlie Rd 1,497 1,537 1,567 1,657 30,000
Moana Rd 2,657 2,837 2,867 2,877 30,000
Oak Avenue - zone 150 150 150 150 30,000
Tirowhanga Rd - zone 320 230 230 230 30,000
Eskdale Rd, West of Lauderdale 580 580 580 580 30,000
Eskdale Rd, East of Lauderdale 517 337 337 347 30,000
Tweed Rd, South of Halladale -without zone 140 150 150 150 30,000
Papakowhai Rd, South of Tweed -without zone 140 150 150 150 30,000
Papakowhai Rd, North of Tweed 290 120 120 130 30,000
Table 4 – Estimated traffic demand on the roading network
Please note section 3.2 regarding the theoretical capacity of the roading network, particularly at
intersections, including Council's present work to assess more accurately capacities of the
network, and work to address areas where demand will exceed capacity in the future.
PCC Transport Asset Management Plan 2012.DOC Page 20Transport Asset Management Plan 2012
1.4 Desired community outcomes and levels of service
1.4.1 Rationale for Council Involvement
The Council is involved in transport asset management as a direct consequence of its role as
owner of public land for roading purposes. The Council has a statutory role and powers as a
Road Controlling Authority and has direct accountability to residents for local transport
networks.
The transport network plays a critical role in the Council’s services to the community. A safe and
effective transport network is an important element in achieving the goals of the Strategic Plan.
The transport activity provides for the maintenance and improvement of roads, bridges,
footpaths, access ways, street-lighting, graffiti control, and provision for patrolling of time-
restricted parking spaces.
1.4.2 Desired Community Outcomes
Transport and Roading functions of Council contribute to the following Community Outcomes,
as outlined in the Annual Plan, as shown in Table 5: -
Transport Subsidised Roading
Multicultural and creative
Strong families young and old
Active and healthy Yes
Learning for life
Prosperous
A safe city Yes Yes
Sustainably designed and built Yes Yes
A valued and natural environment Yes
Well connected and on the move Yes Yes
Table 5 - Council's desired community outcomes for transport and subsidised roading activities
1.4.3 Levels of Service and Targets
The Council's transport activity involves the maintenance of roads and bridges to ensure that
the movement of vehicles is safe and efficient. It also includes major drainage control,
emergency work, renewal of footpaths, safety projects and preventative maintenance.
These desired outcomes are included in the Annual Plan outputs and key performance
indicators as outlined below. All targets are reviewed against industry best practice. The targets
set in this plan are largely the same as those in the most recent past versions of this plan, to
allow for consistency of measurement between Plans.
The desired community outcome of "safe and efficient transport…" is measured in terms of
efficiency and public satisfaction by specific measures for areas of the transport network, as
detailed below. All measures are relevant to achievement of "economic growth and
employment. Measure 10 – 'Percentage of restricted City Centre card parks available' is
especially relevant to the economic health of the City Centre for businesses, employees and
visitors.
PCC Transport Asset Management Plan 2012.DOC Page 21Transport Asset Management Plan 2012
How will Council measure the service it provides?
What service is
Council going to Actual Target Source
provide? Measure 2010/ 2011/ 2012/ 2013/
11 12 13 14
Roads and bridges
1. Percentage of residents satisfied
76% 80% 80% 80% NRB Survey
with the road network
2. Number of maintenance requests New
80% 80% 80% Council Database
per 1000 households measure
3. Percentage of roads passable and
Maintenance
Roads and bridges open1 to traffic throughout the year 99.9% 99% 99% 99% Contractors
are adequate for the Reports
movement of all 4. Ride quality as measured by
vehicles in a safe and New Hold Hold Hold
"Smooth Travel Exposure" for Consultant Report
efficient manner. measure rating rating rating
sealed roads
5. Response Time to fix reported Council Call Centre
5 days 5 days 5 days 5 days
potholes for routine sites monthly report
Contractors
6. Performance by roading New
75% 75% 75% Performance
maintenance contractors measure
Monitoring Matrix
7. Number of Community Road
Safety Education Projects3 Management
7 5 5 5 Report
developed and run
8. Participants in road safety projects Project Participant
Road Safety program. 95% 85% 85% 85%
are satisfied with the program Evaluations
9. Number of reported crashes
involving an injury across the city 100 90 90 90 NZTA Report
per year
Pedestrian, cycle and transport facilities
Networks of footpaths 10. Distance of footpath renewals as
New
and cycle ways that per the roading maintenance 100% 100% 100% Contractors
measure
enable safe contract Reports
movement of
pedestrians and 11. Percentage of residents satisfied
with footpaths and walkways 78% 80% 85% 85% NRB Survey
cyclists.
City centre and suburban shopper car parking
Parking available for 12. Percentage of restricted City Annual Carpark
shoppers in the City Centre car parks available.4 25% 15% 15% 15% Survey
Centre.
1 ‘Passable and open’ means at least one lane open, except where an authorised road closure is in place or maintenance activities are required.
2 Smooth Travel Exposure (STE) is a measure of the percentage of vehicles travelling on roads with a roughness of less than 150 NAASRA (National
Association of Australian State Road Authorities) counts per km.
3 A ‘Road Safety Education Project’ is a programme developed to address key road safety issues in response to areas of concern as identified by the
Land Transport Safety Authority.
4 Availability is measured as the proportion of spaces that are unoccupied during peak hours on each day, averaged over a six- day period.
Table 6 - Current and Planned and Key Performance Indicators
1.4.4 Emergency Response
In case of any emergency event, the Council has to ensure that all of its assets are able to
provide safety to their users. It is accepted, however, that some of these assets may function at
a reduced level during and after an emergency.
The Council’s emergency response for its transport network is contained in the ‘Utilities Major
Emergency Response Plan,’ DRAFT April 2012.
PCC Transport Asset Management Plan 2012.DOC Page 22Transport Asset Management Plan 2012
1.5 Negative effects
The transport asset in Porirua does have some negative effects on the community and
environment. These are: -
Air quality effects from vehicle emissions
Adverse effects from surface water run-off
Noise generation from road vehicles
Crashes on the transport network.
The above negative effects have both an economic and wellbeing cost to the community. The
Strategy described in section 1.2 outlines the push towards active transport (walking and
cycling) and the use of public transport. These initiatives will lessen the negative effects outlined
above, but will not eliminate them.
The Council will address the negative effects of the transport asset in the following ways:
1.5.1 Air Quality
Both NZTA and Greater Wellington Regional Council (GWRC) have conducted air quality
monitoring as follows: -
NZTA
Passive monitoring of NO2 (as an indicator of traffic emission pollution) near State Highways
has been carried out nationally by NZTA. As part of this study, monitoring of NO2 has been
carried out on Mungavin Avenue, around 30m from the Mungavin Roundabout, between 2007
and 2009. The results of the monitoring showed between 17 and 20 microgrammes per m3 of
NO2 in the air during summer periods, and roughly half of those levels in wintertime periods
(Ambient air quality (nitrogen dioxide) monitoring network report 2007-2009. NZTA, New
Zealand). These values reflect well against the WHO guideline levels of 40 microgrammes per
m3. As these measurements were taken at a location that is likely to show the highest (or near
the highest) NO2 concentration in the Porirua area, it can be assumed that the air pollution in
and around the remainder of the Porirua roading network is well below levels that would
cause concern.
GWRC
GWRC have also completed air quality monitoring. However, this monitoring has centred on
Linden (at the north end of the Wellington City Council area), and has been focussed on
gathering information relating to air pollutants from household activities (such as domestic
woodburners). Whilst no road-side air quality monitoring has been undertaken by GWRC, air
pollution levels measured at Linden Park are well within national standards and guidelines for
air quality.
The Porirua City Council will continue to assess the results of the air quality monitoring
studies, and address concerns if pollutant levels rose to concerning levels.
1.5.2 Effects From Surface Water Run-Off
Pollution from road water run-off includes things such as; fuels, additives, oil, grease and brake
and tyre residues. These pollutants contain a variety of toxic components, including heavy
PCC Transport Asset Management Plan 2012.DOC Page 23You can also read