Association between African Dust Transport and Acute Exacerbations of COPD in Miami - MDPI
←
→
Page content transcription
If your browser does not render page correctly, please read the page content below
Journal of
           Clinical Medicine

Article
Association between African Dust Transport and
Acute Exacerbations of COPD in Miami
Miguel Pardinas Gutierrez 1 , Paquita Zuidema 2 , Mehdi Mirsaeidi 1,3 , Michael Campos 3, *,†
and Naresh Kumar 4, *,†
 1    Pulmonary and Critical Care, Jackson Memorial Hospital, Miami, FL 33136, USA;
      mpardinasg@gmail.com (M.P.G.); msm249@miami.edu (M.M.)
 2    Rosenstiel School of Marine and Atmospheric Science, University of Miami, Miami, FL 33149, USA;
      pzuidema@miami.edu
 3    Division of Pulmonary, Allergy, Critical Care and Sleep Medicine, University of Miami School of Medicine,
      Miami, FL and Miami Veterans Affairs Medical Center, Miami, FL 33136, USA
 4    Environmental Health Division, Department of Public Health Sciences, University of Miami School
      of Medicine, Miami, FL 33136, USA
 *    Correspondence: MCampos1@med.miami.edu (M.C.); nkumar@miami.edu (N.K.);
      Tel.: +1-305-243-4854 (M.C. & N.K.)
 †    Equal contributors as senior authors.

 Received: 6 July 2020; Accepted: 29 July 2020; Published: 3 August 2020

 Abstract: Background: Air pollution is increasingly recognized as a risk factor for acute exacerbation
 of chronic obstructive pulmonary disease (COPD). Changing climate and weather patterns can modify
 the levels and types of air pollutants. For example, dust outbreaks increase particulate air pollution.
 Objective: This paper examines the effect of Saharan dust storms on the concentration of coarse
 particulate matter in Miami, and its association with the risk of acute exacerbation of COPD (AECOPD).
 Methods: In this prospective cohort study, 296 COPD patients (with 313 events) were followed between
 2013 and 2016. We used Light Detection and Ranging (LIDAR) and satellite-based Aerosol Optical
 Depth (AOD) to identify dust events and quantify particulate matter (PM) exposure, respectively.
 Exacerbation events were modeled with respect to location- and time-lagged dust and PM exposures,
 using multivariate logistic regressions. Measurements and main results: Dust duration and intensity
 increased yearly during the study period. During dust events, AOD increased by 51% and particulate
 matter ≤2.5 µm in aerodynamic diameter (PM2.5 ) increased by 25%. Adjusting for confounders,
 ambient temperature and local PM2.5 exposure, one-day lagged dust exposure was associated
 with 4.9 times higher odds of two or more (2+ hereto after) AECOPD events (odds ratio = 4.9;
 95% CI = 1.8–13.4; p < 0.001). Ambient temperature exposure also showed a significant association
 with 2+ and 3+ AECOPD events. The risk of AECOPD lasted up to 15 days after dust exposure,
 declining from 10× higher on day 0 to 20% higher on day 15. Conclusions: Saharan dust outbreaks
 observed in Miami elevate the concentration of PM and increase the risk of AECOPD in COPD
 patients with recurring exacerbations.

 Keywords: Saharan dust outbreak; COPD; climate change; particulate matter; extreme weather

1. Introduction
     Acute exacerbations of chronic obstructive pulmonary disease (AECOPD) are events that
significantly alter the course of the disease by accelerating lung function decline, negatively impacting
quality of life and increasing mortality [1–3]. It is unclear why AECOPD are particularly frequent
events for some subjects and not for others. Although genetic risk factors are being actively sought [4],

J. Clin. Med. 2020, 9, 2496; doi:10.3390/jcm9082496                                   www.mdpi.com/journal/jcm
J. Clin. Med. 2020, 9, 2496                                                                        2 of 17

it is imperative to not only focus on genetic and epigenetic factors, but also on the environmental
factors that influence them.
       Epidemiological studies suggest an increased risk of exacerbations during high air pollution
episodes [5–8], accounting for up to 9% of hospital admissions for AECOPD [9]. Among air pollutants,
inhalation of particulate matter (PM) ≤2.5 µm and ≤10 µm in aerodynamic diameter (PM2.5 and
PM10 , respectively) is linked to altered immunity, oxidative stress, as well as airway and systemic
inflammation [10,11]. In urban areas, the main sources for these pollutants are anthropogenic, including
the combustion of fossil fuel and biomass burning [12]. However, the mechanical breakdown of Earth0 s
crust, as well as the regional and global transport of desert dust, contributes to PM exposure as well.
These dust events are becoming more frequent in some regions with intensifying global warming and
desertification [13]. African dust is of particular interest not only because it accounts for half of the
total dust emission [14,15], but also because transported dust has been frequently observed across
multiple continents, including Europe [16] and the Americas [17]. The dust event is characterized
by a high concentration of coarse particles (PM2.5–10 ) that travel far distances, typically crossing the
Atlantic in approximately 10 days [15], and they may circumnavigate the globe within 13 days at
higher latitudes on occasion [18]. Air sampling, conducted in the Caribbean and South Florida since
the 1970s, has clearly documented elevated levels of PM during dust events [19–21], with most of the
transported dust particles being ≥2.5 µm and ≤10 µm in aerodynamic diameter (PM10–2.5 ), and the
remaining fraction of particles are ≤2.5 µm [21]. During dust events, levels of PM10 exceed the WHO
threshold of good air quality (50 µg/m3 /24 h) in the Caribbean and South Florida [22].
       Although there is overwhelming epidemiological and toxicological evidence for the adverse health
effects of PM2.5 and PM10 on pulmonary and cardiovascular diseases [23,24], including AECOPD [8],
only a few studies provide insight into the adverse health effects of transported dust in the US.
Most studies document the effects of dust events that occur in Asia [25–27], but none have evaluated
the impact of African dust transported to America on AECOPD. Leveraging a well-characterized
COPD cohort, air pollution data and dust data, this paper examines the risk of AECOPD with respect to
time-lagged exposure to transported dust, adjusting for exposure to local air pollution and confounders
including ambient temperature and smoking status.

2. Materials and Methods

2.1. Study Site
     This study included patients from the Miami catchment area, defined as an area located within
the geographic range of 81◦ W to 80◦ W and 25◦ N to 27.15◦ N, because 91% of the COPD patients
enrolled in the study lived within the catchment area.

2.2. Study Design and Subjects
     We used a prospective clinical cohort design to recruit patients. COPD patients were enrolled
during their pulmonary clinic visits to the Miami Veterans Affairs (VA) Medical Center between 2013
and 2016. COPD was defined as the presence of airflow obstruction in spirometry (FEV1 /FVC < 0.7
(or lower limit of the normal) after administrating a short acting bronchodilator). COPD patients
without any episode of exacerbation during the clinic visit were offered an opportunity to participate
in the study. They were followed every 6 months for their regular COPD care. During their clinic visit,
their medical records were reviewed for any episodes of emergency room visit, hospitalization and
outpatient visits to identify all AECOPD episodes. AECOPD events were defined by an increase in
respiratory symptoms that required administration of systemic steroids, antibiotics, or both. All events
were defined as cases and subjects who did not experience any AECOPD events during the study
period as controls. For each AECOPD event, date, smoking status and date of symptom onset were
recorded after the chart review. This study was approved by the Miami VA IRB (IRBNet ID 1161589-9).
J. Clin. Med. 2020, 9, 2496 3 of 17
2.3. Environmental Data
PM2.5 exposure assessment: PM2.5 data were not available at/around the place of residence for
any of the subjects. We used a hybrid approach to compute location- and time-lagged PM2.5 exposure.
This approach used ground monitored PM2.5 data from Environmental Protection Agency (EPA) sites
within Florida, satellite data from NASA and meteorological data from the National Climatic Data
Center (NCDC). Hourly ambient PM2.5 data were acquired from the EPA for all sites in Florida within
84◦ W to 79◦ W and 24.5◦ N to 29.2◦ N from 2012 to 2016 [28]. This extent was included for two different
reasons. First, the transported Saharan dust impacts most parts of Florida. Second, there are only two
sites in Miami-Dade County where hourly PM2.5 is monitored. Data from multiple sites were needed
to develop an empirical relationship between satellite-based Aerosol Optical Depth (AOD) and PM2.5
monitored on the ground, in order to extrapolate location and time–space estimate of PM2.5 for the
entire study area.
MODerate Resolution Imaging Spectroradiometer (MODIS) data, onboard NASA0 s Terra and
Aqua satellites, were used to compute AOD, which was needed in order to determine daily PM2.5
exposure at the place of residence of each subject. A total of 8.9 million AOD values were computed
at 3 km spatial resolution from 2012 to 2016 [29,30]. Global surface hourly meteorological data,
such as temperature, humidity, wind velocity and atmospheric sea level pressure, were acquired from
the NCDC. An empirical relationship between in situ monitored PM2.5 and AOD was developed,
adjusting for meteorological conditions. A unit of AOD corresponded with ~21.4 µg/m3 . Extrapolating
this relationship, PM2.5 was estimated for each day and location wherever AOD was computed
using satellites (see Sinha and Kumar [31] for details), and results of the empirical model are shown
in Tables 1 and 2 and Figures 1 and 2. Using the local time–space kriging (LTSK) [32], daily PM2.5
exposure was computed for 15 days before each AECOPD event, and daily exposure for up to 15 days
before a clinic visit for controls.
Table 1. Empirical association between moderate resolution imaging spectroradiometer (MODIS) AOD
(at 3 km spatial resolution) and PM2.5 monitored on the ground in South Florida, 2012–2016 (regression
coefficient and 95% confidence interval in parenthesis).
Regression Coefficients (95%
Variables
Confidence Interval in Parenthesis)
21.44 ***
AOD
(19.62–23.26)
0.64 ***
Season category (0 = October to March, 1 = otherwise)
(0.17–1.11)
Factor of Meteorological Conditions (dominant variables 1.85 ***
atmospheric temperature and dew point) (1.58–2.12)
–0.69 ***
Factor of Meteorological Conditions (relative humidity)
(−0.89–−0.48)
7.17 ***
Constant
(6.81–7.52)
Observations 4398
R-squared 0.45
Robust 95% confidence interval in parentheses; *** p < 0.01. NOTE: To develop empirical association, AOD data
points were collocated with PM2.5 monitored on the ground if the time and geographic distance between AOD and
PM2.5 were ≤0.75 h (or 45 min) and ≤0.025◦ (~2.5 km), respectively.Mean sea level pressure (mb) −0.00650 −0.00624 0.7760
Relative humidity (%) −0.00762 0.57763 0.0734
% Variance explained 55.46 38.23
* Factor 1: temperature and dew point high loading along with negative association with atmospheric
J. Clin. Med. 2020, 9, 2496 4 of 17
sea level pressure SLP, ** Factor 2: relative humidity main dominant factor.
(A) (B)
Figure
Figure 1. 1. Association
Association between
between measuredPM
measured PM with
with
2.52.5 AOD
AOD and
and predicted
predicted PMPM values
values
2.52.5 during
during thethe study
study
period.
period. (A)(A) Association
Association between
between airborne
airborne PM2.5and
PM2.5 andAOD
AODininSouth
SouthFlorida,
Florida,2012–2016.
2012–2016. (B)(B) Predicted
Predicted
versus
versus observedPM
observed PM in in
2.52.5 South
South Florida,
Florida, 2012–2016.
2012–2016. AODAOD and
and PM PM were
were collocated
collocated if their
if their time
time stamps
stamps
J. Clin. Med.within
were 2020, 9,±0.75
x FORhPEER
and REVIEWwithin 0.025◦ (or ~2.4 km) geographic distance.
located 5 of 19
were within ±0.75 h and located within 0.025° (or ~2.4 km) geographic distance.
Figure2.2.Dust
Figure Dustevents
eventsrecorded
recordedbetween
between20142014and
and2016.
2016.LIDAR
LIDARdatadatacoupled
coupledwith
withininsitu
situmonitored
monitored
PM using both gravimetric and photometric methods were used to identify dust
PM10 using both gravimetric and photometric methods were used to identify dust days, and
10 days, and depolarized
ratio was used
depolarized as awas
ratio proxy of as
used dust intensity.
a proxy Theintensity.
of dust colored graphs showgraphs
The colored the LIDAR
showreadings,
the LIDARwith higher
readings,
depolarization ratios are shown in red. The bar graphs show the corresponding increases in
with higher depolarization ratios are shown in red. The bar graphs show the corresponding increases dust mass
recorded by weighing air filters [33].
in dust mass recorded by weighing air filters [33].
Dust exposure assessment: Days of Saharan dust event and dust intensity were estimated using
a Light Detection and Ranging (LIDAR) instrument [34,35], which allowed us to develop a vertical
profile of aerosols and transported dust (Figure 2). In situ PM10 data monitored by gravimetric and
photometric methods were used to identify dust days, and the LIDAR volume depolarization ratioJ. Clin. Med. 2020, 9, 2496 5 of 17
Table 2. Factor loading of meteorological conditions. Factor 1 and 2 together explained 94% of the
total variance.
Variable Factor 1 * Factor 2 ** Uniqueness
Wind speed (m/s) 0.00437 −0.03431 0.7825
Ceiling Height (m) −0.00381 0.02124 0.7487
Visibility (m) 0.00656 −0.03306 0.7531
Dry Bulb Temperature ◦ F 0.60116 −0.62288 0.0286
Dew Point (◦ F) 0.43451 0.62488 0.0263
Mean sea level pressure (mb) −0.00650 −0.00624 0.7760
Relative humidity (%) −0.00762 0.57763 0.0734
% Variance explained 55.46 38.23
* Factor 1: temperature and dew point high loading along with negative association with atmospheric sea level
pressure SLP, ** Factor 2: relative humidity main dominant factor.
Dust exposure assessment: Days of Saharan dust event and dust intensity were estimated using
a Light Detection and Ranging (LIDAR) instrument [34,35], which allowed us to develop a vertical
profile of aerosols and transported dust (Figure 2). In situ PM10 data monitored by gravimetric and
photometric methods were used to identify dust days, and the LIDAR volume depolarization ratio
was used as a proxy of dust intensity (Figure 2). Since most parts of South Florida are affected by
transported dust similarly on a given day, all events and controls were considered as exposed during
those days. Daily dust exposure was computed for 15 days before the exacerbation date for AECOPD
events and clinic exam date for controls who did not have any AECOPD events during the study
period. Distributive inverse time weighted lagged dust exposure (Xit|l| ) for ith subject on tth day, and lth
lag day, before the exacerbation was computed as
Xit|l| ~ ΣlL (D|t−l| . (1/l))/ΣlL (1/l) (1)
where D|t−l| is dust intensity on the lth day before the exacerbation event for the cases, and before the
clinical exam day for controls; l is time 1,2,3, . . . ,L, and L = 15 days.
Analytical Method. The analytical strategy builds on the following assumptions: (i) ambient
exposure to Sub-Saharan dust (Xit ) is likely to be same for all subjects on a given day because
transported dust is part of the large air masses; (ii) ambient daily PM2.5 exposure is likely to be
unique for each subject at his/her place of residence due to spatiotemporal heterogeneity in PM2.5
sources; (iii) smoking, age, severity of lung function and ambient temperature can confound the risk of
AECOPD; and (iv) severity and patterns of AECOPD are likely to be unique for each patient. Risk of
AECOPD was modelled using a multivariate logit model with standard error adjusting for intragroup
correlation for multiple events for some patients (i.e., logit function with vce(cluster) option) in STATA
version 14.2 [36].
3. Results
3.1. Subjects and AECOPD Prevalence
A total of 296 unique COPD patients were recruited. Between 2013 and 2016, 34% (or 101) had one
or more episodes of AECOPD. These subjects were of comparable age, but had lower lung function,
as detailed in Table 3. Only six of them were women (and four of them did not have an exacerbation).
All had a smoking history (43.2% active smokers at study entry). For the analysis, we excluded subjects
who did not reside in the Miami catchment area (28 controls and 16 AECOPD events), leaving a total
of 297 AECOPD episodes and 166 controls (Table 4).J. Clin. Med. 2020, 9, 2496 6 of 17
Table 3. Clinical and demographic characteristics of veterans with COPD studied in Miami between
2013 and 2016.
Subjects without Subjects with at
ALL p-Value
AECOPD * (Controls) Least 1 AECOPD *
N 296 194 102
Age (years) ± 95%
70.0 ± 8.7 69.8 ± 8.9 70.3 ± 8.5 0.48
confidence interval (CI)
Concomitant asthma (%) 33 (11.1) 13.1 9.4 0.33
Number of exacerbations
during 4-year study 1.99 ± 3.9 - 2.7 ± 5.0 -
period ± 95% CI
Post bronchodilator lung function values
FEV1 (L), ± 95% CI 1.6 ± 1.2 1.81 ± 1.7 1.42 ± 0.5 0.015
FEV1 (%), ± 95% CI 46.0 ± 17.0 48.9 ± 18.0 43.2 ±15.5 0.006
FVC (L), ± 95% CI 2.9 ± 0.7 3.1 ± 0.7 2.8 ± 0.7 0.001
FVC (%), ± 95% CI 68.9 ± 16.3 71.3 ± 15.4 66.6 ± 16.8 0.019
FEV1/FVC (%), ± 95% CI 51.4 ± 13.4 52.6 ± 13.6 50.3 ± 13.3 0.15
DLCO (%),± 95% CI 53.1 ± 15.3 53.9 ± 14.7 52.2 ± 15.8 0.37
* AECOPD: acute exacerbation of COPD.
Table 4. AECOPD * events recorded among the 296 COPD patients studied in Miami between 2013
and 2016.
Events in Miami Catchment Area
GROUP AECOPD Events Number of Subjects Total
NO YES
Controls 0 194 28 166 194
1 42 6 36 42
Cases 2 19 4 34 38
≥3 41 6 227 233
Total 296 44 463 507
* AECOPD: acute exacerbation of COPD.
J. Clin. Med. 2020, 9, x FOR PEER REVIEW 7 of 19
3.2. PM2.5 Exposure
3.2. PM2.5 exposure.
The annual average concentrations of PM2.5 , AOD and meteorological conditions in the study
The annual
area are presented in average
Table 3. concentrations of PM
The daily average 2.5, AOD and meteorological conditions
PM 3 in the study
2.5 concentration was 10.5 µg/m between 2013 and
area are presented in Table 3. The daily
3 average PM2.5 concentration was 10.5 µg/m3 between 2013
2016, below the EPA threshold (12 µg/m ) [37]. There was a strong seasonal trend in PM2.5 and AOD
and 2016, below the EPA threshold (12 µg/m3) [37]. There was a strong seasonal trend in PM2.5 and
distribution, with both peaking during the summer and fall seasons, which coincided with the dust
AOD distribution, with both peaking during the summer and fall seasons, which coincided with the
outbreak season (Figure 3).
dust outbreak season (Figure 3).
Monthly PM2.5 Monthly AOD
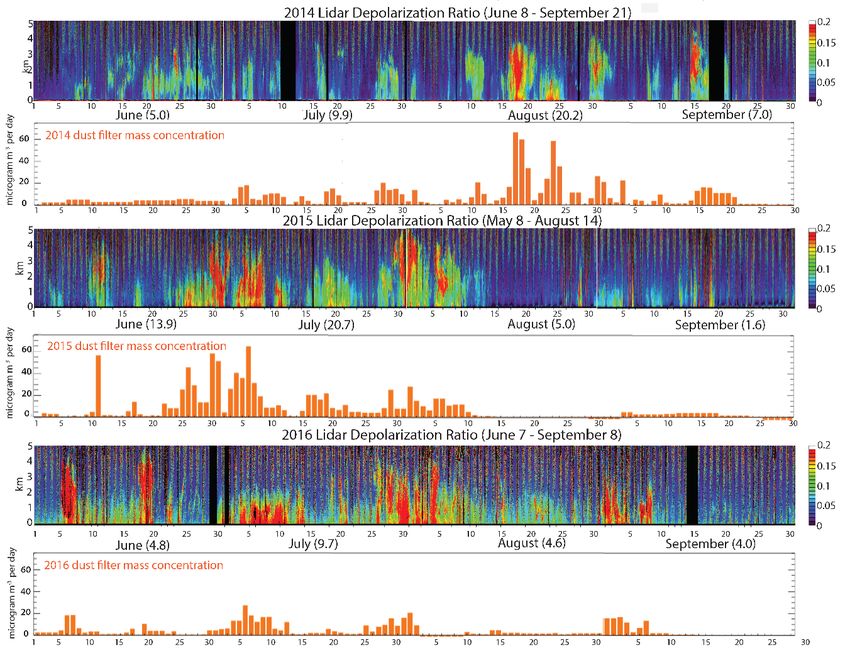
Figure 3. 3(a) Subjects and AECOPD prevalence. 3(b) PM2.5 exposure. Monthly distribution of
Figure 3. Monthly distribution of particulate material during the study period in South Florida.
particulate material during the study period in South Florida. The graphs show the average values of
The graphs show the average values of PM2.5 and AOD recorded per month during the period
PM2.5 and AOD recorded per month during the period 2012–2016. Note the higher values during
2012–2016. Note the higher values during summer months.
summer months.
The concentration of PM2.5 did not vary significantly between the Miami catchment (10.5 µg/m3)
and the rest of Florida (9.5 µg/m3), excluding dust days, but the AOD concentration in the Miami
catchment was significantly higher than that outside the catchment area (0.168 in Miami catchment
versus 0.13 outside the catchment; difference ~0.038; p < 0.0001) (Table 5). The differences in theJ. Clin. Med. 2020, 9, 2496 7 of 17
The concentration of PM2.5 did not vary significantly between the Miami catchment (10.5 µg/m3 )
and the rest of Florida (9.5 µg/m3 ), excluding dust days, but the AOD concentration in the Miami
catchment was significantly higher than that outside the catchment area (0.168 in Miami catchment
versus 0.13 outside the catchment; difference ~0.038; p < 0.0001) (Table 5). The differences in the
meteorological conditions inside and outside the Miami catchment area were not statistically significant,
but a deeper, more humid atmosphere above Miami could generate aerosol swelling that may explain
a higher AOD above Miami, as evident from the slightly higher dew points (Table 5). The ambient
surface temperature was also slightly higher during events (22.14 ◦ C during dust events versus 20.96 ◦ C
during non-dust events; difference ~1.17 ◦ C; p < 0.001).
Table 5. AOD, PM2.5 and meteorological conditions recorded during dust and non-dust events in the
Miami catchment area (2013 to 2016).
Dust Event Intensity *
During No
≤0.10 0.11–0.15 ≥0.15 Total
Dust Event
(Low) (Medium) (High)
Miami Catchment (n = 1,322,344)
0.162 0.198 0.246 0.241 0.168
Aerosol Optical Depth (AOD)
(0.161–0.162) (0.196–0.199) (0.244–0.247) (0.240–0.242) (0.168–0.169)
21.0 22.6 22.3 23.1 21.2
Surface Temperature (◦ C)
(21.0–21.0) (22.5–22.6) (22.3–22.3) (23.1–23.1) (21.2–21.2)
17.6 19.3 18.7 19.9 17.8
Dew Point (◦ C)
(17.6–17.6) (19.3–19.4) (18.7–18.8) (19.9–19.9) (17.8–17.8)
77.6 78.4 76.9 78.5 77.7
Relative Humidity (%)
(77.6–77.6) (78.3–78.5) (76.8–76.9) (78.4–78.5) (77.6–77.7)
10.3 12.0 12.9 13.1 10.5
Particulate Matter ≤ 2.5 µm (PM2.5 ) (µg/m3 )
(10.3–10.3) (11.9–12.0) (12.9–13.0) (13.0–13.1) (10.5–10.5)
Florida excluding Miami Catchment Area (n = 7,648,441)
0.124 0.175 0.201 0.189 0.130
Aerosol Optical Depth (AOD)
(0.124–0.124) (0.175–0.176) (0.201–0.202) (0.189–0.189) (0.130–0.130)
21.0 22.2 21.5 22.4 21.1
Surface Temperature (◦ C)
(21.0–21.0) (22.1–22.2) (21.5–21.5) (22.4–22.4) (21.1–21.1)
17.6 18.9 18.1 19.2 17.7
Dew Point (◦ C)
(17.6–17.6) (18.9–18.9) (18.1–18.1) (19.2–19.2) (17.7–17.7)
77.4 78.2 77.7 78.4 77.4
Relative Humidity (%)
(77.4–77.4) (78.1–78.2) (77.7–77.8) (78.4–78.5) (77.4–77.5)
9.5 11.4 11.7 11.7 9.6
Particulate Matter ≤ 2.5 µm (PM2.5 ) (µg/m3 )
(9.5–9.5) (11.4–11.4) (11.7–11.7) (11.7–11.7) (9.6–9.6)
Florida (n = 8,970,785)
0.130 0.179 0.209 0.197 0.136
Aerosol Optical Depth (AOD)
(0.130–0.130) (0.178–0.179) (0.209–0.210) (0.197–0.197) (0.135–0.136)
21.0 22.2 21.6 22.5 21.1
Surface Temperature (◦ C)
(21.0–21.0) (22.2–22.2) (21.6–21.6) (22.5–22.5) (21.1–21.1)
17.6 19.0 18.2 19.3 17.7
Dew Point (◦ C)
(17.6–17.6) (19.0–19.0) (18.2–18.3) (19.3–19.3) (17.7–17.7)
77.4 78.2 77.6 78.4 77.5
Relative Humidity (%)
(77.4–77.4) (78.2–78.2) (77.5–77.6) (78.4–78.5) (77.5–77.5)
9.6 11.5 11.9 11.9 9.8
Particulate Matter ≤ 2.5 µm (PM2.5 ) (µg/m3 )
(9.6–9.6) (11.4–11.5) (11.9–11.9) (11.9–11.9) (9.8–9.8)
* Estimated with the aid of LIDAR depolarization ratios.
3.3. PM2.5 and AOD during the Dust Outbreak
Dust events were grouped and their intensity graded based on the depolarization ratio from
LIDAR. Both PM2.5 and AOD were significantly higher during dust events as compared to non-dust
event days (Table 5 and Figure 4). For example, PM2.5 concentration was 20% higher during the dust
events, and AOD increase was 37.7% during the low dust events (i.e., when the depolarization ratio
was 0.1 or less) in the entire study area, but it increased to 60.1% during medium and high dust events
in the entire region. The average AOD during medium and high dust events in the Miami catchment
was >0.24 as compared to 0.162 during no-dust events (mean difference ~0.081; p < 0.001). A similarDust events were grouped and their intensity graded based on the depolarization ratio from
LIDAR. Both PM2.5 and AOD were significantly higher during dust events as compared to non-dust
event days (Table 5 and Figure 4). For example, PM2.5 concentration was 20% higher during the dust
events, and AOD increase was 37.7% during the low dust events (i.e., when the depolarization ratio
was 0.1 or less) in the entire study area, but it increased to 60.1% during medium and high dust events
J. Clin. Med. 2020, 9, 2496 8 of 17
in the entire region. The average AOD during medium and high dust events in the Miami catchment
was >0.24 as compared to 0.162 during no-dust events (mean difference ~0.081; p < 0.001). A similar
pattern was observed in areas outside the catchment, suggesting most parts of Florida experience a
similar exposure to sub-Saharan dust (Table
(Table 6).
6).
.1 2
m e a n (A O D )
.1 1.1
2013 2014 2015 2016
NO Dust Dust Event
Figure 4. Mean AOD readings in the catchment area 2013–2014 during non-dust and dust events.
Figure 4. Mean AOD readings in the catchment area 2013–2014 during non-dust and dust events.
Note: average AOD readings during dust and non-dust events have been increasing since 2013. AOD:
Note: average AOD readings during dust and non-dust events have been increasing since 2013. AOD:
Aerosol Optical Depth (AOD), a proxy of aerosol exposure, was computed at 3 km spatial resolution
Aerosol Optical Depth (AOD), a proxy of aerosol exposure, was computed at 3km spatial resolution
using satellite-derived MODerate Resolution Imaging Spectroradiometer (MODIS) data.
using satellite-derived MODerate Resolution Imaging Spectroradiometer (MODIS) data.
Table 6. Average LIDAR * depolarization ratios during dust events and total dust days recorded by
Table
month6.and
Average
year inLIDAR
Miami,*FL,
depolarization ratios during dust events and total dust days recorded by
USA, 2013–2016.
month and year in Miami FL USA, 2013–2016.
2013 2014 2015 2016
2013
0.16 2014
0.13 2015
0.14 2016
0.14
June 0.16
(0.15–0.17) 0.13
(0.12–0.14) 0.14
(0.13–0.16) 0.14
(0.12–0.15)
June 7 days
(0.15–0.17) 16 days
(0.12–0.14) 15 days
(0.13–0.16) 17 days
(0.12–0.15)
7 days
0.13 160.13
days 15 days
0.15 17 days
0.17
July (0.11–0.15)
0.13 (0.12–0.15)
0.13 (0.14–0.17)
0.15 (0.16–0.18)
0.17
July 9 days
(0.11–0.15) 9 days
(0.12–0.15) 20 days
(0.14–0.17) 23 days
(0.16–0.18)
0.11
9 days 9 0.15
days 0.16
20 days 0.14
23 days
August (0.09–0.12) (0.14–0.17) (0.15–0.17) (0.13–0.16)
0.11 0.15 0.16 0.14
9 days 17 days 9 days 20 days
August (0.09–0.12) (0.14–0.17) (0.15–0.17) (0.13–0.16)
0.14
9 days 170.14
days 90.11
days 0.18
20 days
September (0.11–0.16) (0.10–0.17) (0.10–0.13) (0.18–0.18)
0.14
4 days
0.14
6 days
0.11
10 days
0.18
8 days
September (0.11–0.16) (0.10–0.17) (0.10–0.13) (0.18–0.18)
0.13 0.14 0.14 0.16
4 days 6 days 10 days
(0.12–0.14) (0.13–0.15) (0.14–0.15) (0.15–0.16)
8 days
Total
0.13
29 days 0.14
48 days 0.14
54 days 0.16
68 days
Total (0.12–0.14) (0.13–0.15) (0.14–0.15) (0.15–0.16)
* LIDAR: Light Detection and Ranging; 95% confidence interval shown in parenthesis. NOTE: Depolarization ratios
represent dust intensity: ≤0.10 mild,29 days moderate
0.11–0.15 48 days 54 days
and ≥0.15 severe 68 days
dust events.
* LIDAR: Light Detection and Ranging; 95% confidence interval shown in parenthesis. NOTE:
3.4. Dust Outbreak Duration
Depolarization and Intensity
ratios represent dust intensity: ≤0.10 mild, 0.11–0.15 moderate and ≥0.15 severe dust
events.
Most dust outbreaks occur during the summer and fall months (June to September), and the
LIDAR data suggest an increase in dust duration as well as dust intensity from 2013 to 2016 (Table 6
and Figure 2). For example, the average number of days with significant dust increased from 29 in
2012 to 68 in 2016, and the average depolarization ratio increased from 0.13 in 2013 to 0.16 (difference
~0.03; p < 0.001). With the exception of 2013, the number of dust event days has increased from June to
September between 2014 and 2016, suggesting expanding dust events over the fall seasons (Figure 5).LIDAR data suggest an increase in dust duration as well as dust intensity from 2013 to 2016 (Table 6
and Figure 2). For example, the average number of days with significant dust increased from 29 in
2012 to 68 in 2016, and the average depolarization ratio increased from 0.13 in 2013 to 0.16 (difference
~0.03; p < 0.001). With the exception of 2013, the number of dust event days has increased from June
to September between 2014 and 2016, suggesting expanding dust events over the fall seasons (Figure
J. Clin. Med. 2020, 9, 2496 9 of 17
5).
Figure 5. Monthly average depolarization ratio in the Miami catchment area during the summer
Figure 5. Monthly average depolarization ratio in the Miami catchment area during the summer
months, 2013–2016. Obtained using LIDAR, depolarization ratios represent a measure of dust intensity.
months, 2013–2016. Obtained using LIDAR, depolarization ratios represent a measure of dust
Values ≤0.1 represent mild dust events, 0.10–0.15 moderate events and ≥0.15 severe events.
intensity. Values ≤0.1 represent mild dust events, 0.10–0.15 moderate events and ≥0.15 severe events.
3.5. AECOPD by PM2.5 and Dust Exposure
3.e AECOPD by PM2.5 and dust exposure.
Ambient one-day lag PM2.5 exposure (at the place of residence) was ~15 µg/m3 for cases (i.e., 1 or
moreAmbient
AECOPD one-day
event)lag as PM 2.5 exposure
compared (at µg/m
to ~14 3 forof
the place residence)
controls. was ~15
Among µg/m3 for
subjects who cases (i.e., 1 or
experienced
more AECOPD event) as compared to ~14 µg/m 3 for controls.
2+ AECOPD during the study period, the one-day lag PM2.5 exposure was 18 ug/m . There were Among subjects who 3
experienced 2+
AECOPD during the study period, the one-day lag PM exposure
no controls on the days of first AECOPD during the dust event days. Thus, it was not feasible to
2.5 was 18 ug/m 3. There were no
controls
computeon the ratios
odds days of forfirst
firstAECOPD
AECOPD during
events.theThus,
dust analyses
event days. wereThus, it was not
restricted to 2+feasible
and 3+ toAECOPD
compute
odds ratios for first AECOPD events. Thus, analyses were restricted to
events. The results of the logistic regression, adjusted for age, smoking, asthma status, lung function 2+ and 3+ AECOPD events.
The results oftemperature,
and ambient the logistic regression,
are shown in adjusted
Table 7a. forAmong
age, smoking, asthma status,
all confounders, age andlungsmokingfunction
showedand
ambient
significanttemperature,
associationsare withshown
AECOPD in Table 7a. Among
in some all confounders,
of the models, but not all.age Theand smoking
risk of 2+ AECOPDshowed
significant
increases byassociations
14% with a with AECOPD
unit increase in some lag
in one-day of the
PM2.5models,
exposure but (odds
not all. The~1.14;
ratio risk of95% 2+confidence
AECOPD
increases
interval CI by=14%
1.08–1.19; p < increase
with a unit 0.001; Model in one-day
1). The lagone-day
PM2.5 exposure (oddstemperature
lag ambient ratio ~1.14; 95% alsoconfidence
showed a
positive association with 2+ AECOPD (odds ratio ~1.12; 95% CI = 1.033–1.217; p < 0.01 (Model 2)).
interval CI = 1.08–1.19; p < 0.001; Model 1). The one-day lag ambient temperature also showed a
positive association with 2+ AECOPD (odds ratio ~1.12; 95% CI
The odds of 2+ AECOPD was 5.7 times higher for one-day lag dust exposure without adjusting for= 1.033–1.217; p < 0.01 (Model 2)). The
odds
ambientof temperature
2+ AECOPDorwas local5.7
PMtimes higher(odds
2.5 exposure for one-day
ratio ~4.1; lag95%
dust = 2.08–16.01;
CI exposure p < 0.001
without adjusting
(Model for 3)).
ambient temperature or local PM exposure (odds ratio ~4.1; 95%
When adjusted for PM2.5 exposure and ambient temperature, the odds of 2+ AECOPD was 4.9 times
2.5 CI = 2.08–16.01; p < 0.001 (Model
3)). When
higher adjusted to
as compared fornon-dust
PM2.5 exposure
event days and(odds
ambient ratiotemperature,
~4.95; 95% CIthe = 1.82–13.45;
odds of 2+p < AECOPD
0.001; (Modelwas 4.9 6)).
times higher
The trend foras compared
subjects whotoexperienced
non-dust event days (odds
3+ AECOPD ratio the
during ~4.95; 95%period
study CI = 1.82–13.45;
remained pthe < 0.001;
same,
(Model
but the 6)).
odds The trend
ratio was forlower
subjects(Tablewho7b). experienced
However,3+ambient AECOPD during the
temperate, study periodand
independently remained
along
the
withsame,
PM2.5butandthedust
odds ratio wasshowed
exposure, lower (Table
a strong 7b). However,association
significant ambient temperate, independently
with 3+ AECOPD (Tableand 7b).
along with PM and dust exposure, showed a strong significant
For example, odds of 3+ AECOPD was 21% higher with a unit increase in ambient temperature when
2.5 association with 3+ AECOPD (Table
7b). For example,
the effects of PM2.5 oddsandofdust3+ AECOPD
exposurewas are 21% higher for
accounted with a unit
(odds increase
ratio ~1.21;in95% CI = temperature
ambient 1.096–1.345;
p < 0.01
when the(Model
effects6)).
of PM 2.5 and
Among alldust
the exposure
confounders areincluded
accounted in for
the(odds ratio
analysis, ~1.21;
only age95%
showedCI = a1.096–1.345;
marginally
psignificant
< 0.01 (Model 6)). Among
association with the AECOPD. all the confounders included in the analysis, only age showed a
marginally significant association with the AECOPD.
3.6. AECOPD and 15-Day Time-Lagged Dust Exposure
Daily time-lagged dust exposure was computed for 15 days before all AECOPD events, and 15 days
before clinic visits for controls. Dust exposure was conceptualized in three different ways, as follows:
(a) binary exposure—exposed if the dust event was observed on the lagged day, unexposed otherwise;
(b) dust intensity measured by LIDAR for each lagged day; and (c) distributive cumulative dust
intensity, which is an inversely time weighted average of dust intensity for a given time lag. The odds
of 2+ AECOPD and 3+ AECOPD were modeled separately with respect to all three measures of daily
lagged dust exposure (Table 8).J. Clin. Med. 2020, 9, 2496 10 of 17
Table 7. (a) Odds 2+ AECOPD among Miami veterans with COPD with respect to residential
PM2.5 levels, ambient temperature and dust exposures, 2013–2016; (b) Odds of 3+ AECOPD among
Miami veterans with COPD with respect to residential PM2.5 levels, ambient temperature and dust
exposures, 2013–2016.
(a)
2+ AECOPD
Variables
Model 1 Model 2 Model 3 Model 4 Model 5 Model 6
1.002 1.034 *** 1.040 *** 1.001 1.038 *** 1.001
Age (year)
(0.970–1.035) (1.009–1.059) (1.014–1.066) (0.968–1.035) (1.012–1.065) (0.968–1.035)
0.842 1.405 1.6 0.907 1.548 1.123
Asthma status (YES = 1, 0 otherwise)
(0.264–2.689) (0.717–2.756) (0.793–3.224) (0.278–2.964) (0.756–3.172) (0.349–3.611)
2.110 * 1.942 ** 1.998 ** 2.051 2.007 ** 2.112
Smoking status (1 = Active, 0 otherwise)
(0.891–4.996) (1.069–3.529) (1.087–3.671) (0.849–4.952) (1.066–3.779) (0.831–5.367)
1.008 1.002 1 1.006 0.998 0.999
Lung function (FEV1 /FVC)
(0.980–1.036) (0.982–1.021) (0.981–1.020) (0.978–1.035) (0.978–1.018) (0.972–1.028)
1.139 *** 1.124 *** 1.122 ***
One-day lag PM2.5 (µg/m3 )
(1.083–1.197) (1.068–1.184) (1.061–1.185)
1.121 *** 1.059 1.103 ** 1.062
One-day lag ambient temperature (◦ C)
(1.033–1.217) (0.960–1.169) (1.015–1.198) (0.961–1.173)
5.777 *** 5.222 *** 4.955 ***
One-day lag dust exposure (LIDAR intensity)
(2.084–16.010) (2.077–13.126) (1.826–13.449)
0.028 ** 0.002 *** 0.022 *** 0.010 *** 0.002 *** 0.011 **
Constant
(0.001–0.525) (0.000–0.036) (0.003–0.165) (0.000–0.327) (0.000–0.039) (0.000–0.385)
Observations 169 308 308 169 308 169
Values represent odds ratios and 95% confidence interval is shown in parenthesis; NA = Analysis not applicable
because variable(s) was not included in the analysis; *** p < 0.01, ** p < 0.05, * p < 0.1; 95% confidence interval in
parenthesis. Since there were gaps in the AOD data, location-specific daily PM2.5 measurement was not possible
for all days. Thus, the analysis was restricted to observations for all days when PM2.5 exposure computation was
feasible. Smoking status (active or not) was determined at the time of each independent COPD exacerbation episode
by reviewing their medical chart.
(b)
≥2 AECOPD
Variables
Model 1 Model 2 Model 3 Model 4 Model 5 Model 6
0.999 1.034 ** 1.038 *** 0.996 1.035 ** 0.994
Age (year)
(0.968–1.032) (1.005–1.064) (1.010–1.066) (0.961–1.032) (1.006–1.065) (0.960–1.030)
1.213 1.931 2.201 ** 1.587 2.028 * 1.78
Asthma status (YES = 1, 0 = otherwise)
(0.374–3.937) (0.869–4.289) (1.077–4.498) (0.426–5.910) (0.903–4.558) (0.480–6.603)
1.795 1.882 * 1.784 * 1.749 1.827 * 1.714
Smoking status (1 = Active, 0 = otherwise)
(0.761–4.232) (0.955–3.709) (0.953–3.341) (0.692–4.422) (0.916–3.644) (0.678–4.330)
1.005 0.998 1.001 1.002 0.997 0.998
Lung function (FEV1 /FVC)
(0.979–1.032) (0.977–1.020) (0.981–1.021) (0.974–1.031) (0.975–1.020) (0.970–1.027)
1.146 *** 1.111 *** 1.109 ***
One-day lag PM2.5 (µg/m3 )
(1.090–1.205) (1.050–1.175) (1.045–1.176)
1.315 *** 1.214 *** 1.301 *** 1.214 ***
One-day lag ambient temperature (◦ C)
(1.174–1.473) (1.096–1.344) (1.161–1.457) (1.096–1.345)
1.741 *** 1.581 ** 1.808 **
One-day lag dust exposure (LIDAR intensity)
(1.176–2.578) (1.041–2.401) (1.003–3.261)
0.025 ** 0.000 *** 0.016 *** 0.000 *** 0.000 *** 0.001 ***
Constant
(0.001–0.541) (0.000–0.001) (0.002–0.139) (0.000–0.030) (0.000–0.001) (0.000–0.037)
Observations 169 308 308 169 308 169
Values represent odds ratios and 95% confidence interval is shown in parenthesis; NA = Analysis not applicable
because variable(s) was not included in the analysis; *** p < 0.01, ** p < 0.05, * p < 0.1; 95% confidence interval in
parenthesis. Since there were gaps in the AOD data, location-specific daily PM2.5 measurement was not possible for
all days. Thus, the analysis was restricted to observation for all days when PM2.5 exposure estimates were available.
Smoking status (active or not) was determined for the time of each independent COPD exacerbation episode.J. Clin. Med. 2020, 9, 2496 11 of 17
Table 8. Results of the logistic regression—odds of AECOPD among Miami veterans with COPD with
respect to time-lagged dust exposures, 2013–2016.
Odds Ratio for AECOPD
Lag (day)
≥2 AECOPD ≥3AECOPD
Dust Event Dust Distributed Dust Event Dust Distributed
(0 = Yes, 1 = No) Intensity Lag (0 = Yes, 1 = No) Intensity Lag
10.074 *** 10.074 *** 7.781 *** 2.717 *** 2.717 ***
0 NA
(2.241–45.292) (2.241–45.292) (2.274–26.621) (1.460–5.057) (1.460–5.057)
19.930 *** 4.116 *** 4.340 *** 5.859 *** 2.193 *** 1.948 ***
1
(2.621–151.548) (1.700–9.963) (1.634–11.529) (1.991–17.242) (1.373–3.501) (1.259–3.014)
15.162 ** 4.269 *** 2.791 ** 5.959 *** 2.589 *** 1.684 ***
2
(1.895–121.291) (1.502–12.131) (1.247–6.247) (1.675–21.204) (1.496–4.482) (1.238–2.291)
NA 5.800 *** 2.632 ** 21.066 *** 3.603 *** 1.685 ***
3
(2.152–15.634) (1.225–5.654) (2.850–155.729) (1.825–7.114) (1.239–2.292)
14.443 *** 3.578 *** 2.201 *** 19.903 *** 3.566 *** 1.639 ***
4
(1.921–108.593) (1.489–8.597) (1.321–3.667) (2.649–149.532) (1.733–7.339) (1.276–2.106)
16.062 *** 4.585 *** 2.065 *** 10.155 *** 3.800 *** 1.586 ***
5
(2.154–119.792) (1.600–13.139) (1.244–3.430) (2.259–45.661) (1.648–8.765) (1.245–2.021)
NA 11.080 *** 2.032 *** 20.757 *** 5.433 *** 1.570 ***
6
(2.084–58.915) (1.247–3.310) (2.571–167.581) (1.721–17.153) (1.229–2.007)
7.021 *** 2.714 ** 1.781 *** 5.862 *** 2.570 *** 1.490 ***
7
(1.611–30.601) (1.160–6.354) (1.188–2.671) (1.661–20.692) (1.282–5.150) (1.186–1.873)
7.475 *** 2.558 ** 1.601 *** 6.226 *** 2.487 *** 1.416 ***
8
(1.725–32.395) (1.218–5.370) (1.131–2.264) (1.790–21.654) (1.316–4.701) (1.150–1.744)
7.956 *** 2.345 *** 1.461 *** 6.646 *** 2.178 *** 1.346 ***
9
(1.843–34.346) (1.272–4.322) (1.118–1.911) (1.918–23.037) (1.250–3.794) (1.127–1.609)
12.621 ** 2.936 ** 1.416 *** 7.408 ** 2.352 ** 1.313 ***
10
(1.541–103.354) (1.068–8.070) (1.124–1.784) (1.508–36.396) (1.080–5.119) (1.118–1.543)
12.186 ** 3.477 ** 1.376 *** 4.442 ** 2.249 ** 1.277 ***
11
(1.558–95.288) (1.058–11.423) (1.117–1.695) (1.160–17.019) (1.100–4.597) (1.105–1.476)
6.153 ** 3.127 ** 1.343 *** 4.986 ** 2.502 ** 1.256 ***
12
(1.393–27.186) (1.284–7.614) (1.112–1.623) (1.389–17.897) (1.184–5.288) (1.096–1.440)
6.635 ** 3.660 ** 1.315 *** 5.409 *** 2.885 ** 1.237 ***
13
(1.507–29.212) (1.357–9.868) (1.105–1.566) (1.515–19.309) (1.269–6.560) (1.086–1.409)
10.165 ** 7.322 ** 1.300 *** 6.164 ** 3.366 ** 1.222 ***
14
(1.317–78.442) (1.171–45.791) (1.103–1.533) (1.314–28.903) (1.194–9.487) (1.079–1.384)
NA 3.553 ** 1.282 *** 5.495 *** 2.823 *** 1.208 ***
15
(1.343–9.400) (1.090–1.507) (1.566–19.280) (1.291–6.173) (1.069–1.364)
AECOPD: Acute exacerbation of COPD; NA = could not be estimated; 95% confidence interval in parenthesis;
*** p < 0.01, ** p < 0.05.
All three measures of daily lagged dust exposure were associated with both 2+ AECOPD and 3+
AECOPD for up to 15 days (Figure 6). For example, odds of 2+ AECOPD and 3+ AECOPD were 28%
and 20% higher (even for the 15th day distributed lagged dust exposure), respectively (for 2+ AECOPD:
odds ratio = 1.28; 95% CI = 1.09–1.51; p < 0.001; for 3+ AECOPD: odds ratio = 1.21; 95% CI = 1.07–1.36;
p < 0.001; Table 8). For two other dust exposures, the odds of AECOPD varied with the increase in time
lag. For example, 2+ AECOPD were 10× more likely to occur with a unit increase in dust intensity on
the same day of the event, which gradually declined up to five days, and became 11× by six-day lag
(Figure 6). A similar pattern was observed for 3+ AECOPD. A dust exposure that occurred 15 days
before the AECOPD event was associated with 5.5× higher odds of 3+ AECOPD (odds ratio ~5.5;
95% CI = 1.57–19.3; p < 0.001).AECOPD: odds ratio = 1.28; 95% CI = 1.09–1.51; p < 0.001; for 3+ AECOPD: odds ratio = 1.21; 95% CI
= 1.07–1.36; p < 0.001; Table 8). For two other dust exposures, the odds of AECOPD varied with the
increase in time lag. For example, 2+ AECOPD were 10× more likely to occur with a unit increase in
dust intensity on the same day of the event, which gradually declined up to five days, and became
11× by six-day lag (Figure 6). A similar pattern was observed for 3+ AECOPD. A dust exposure that
J. Clin. Med. 2020,
occurred 15 9,days
2496 before the AECOPD event was associated with 5.5× higher odds of 3+ AECOPD
12 of 17
(odds ratio ~5.5; 95% CI = 1.57–19.3; p < 0.001).
(A) (B)
Figure
Figure 6. Dust
6. Dust lagged
lagged exposureand
exposure andrisk
riskof
ofAECOPD
AECOPD among
among Miami
Miamiveterans.
veterans.(A).
(A)Odds
Oddsratio
ratiofor
fortwo
two
or more AECOPD with respect to three different ways of assessing dust exposure: dust event (yes or
or more AECOPD with respect to three different ways of assessing dust exposure: dust event (yes
no) at a given lag (red line), dust intensity at a given lag (gray line) and cumulative (inverse time
or no) at a given lag (red line), dust intensity at a given lag (gray line) and cumulative (inverse time
weighted) dust event (black line) (B). Odds ratio of two or more AECOPD (black line) and three or
weighted) dust event (black line). (B) Odds ratio of two or more AECOPD (black line) and three or
more AECOPD (red line) with respect to cumulative inverse time weighted dust exposure.
more AECOPD (red line) with respect to cumulative inverse time weighted dust exposure.
4. Discussion
4. Discussion
ThisThis study
study shows
shows a significantincrease
a significant increaseininAOD
AODas aswell
well as
as PMPM2.5 during the Saharan dust events
2.5 during the Saharan dust events
in Florida. The time-lagged dust exposure was associated with an increaseininthe
in Florida. The time-lagged dust exposure was associated with an increase therisk
riskofofAECOPD
AECOPD
among COPD patients, and this risk lasted for weeks after the exposure. PM2.5 exposure and ambient
among COPD patients, and this risk lasted for weeks after the exposure. PM2.5 exposure and ambient
temperature also showed independent associations with the risk of COPD exacerbation (for both 2+
temperature also showed independent associations with the risk of COPD exacerbation (for both 2+
and 3+ AECOPD) events. These findings are consistent with the emerging body of literature that
and 3+ AECOPD) events. These findings are consistent with the emerging body of literature that
shows a direct link between dust exposure and increase in the risk of different diseases, including
shows a direct link between dust exposure and increase in the risk of different diseases, including
pneumoconiosis and granulomatous diseases [14] and asthma exacerbations [38,39]. A study
pneumoconiosis
conducted in and granulomatous
Taiwan showed a 20% diseases [14]inand
increase asthma exacerbations
COPD-related [38,39]. A study
hospital admissions conducted
in response to
in Taiwan showed a 20% increase in COPD-related hospital admissions in response
dust exposure [40]. A recent study also documents a 3.6-fold increase in COPD exacerbations with to dust exposure [40].
A recent study in
the increase also
PMdocuments a 3.6-fold increase in COPD exacerbations with the increase in PM10
10 during four dust storms [41].
during four dust storms [41].
Dust events are likely to become more frequent and intense with changing climate and weather
Dust events
patterns are likely
[14]. Dust stormsto become
originatemore
fromfrequent
drylands,and intense
which with changing
constitute climate 40%
approximately and weather
of the
patterns
world’s[14].
surface Dustandstorms
account originate
for 30% offrom drylands,
the world which [14,42].
population constitute
Dustapproximately
impacts are not 40% of the
restricted
world’s surface
to local areas,and account
because for 30%
airborne of the
dust can world population
be transported [14,42]. Dust
thousands impacts
of miles awayarefromnotitsrestricted
origin
source.
to local The largest
areas, because source of atmospheric
airborne dust can be dust is the Sahara-Sahel
transported thousands region in North
of miles awayAfrica.
fromThe its dust
origin
originating
source. from this
The largest region
source reaches different
of atmospheric dustparts
is theofSahara-Sahel
the world, including
region inthe Americas
North Africa.across
The the
dust
Atlantic Ocean
originating from [43,44]. In thereaches
this region US, the greatest
differentnumber
parts ofofdust
the storms
world,occur in western
including states (Arizona,
the Americas across
theCalifornia, Washington
Atlantic Ocean [43,44].and Nevada),
In the US, the particularly during of
greatest number thedust
earlystorms
afternoon
occurhours of summer
in western states
months [45]. This study provides epidemiological evidence of the association
(Arizona, California, Washington and Nevada), particularly during the early afternoon hours between AECOPD andof
exposure to the transported dust originating on another continent.
summer months [45]. This study provides epidemiological evidence of the association between
AECOPD and exposure to the transported dust originating on another continent.
In this study we observed that an increase in ambient temperature was associated with an increased
risk of AECOPD, which is inconsistent with the literature. Generally, a low temperature (especially very
cold) that constricts airways is shown to increase the risks of AECOPD [46,47]. However, temperatures
in Miami remain high year-round. Thus, the effects of high temperature on AECOPD are likely to be
indirect, because elevated temperatures keep airborne particles afloat for longer, which can result in
elevated PM2.5 exposure. The current study suggests that both PM2.5 and ambient temperature were
associated with an increased risk of AECOPD.
Urban residents are chronically exposed to PM2.5 and PM10 from local sources, but their PM
exposure further increases during dust events [27]. PM10 concentrations can exceed 1000 µm/m3
during dust storms, and may surpass 15,000 µm/m3 during severe events [48,49]. These high levels
of PM10 during dust storms are associated with respiratory diseases [50]. Moreover, dust is also
associated with the risk of other diseases, including pulmonary infectious [51,52] and cardiovascularJ. Clin. Med. 2020, 9, 2496 13 of 17
diseases [53]. PM has been shown to directly contribute to all-cause and cause-specific mortality as
well [54]. For example, a study in Barcelona showed that a daily increase of 10 µg/m3 in PM10–2.5 from
Saharan dust was associated with an 8.4% increase in mortality [55].
The findings of this research have implications for the management of dust exposure and its
associated health risks. First, there is overwhelming evidence of the intensifying of dust outbreaks
worldwide, including in Asia, Africa and America, over the past 30 years. The highest dust intensity in
Miami was observed in 1983 after the intense El Niño events. Thus, a changing climate, that affects the
phasing of the North Atlantic Oscillation, could intensify dust storms in the future [38] and elevate
exposure to coarse particles (PM10–2.5 ). Second, dust exposure synergistically magnifies the effects of
local pollutants, due to its enhanced toxicity [26,56]. Transported dust is rich in minerals, such as iron,
which can enhance the growth and viability of microbial communities, and dust particles also serve
as a transport agent for microbial agents [57,58]. Third, dust storms impact large areas and have a
widespread effect. For example, Saharan dust affects most parts of southeastern US, including Florida
and Texas [59]. Fourth, transported dust may not only impact respiratory diseases, but other diseases
as well, including allergies and immunological disorders. Therefore, intensifying dust exposure is
likely to have a heavier effect on human health, which warrants proactive dust exposure management
strategies to mitigate these adverse health effects.
Multiple stakeholders need to be engaged in managing the health risks of dust exposure.
First, real-time surveillance of dust transport, and its associated region-, population- and disease-specific
and time-lagged health risks, is needed. As demonstrated in this paper, a hybrid approach that integrates
satellite-based AOD, in situ monitoring of the vertical profile of dust and particulate air pollution data
can be used to develop location- and time-specific estimates of transported dust. Second, age-, gender-
and disease-specific risk assessments are warranted as there is limited literature on the biological impact
of the imported dust. Third, healthcare professionals need to be trained concerning the health risks of
dust exposure and its persistence for days and weeks. They need to interrogate their patients regarding
their recent dust exposure, assess its potential health risks and provide them with information on dust
exposure avoidance. Finally, it is important to provide the general public with information regarding
the real-time health risks of dust exposure through multi-media platforms, such as weather news
and cellphone application(s) that provide information on the transported dust concentration and its
associated health risk.
Assessing the health risk of short-term pollution events merits researchers0 attention.
However, it has potential methodological challenges. Therefore, the findings of this research must
be interpreted considering the following weaknesses. First, the focus of this study on veterans with
COPD constraints the scope of its generalizability. Second, the data may be subject to recall biases,
given that patients were seen every 6 months. However, performing the study in our cohort minimized
this risk, as it is considered a “captive” population with most subjects receiving their healthcare at
one place, and they visit VA, which has systematic records of each clinical visit which we used for
verification. Third, the study controlled for a limited number of confounders due to limited data on
comorbidities and other risk behaviors. If we consider the dust event as a natural experiment, then the
patterns of comorbidities and other risk factors are unlikely to change before, during and after the dust
events. Fourth, there is the plausibility of exposure misclassification for some, because dust exposure
was considered as being the same for all subjects on a given day. There can be individual differences in
the time participants spend indoors and outdoors. However, their time-activity pattern is unlikely
to change dramatically before, during and after the dust events, unless they are aware of “outdoor
dust exposure” and take precautions to reduce their exposure. Fourth, the quantification of the LIDAR
data can be subject to bias. Nonetheless, the dust intensity readings obtained from LIDAR showed a
positive association with satellite-based assessments of AOD in Miami (>0.2 during the dust event).J. Clin. Med. 2020, 9, 2496 14 of 17
5. Conclusions
The literature on the health effects of dust exposure is scant, and further research is warranted
to build up the empirical evidence of the disease-specific effects of dust exposure and its persistence
over time. In particular, understanding the environmental risks of AECOPD exacerbation is important,
given its potential for improving clinical recommendations regarding individual behavior modification
during discrete dust and/or pollution events. There is a need to develop strategies to engage multiple
stakeholders, in order to manage the adverse health effects of dust exposure, ranging from developing
real-time disease-specific health risks to training healthcare professionals in assessing the health risk of
time-lagged dust exposure among their patients, so as to engage them in dust exposure avoidance.
Author Contributions: Conception and design: M.C., N.K.; Data acquisition: M.P.G., P.Z., M.C., N.K.;
Interpretation of data: M.P.G., P.Z., M.C., N.K.; Intellectual contribution to the manuscript: M.P.G., P.Z.,
M.C., M.M., N.K. All authors were involved in preparation of the original draft of the manuscript and revising it
critically for its contents. All authors have read and agreed to the published version of the manuscript.
Funding: This work in part was supported in parts by NIH (5R01EY026174-03). Initial support for south
Florida’s Cloud-Aerosol-Rain Observatory (CAROb) lidar was provided by NSF Major Research Instrumentation
Grant 0923217.
Acknowledgments: Authors acknowledge Joseph Prospero0 s constructive feedback on an earlier draft of this paper.
Conflicts of Interest: The authors declare no conflict of interest, and the funders had no role in the design of the
study, collection, analyses, or interpretation of data, the writing of the manuscript and the decision to publish
the results.
References
1. Dransfield, M.T.; Kunisaki, K.M.; Strand, M.J.; Anzueto, A.; Bhatt, S.P.; Bowler, R.P.; Criner, G.J.; Curtis, J.L.;
Hanania, N.A.; Nath, H.; et al. Acute exacerbations and lung function loss in smokers with and without
chronic obstructive pulmonary disease. Am. J. Respir. Crit. Care Med. 2017, 195, 324–330. [CrossRef]
2. Seemungal, T.A.; Donaldson, G.C.; Paul, E.A.; Bestall, J.C.; Jeffries, D.J.; Wedzicha, J.A. Effect of exacerbation
on quality of life in patients with chronic obstructive pulmonary disease. Am. J. Respir. Crit. Care Med. 1998,
157, 1418–1422. [CrossRef]
3. Soler-Cataluna, J.J.; Martinez-Garcia, M.A.; Roman Sanchez, P.; Salcedo, E.; Navarro, M.; Ochando, R. Severe
acute exacerbations and mortality in patients with chronic obstructive pulmonary disease. Thorax 2005, 60,
925–931. [CrossRef]
4. Wan, E.S. Examining genetic susceptibility in acute exacerbations of COPD. Thorax 2018, 73, 507–509.
[CrossRef]
5. Arbex, M.A.; de Souza Conceicao, G.M.; Cendon, S.P.; Arbex, F.F.; Lopes, A.C.; Moyses, E.P.; Santiago, S.L.;
Saldiva, P.H.; Pereira, L.A.; Braga, A.L. Urban air pollution and chronic obstructive pulmonary disease-related
emergency department visits. J. Epidemiol. Community Health 2009, 63, 777–783. [CrossRef]
6. Choi, J.; Oh, J.Y.; Lee, Y.S.; Min, K.H.; Hur, G.Y.; Lee, S.Y.; Kang, K.H.; Shim, J.J. Harmful impact of air
pollution on severe acute exacerbation of chronic obstructive pulmonary disease: Particulate matter is
hazardous. Int. J. Chron. Obstruct. Pulmon. Dis. 2018, 13, 1053–1059. [CrossRef]
7. Li, M.H.; Fan, L.C.; Mao, B.; Yang, J.W.; Choi, A.M.K.; Cao, W.J.; Xu, J.F. Short-term exposure to ambient fine
particulate matter increases hospitalizations and mortality in COPD: A systematic review and meta-analysis.
Chest 2016, 149, 447–458. [CrossRef]
8. Kumar, N.; Liang, D.; Comellas, A.; Chu, A.D.; Abrams, T. Satellite-based PM concentrations and their
application to COPD in Cleveland, OH. J. Expo. Sci. Environ. Epidemiol. 2013, 23, 637–646. [CrossRef]
9. Sapey, E.; Stockley, R.A. COPD exacerbations. 2: Aetiology. Thorax 2006, 61, 250–258. [CrossRef]
10. Ni, L.; Chuang, C.C.; Zuo, L. Fine particulate matter in acute exacerbation of COPD. Front. Physiol. 2015, 6,
294. [CrossRef]
11. Ling, S.H.; van Eeden, S.F. Particulate matter air pollution exposure: Role in the development and exacerbation
of chronic obstructive pulmonary disease. Int. J. Chron. Obstruct. Pulmon. Dis. 2009, 4, 233–243.
12. Kuhlbusch, T.A.; John, A.C.; Quass, U. Sources and source contributions to fine particles. Biomark. Biochem.
Indic. Expo. Response Susceptibility Chem. 2009, 14 (Suppl. 1), 23–28. [CrossRef]You can also read