Association of Exposure to Formula in the Hospital and Subsequent Infant Feeding Practices With Gut Microbiota and Risk of Overweight in the First ...
←
→
Page content transcription
If your browser does not render page correctly, please read the page content below
Research

                 JAMA Pediatrics | Original Investigation

                 Association of Exposure to Formula in the Hospital
                 and Subsequent Infant Feeding Practices With Gut Microbiota
                 and Risk of Overweight in the First Year of Life
                 Jessica D. Forbes, PhD; Meghan B. Azad, PhD; Lorena Vehling, MSc; Hein M. Tun, PhD; Theodore B. Konya, MPH; David S. Guttman, PhD;
                 Catherine J. Field, PhD; Diana Lefebvre, PhD; Malcolm R. Sears, MBChB; Allan B. Becker, MD; Piushkumar J. Mandhane, MD, PhD;
                 Stuart E. Turvey, MBBS, DPhil; Theo J. Moraes, MD, PhD; Padmaja Subbarao, MD, MSc; James A. Scott, PhD; Anita L. Kozyrskyj, PhD;
                 for the Canadian Healthy Infant Longitudinal Development (CHILD) Study Investigators

                                                                                                                                      Supplemental content
                    IMPORTANCE The effect of neonatal and infant feeding practices on childhood obesity is
                    unclear. The gut microbiome is strongly influenced by feeding practices and has been linked
                    to obesity.

                    OBJECTIVE To characterize the association between breastfeeding, microbiota, and risk of
                    overweight during infancy, accounting for the type and timing of supplementary feeding.

                    DESIGN, SETTING, AND PARTICIPANTS In this study of a subset of 1087 infants from the
                    prospective CHILD pregnancy cohort, mothers were recruited between January 1, 2009, and
                    December 31, 2012. Statistical analysis was performed from February 1 to December 20, 2017.

                    MAIN OUTCOMES AND MEASURES Feeding was reported by mothers and documented from
                    hospital records. Fecal microbiota at 3 to 4 months (from 996 infants) and/or 12 months
                    (from 821 infants) were characterized by 16S ribosomal RNA sequencing. Infants with a
                    weight for length exceeding the 85th percentile were considered to be at risk for overweight.

                    RESULTS There were 1087 infants in the study (507 girls and 580 boys); at 3 months, 579 of
                    1077 (53.8%) were exclusively breastfed according to maternal report. Infants who were
                    exclusively formula fed at 3 months had an increased risk of overweight in covariate-adjusted
                    models (53 of 159 [33.3%] vs 74 of 386 [19.2%]; adjusted odds ratio, 2.04; 95% CI, 1.25-3.32).
                    This association was attenuated (adjusted odds ratio, 1.33; 95% CI, 0.79-2.24) after further
                    adjustment for microbiota features characteristic of formula feeding at 3 to 4 months,
                    including higher overall richness and enrichment of Lachnospiraceae. A total of 179 of 579
                    infants who were exclusively breastfed (30.9%) received formula as neonates; this brief
                    supplementation was associated with lower relative abundance of Bifidobacteriaceae and
                    higher relative abundance of Enterobacteriaceae at 3 to 4 months but did not influence the
                    risk of overweight. At 12 months, microbiota profiles differed significantly according to
                    feeding practices at 6 months; among partially breastfed infants, formula supplementation
                    was associated with a profile similar to that of nonbreastfed infants (higher diversity and
                    enrichment of Bacteroidaceae), whereas the introduction of complementary foods without
                                                                                                                                 Author Affiliations: Author
                    formula was associated with a profile more similar to that of exclusively breastfed infants
                                                                                                                                 affiliations are listed at the end of this
                    (lower diversity and enrichment of Bifidobacteriaceae and Veillonellaceae). Microbiota                       article.
                    profiles at 3 months were more strongly associated with risk of overweight than were                         Group Information: The Canadian
                    microbiota profiles at 12 months.                                                                            Healthy Infant Longitudinal
                                                                                                                                 Development (CHILD) Study
                                                                                                                                 investigators are listed at the end of
                    CONCLUSIONS AND RELEVANCE Breastfeeding may be protective against overweight, and gut
                                                                                                                                 this article.
                    microbiota may contribute to this effect. Formula feeding appears to stimulate changes in
                                                                                                                                 Corresponding Author: Meghan B.
                    microbiota that are associated with overweight, whereas other complementary foods do not.                    Azad, PhD, Developmental Origins of
                    Subtle microbiota differences emerge after brief exposure to formula in the hospital. These                  Chronic Diseases in Children Network
                    results identify important areas for future research and distinguish early infancy as a critical             (DEVOTION), Department of
                                                                                                                                 Pediatrics and Child Health,
                    period when transient gut dysbiosis may lead to increased risk of overweight.
                                                                                                                                 Children’s Hospital Research Institute
                                                                                                                                 of Manitoba, University of Manitoba,
                                                                                                                                 501G-715 McDermot Ave,
                    JAMA Pediatr. 2018;172(7):e181161. doi:10.1001/jamapediatrics.2018.1161                                      Winnipeg, MB R3E 3P4, Canada
                    Published online June 4, 2018. Corrected on July 2, 2018.                                                    (meghan.azad@umanitoba.ca).

                                                                                                                                                                 (Reprinted) 1/11
                                                          © 2018 American Medical Association. All rights reserved.

Downloaded From: by a University of Manitoba User on 07/03/2018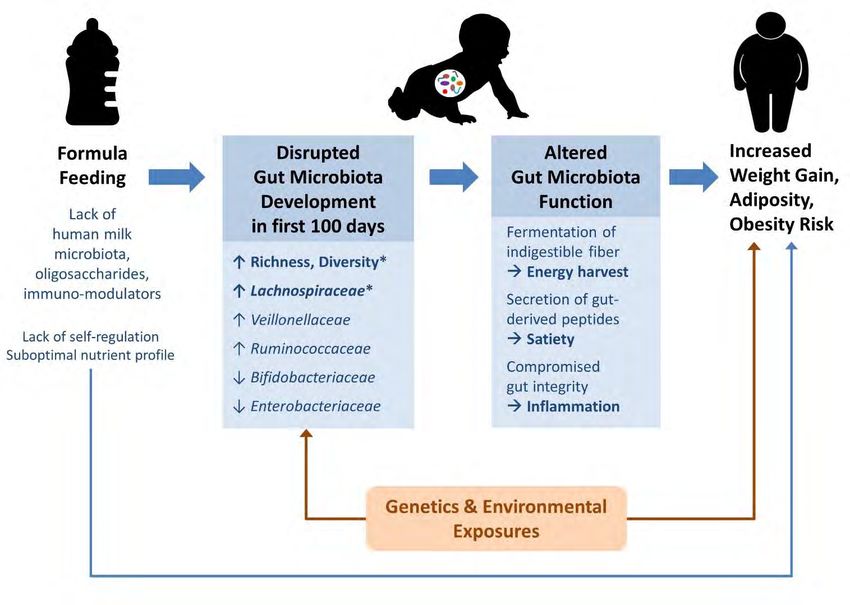
Research Original Investigation                                           Association of Breastfeeding With Gut Microbiota and Risk of Overweight

               O
                         besity originates early in life, 1 and breastfeeding
                         appears to be protective against obesity.2 Hypoth-            Key Points
                         esized mechanisms for this protection include the
                                                                                       Question How do infant feeding practices influence gut
               promotion of self-regulation in breastfed infants and the lower         microbiota and risk of overweight?
               protein content of breast milk compared with infant formula.3
                                                                                       Findings Among 1087 infants from the Canadian Healthy Infant
               Another potential mechanism involves modification of the
                                                                                       Longitudinal Development (CHILD) cohort, earlier cessation of
               developing gut microbiota, which contributes to nutrient ac-
                                                                                       breastfeeding and supplementation with formula (more so than
               quisition, energy regulation, and fat storage.4 Microbiota shifts       complementaryfoods)wereassociatedwithadose-dependentincrease
               have been associated, albeit inconsistently,5 with obesity in           in risk of overweight by age 12 months; this association was partially
               adults, including lower diversity, enrichment of Ruminococcus           explained by specific gut microbiota features at 3 to 4 months. Subtle
               gnavus,6 and a higher ratio of Firmicutes to Bacteroidetes.7            but significant microbiota differences were observed after brief
               Microbiota transplant experiments in mice suggest that these            exposure to formula limited to the birth hospital stay, but these
                                                                                       differences were not associated with overweight.
               associations are causal,8 and studies of children9-12 suggest that
               they originate early in life, although few studies have been con-       Meaning Breastfeeding may contribute to protection against
               ducted for infants. Breastfeeding is among the most influen-            overweight by modifying the gut microbiota, particularly during
               tial factors shaping the infant gut microbiome because breast           early infancy.
               milk contains prebiotic oligosaccharides and probiotic micro-
               organisms, including bifidobacteria.13                               according to World Health Organization standards.15 A WFLz
                    Despite this evidence, we do not fully understand how           score greater than the 97th percentile was considered over-
               infant feeding practices affect the developing microbiota and        weight, and a WFLz score greater than the 85th percentile was
               influence weight gain. Studies often do not differentiate be-        considered at risk for overweight16; these 2 groups were com-
               tween partially breastfed infants receiving formula vs those re-     bined into a composite outcome for logistic regression analyses.
               ceiving complementary foods, yet these forms of nutrition
               clearly provide very different substrates for microbiota. The        Infant Feeding
               definition of exclusive breastfeeding also varies, and few stud-     Mothers completed questionnaires at 3, 6, and 12 months post
               ies have accessed hospital records to confirm exclusivity in the     partum, reporting on breastfeeding and the introduction of
               neonatal period. To address these knowledge gaps, we char-           formula and complementary foods. At 3 months, breastfeeding
               acterized these specific infant feeding practices in the Cana-       status was classified as exclusive (breast milk only), partial (breast
               dian Healthy Infant Longitudinal Development (CHILD) birth           milk and formula), or none (formula only). Using hospital data,
               cohort and examined their association with gut microbiota and        we further classified infants as exclusively breastfed after hos-
               risk of overweight in the first year of life.                        pital discharge if they briefly received formula in the hospital but
                                                                                    were exclusively breastfed after hospital discharge. At 6 months,
                                                                                    feeding was defined as exclusively breastfed (breast milk only),
                                                                                    partially breastfed with formula (breast milk and formula, with
               Methods
                                                                                    or without complementary foods), partially breastfed without
               Study Design                                                         formula (breast milk and complementary foods), or not breast-
               We accessed data from the CHILD birth cohort (http:                  fed (formula with or without complementary foods). The dura-
               //childstudy.ca) of 3495 families across 4 sites in Canada.14        tion of breastfeeding was determined from the earliest report of
               Women were recruited between January 1, 2009, and                    cessation of breastfeeding. For microbiota analyses, breastfeed-
               December 31, 2012, and remained eligible if they delivered a         ing status was determined on the date of collection of the fecal
               healthy, full-term infant. This study included 1087 infants          sample. In this study, breastfeeding refers to feeding the infant
               enrolled in the general cohort at the Manitoba, Edmonton, and        breast milk, whether at the breast or from a bottle.
               Vancouver sites. This subset is a representative selection of
               infants with fecal samples analyzed at 3 to 4 months (from 996       Covariates
               infants) and/or 12 months (from 821 infants), of which 730           Mode of birth, parity, gestational diabetes, infant sex, birth
               infants had samples analyzed at both times (eFigure 1 in the         weight, and hospital-administered antibiotics to the mother or
               Supplement). The rates of breastfeeding, overweight, and other       neonate were documented from hospital records.17 Oral anti-
               demographics in this subset were similar to those of the general     biotic use was reported by parents. As described previously,18
               cohort (eTable 1 in the Supplement). The Human Research              the quality of the maternal diet was estimated using the Healthy
               Ethics Boards at McMaster University, University of Manitoba,        Eating Index,19 and the maternal prepregnancy body mass in-
               University of Alberta, University of Toronto, and University of      dex was self-reported and validated against medical records.
               British Columbia approved this study. Parents provided written       Data on maternal race/ethnicity, smoking status, educational
               consent at the time of enrollment.                                   level, and pet ownership were self-reported during pregnancy.

               Overweight                                                           Fecal Microbiota Analysis
               At 12 months of age (mean [SD] age, 12.4 [1.3] months), infants      Fecal samples were collected at a home visit (3-4 months; mean
               were weighed and measured by CHILD Study staff. Age- and             [SD], 3.7 [1.0] months) and a clinic visit (12 months; mean [SD],
               sex-specific weight for length z (WFLz) scores were calculated       12.3 [1.2] months); DNA was extracted using the QIAamp DNA

        2/11   JAMA Pediatrics July 2018 Volume 172, Number 7 (Reprinted)                                                                    jamapediatrics.com

                                                      © 2018 American Medical Association. All rights reserved.

Downloaded From: by a University of Manitoba User on 07/03/2018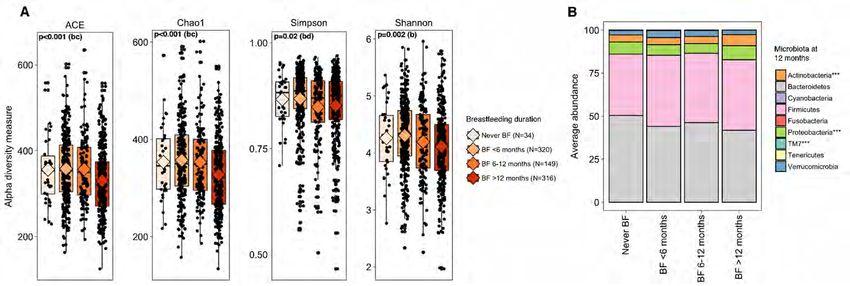
Association of Breastfeeding With Gut Microbiota and Risk of Overweight                                                    Original Investigation Research

                 Table 1. Crude and Adjusted Association of Infant Feeding Practices With Infant Weight Status at 12 Months
                                                                                                         Adjusted OR (95% CI)
                                                                 Prevalence          Crude OR            With Multiple Imputation
                                                                 of Overweight,      (95% CI)            of Missing Data
                  Breastfeeding Exposure                         No. (%)             (n = 1020)          (N = 1087)a
                  Breastfeeding at 3 mo
                    None (formula only)                          53/159 (33.3)       2.11 (1.39-3.19)    2.02 (1.18-3.45)
                    Partial (breast milk and formula)            84/304 (27.6)       1.61 (1.13-2.30)    1.63 (1.09-2.44)
                    Exclusive after hospital discharge           35/171 (20.5)       1.09 (0.68-1.69)    1.13 (0.68-1.89)
                    Exclusive (breast milk only)                 74/386 (19.2)       1 [Reference]       1 [Reference]
                  Breastfeeding at 6 mo                                              (n = 1001)
                    None (formula with or without food)          77/249 (30.9)       2.11 (1.33-3.42)    1.59 (0.92-2.74)            Abbreviation: OR, odds ratio.
                                                                                                                                     a
                    Partial with formula (breast and formula     81/296 (27.4)       1.77 (1.13-2.85)    1.43 (0.87-2.37)                Adjusted for maternal body mass
                    with or without food)                                                                                                index, smoking, postsecondary
                    Partial without formula                      55/279 (19.7)       1.16 (0.71-1.90)    0.96 (0.57-1.64)                education, race/ethnicity, cesarean
                    (breast milk and food)                                                                                               delivery, dog in household, infant
                                                                                                                                         sex, any oral antibiotics between
                    Exclusive (breast milk only)                 31/177 (17.5)       1 [Reference]       1 [Reference]
                                                                                                                                         0 and 12 mo, and study site.
                  Breastfeeding duration                                             (n = 978)                                       b
                                                                                                                                         Excludes infants who were never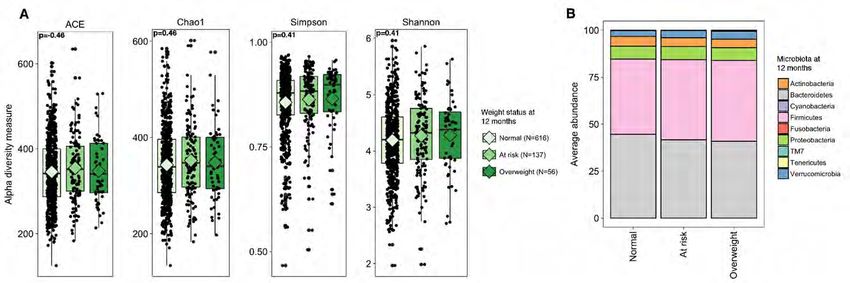
Research Original Investigation                                              Association of Breastfeeding With Gut Microbiota and Risk of Overweight

               were exclusively breastfed at 3 months, 19.2% (74 of 386) were         and decreasing relative abundance of Lachnospiraceae,
               overweight or at risk of overweight by 12 months compared with         Veillonellaceae, and Ruminococcaceae. Although most taxa were
               27.6% of infants (84 of 304) who were partially breastfed (OR,         similarly abundant between infants who were exclusively
               1.61; 95% CI, 1.13-2.30) and 33.3% of infants (53 of 159) who were     breastfed from birth and those exclusively breastfed after hos-
               not breastfed (ie, exclusively formula fed) (OR, 2.11; 95% CI, 1.39-   pital discharge, the relative abundance of Bifidobacteriaceae
               3.19). There was no increase in risk of overweight among ex-           was significantly lower after brief exposure to formula in the
               clusively breastfed infants who briefly received formula in the        hospital (median, 4.3% vs 8.3% of total microbiota; FDR
               hospital (35 of 171 [20.5%] at risk; OR, 1.09; 95% CI, 0.68-1.69).     P = .03) and the relative abundance of Enterobacteriaceae
               These associations were largely unaffected by adjustment for           was higher (29.8% vs 24.5% of total microbiota; FDR P = .05)
               maternal body mass index, education, smoking, and other po-            (Figure 1C and eTable 5 in the Supplement).
               tential confounders (eTable 3 in the Supplement) (partial breast-           Twelve-month microbiota profiles were more homoge-
               feeding: aOR, 1.63; 95% CI, 1.09-2.44; exclusive formula feed-         neous overall, but signific ant differences were still
               ing: aOR, 2.02; 95% CI, 1.18-3.45; exclusive breastfeeding after       detectable according to dietary exposures at 6 months
               hospital discharge: aOR, 1.13; 95% CI, 0.68-1.89) (Table 1).           (Figure 2A-D, eFigure 2C and 2D, and eTables 6 and 7 in the
                    At 6 months, partial breastfeeding supplemented with for-         Supplement). Richness was significantly higher among
               mula was associated with an increased risk of overweight when          formula-fed infants (whether or not they were also receiv-
               adjusting individually for maternal body mass index (aOR, 1.60;        ing breast milk) compared with breastfed infants (whether
               95% CI, 1.01-2.59), other maternal factors (aOR, 1.65; 95% CI,         o r n o t t h e y we re re c e iv i ng c o m p l e m e nt a r y fo o d s)
               1.03-2.68), or microbiota-related factors (aOR, 1.64; 95% CI,          (Figure 2A). The relative abundances of Actinobacteria and
               1.02-2.70), although statistical significance was lost in the fully    Proteobacteria were highest in exclusively breastfed infants
               adjusted model (aOR, 1.43; 95% CI, 0.87-2.37) (Table 1). In con-       and lowest in nonbreastfed infants (Figure 2B). Several dif-
               trast, partial breastfeeding without formula (ie, with foods only)     ferences were observed between the partial breastfeeding
               was not associated with risk of overweight (aOR, 0.96; 95% CI,         groups, including significantly higher relative abundance of
               0.57-1.64). Earlier cessation of breastfeeding was associated          Bifidobacteriaceae and Veillonellaceae in those receiving
               with an increased risk of overweight (before 6 months: aOR,            complementary foods without formula (Figure 2C). Overall,
               1.64; 95% CI, 1.06-2.52; between 6 and 12 months: aOR, 1.47;           the microbiota of partially breastfed infants who did not
               95% CI, 0.99-2.18 compared with 12 months or longer). Sen-             receive formula were similar to the microbiota of exclu-
               sitivity analyses using the WFLz score as a continuous out-            sively breastfed infants (no significant differences by
               come, adjusting for infant birth weight or excluding infants who       12 months; P = .78, pseudo F = 0.40, determined by use
               never received breast milk, followed similar patterns of asso-         of pairwise PERMANOVA), whereas the microbiota of those
               ciation (eTable 4 in the Supplement).                                  who received formula were more similar to the microbiota
                                                                                      of nonbreastfed infants (Figure 2D and eTable 6 in
               Infant Feeding and Gut Microbiota                                      the Supplement).
               As expected, breastfeeding was strongly associated with the                 The duration of breastfeeding was also associated with
               richness, diversity, and composition of gut microbiota at 3 to 4       gut microbiota at 12 months (eFigure 3 and eTable 8 in the
               months, with clear dose responses according to exclusivity             Supplement). Richness and diversity were lowest among infants
               (Figure 1 and eTables 5 and 6 in the Supplement). The richness         who were still breastfeeding at 12 months and highest among
               and diversity of microbiota were highest in infants who were           those who had weaned before 6 months. Bifidobacteriaceae,
               not breastfed, lower in partially breastfed infants, and lowest        Veillonellaceae, and Proteobacteria were enriched among infants
               in exclusively breastfed infants (Figure 1A). The community            who were still breastfeeding and depleted among infants
               structure of microbiota also differed significantly (overall           who had never been breastfed. In contrast, Lachnospiraceae,
               P = .001, pseudo F, 10.9 [unweighted UniFrac]; P = .001,               Ruminococcaceae, and Porphyromonadaceae were enriched
               pseudo F, 12.4 [weighted UniFrac], determined by use of                among infants who were not breastfeeding at 12 months.
               PERMANOVA; eTable 6 in the Supplement), with principal
               coordinate analysis (Figure 1D and eFigure 2A and B in the             Gut Microbiota and Overweight
               Supplement) showing clear separation between the exclu-                Infants who were overweight or at risk of overweight at 12
               sively breastfed and nonbreastfed groups. The group that briefly       months had significantly higher richness of microbiota by 3
               received formula in the hospital overlapped almost com-                to 4 months of age (Figure 3A); significant differences in
               pletely with the exclusively breastfed group (P = .24, pseudo F,       composition were also detected (Figure 3B and C and eTable
               0.24, determined by use of pairwise PERMANOVA) (Figure 1D              9 in the Supplement). The strongest association was the
               and eTable 6 in the Supplement), indicating similar micro-             enrichment of Lachnospiraceae among infants who subse-
               biota community structures.                                            quently became overweight (median relative abundance,
                   Nearly all phyla and families demonstrated dispropor-              5.9% of total microbiota) or at risk for overweight (median
               tional abundances across breastfeeding groups, and signifi-            relative abundance, 4.7% of total microbiota) by 12 months
               cant dose responses were observed with particular taxa                 compared with normal-weight infants (median relative
               (Figure 1B and C and eTable 5 in the Supplement). Increasing           abundance, 1.9% of total microbiota; FDR P = .01). We
               exclusivity of breastfeeding was associated with increasing rela-      also observed significantly higher relative abundance of
               tive abundance of Bifidobacteriaceae and Enterobacteriaceae            Coriobacteriaceae, Erysipelotrichaceae, and Ruminococcaceae

        4/11   JAMA Pediatrics July 2018 Volume 172, Number 7 (Reprinted)                                                                      jamapediatrics.com

                                                      © 2018 American Medical Association. All rights reserved.

Downloaded From: by a University of Manitoba User on 07/03/2018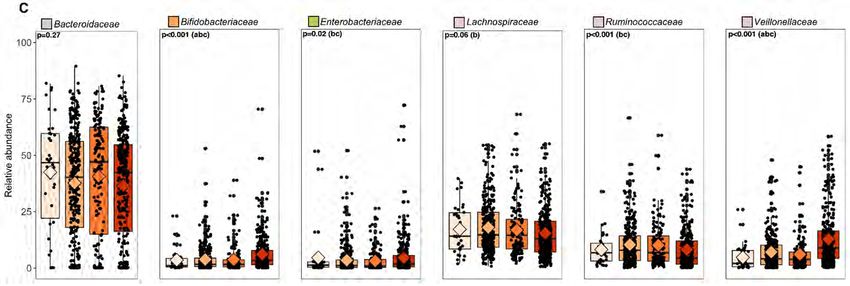
Association of Breastfeeding With Gut Microbiota and Risk of Overweight                                                                                                                                                                                                                       Original Investigation Research

                 Figure 1. Infant Gut Microbiota at 3 to 4 Months According to Breastfeeding (BF) Status

                   A Alpha diversity                                                                                                                                                                                                                                         B             Phylum-level composition
                                                       ACE                                                                  Chao1                                                Simpson                                                              Shannon
                                                  P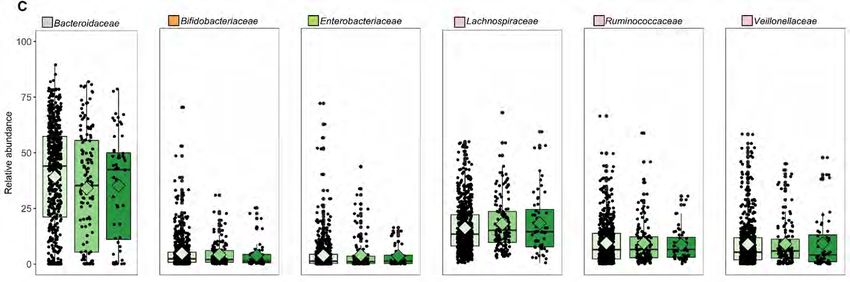
Research Original Investigation                                                                                                                                                                                                   Association of Breastfeeding With Gut Microbiota and Risk of Overweight

               Figure 2. Infant Gut Microbiota at 12 Months According to Diet at 6 Months

                A Alpha diversity                                                                                                                                                                                                                                      B             Phylum-level composition
                                                    ACE                                                                 Chao1                                                Simpson                                                              Shannon
                                               P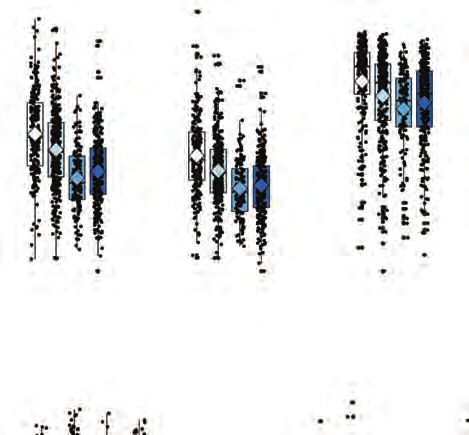
Association of Breastfeeding With Gut Microbiota and Risk of Overweight Original Investigation Research
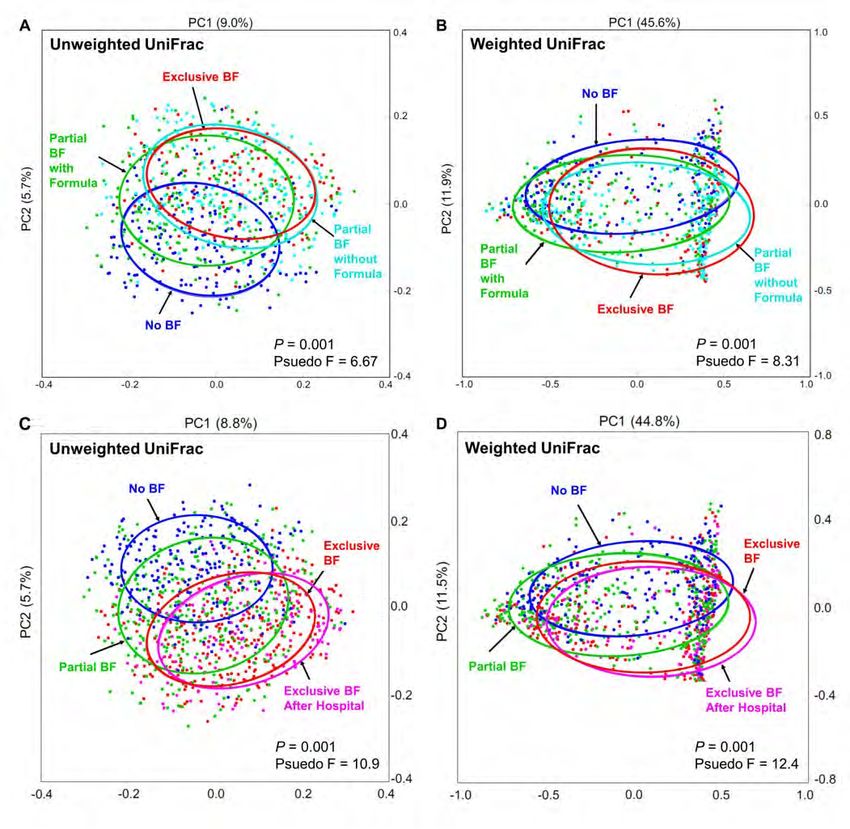
Figure 3. Infant Gut Microbiota Characterization at 3 Months According to Infant Weight Status at 12 Months
A Alpha diversity B Phylum-level composition
ACE Chao1 Simpson Shannon
P =.03a P =.03a,b
, P =.11 P =.06 100
400 1.00 5
300
Mean Abundance
4 75
Alpha Diversity Measure
Alpha Diversity Measure
Alpha Diversity Measure
Alpha Diversity Measure
300 0.75
3 50
200
200 0.50
2
25
100 100 0.25
1
0
Normal At Risk Overweight
C Relative abundance of dominant taxa
Microbiota at 3-4 mo
Bacteroidaceae Bifidobacteriaceae Enterobacteriaceae Actinobacteria Proteobacteria
100 100 100 Bacteroidetes TM7
Firmicutes Tenericutes
Fusobacteria Verrucomicrobia
75 75 75
Relative Abundance
Relative Abundance
Relative Abundance
Weight status at 12 mo
50 50 50 Normal (n = 699)
At risk (n = 171)
Overweight (n = 67)
25 25 25
0 0 0
Lachnospiraceae Ruminococcaceae Veillonellaceae
100 100 100
a,b b
75 75 75
Relative Abundance
Relative Abundance
Relative Abundance
50 50 50
25 25 25
0 0 0
A, Alpha diversity evaluated by richness (abundance-based coverage estimator weight status groups. Breastfeeding refers to breast milk feeding regardless of
[ACE] and Chao1) and diversity (Simpson and Shannon). Median estimates are feeding mode (at the breast or from a bottle).
compared across weight status using the Kruskal-Wallis test and Dunn post hoc Significant pairwise comparisons:
tests for multiple comparisons. Boxes indicate interquartile range, lines indicate a
Normal/overweight;
medians, diamonds indicate means, and whiskers represent range. B, Mean
b
phylum-level composition. C, Relative abundance of dominant taxa across Normal/at risk.
at 3 to 4 months among infants who became overweight. biota were observed according to weight status (eFigure 4
The Firmicutes to Bacteroidetes ratio was highest in infants and eTable 9 in the Supplement).
who became overweight at 1 year, although this difference To further explore the association of weight status at 12
was not significant. By 12 months, few differences in micro- months with the composition and diversity of gut micro-
jamapediatrics.com (Reprinted) JAMA Pediatrics July 2018 Volume 172, Number 7 7/11
© 2018 American Medical Association. All rights reserved.
Downloaded From: by a University of Manitoba User on 07/03/2018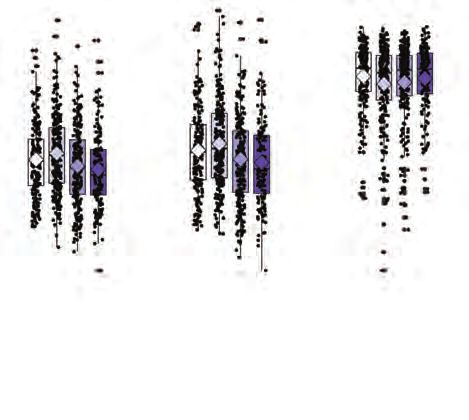
Research Original Investigation                                                                Association of Breastfeeding With Gut Microbiota and Risk of Overweight

               Table 2. Association of Infant Feeding and Key Microbiota Measures at 3 and 12 Months With Weight Status at 12 Months

                                                             OR (95% CI) for Overweight or at Risk of Overweight (WFLz score >85th Percentile) at 12 mo
                                                                                 Mutually Adjusted
                                                             Adjusted for                                                                                           For Covariates,
                                                             Covariates Plus                                                                                        Feeding, and
                                                             Feeding or          For Covariates,     For Covariates,       For Covariates,      For Covariates,     Selected
                   Breastfeeding and                         Microbiota          Feeding, and        Feeding, and          Feeding, and         Feeding,            Microbiota
                   Microbiota Exposure                       (Individually)a     Chao1               Shannon               Lachnospiraceae      and F/B Ratio       Measuresb
                   Breastfeeding status at 3 mo (n = 795)
                     None (formula only)                     1.79 (1.09-2.93)    1.56 (0.93-2.59)    1.63 (0.98-2.70)      1.47 (0.87-2.45)     1.77 (1.07-2.91)    1.33 (0.79-2.24)
                     Partial (breast milk and formula)       1.49 (0.98-2.26)    1.37 (0.90-2.09)    1.41 (0.93-2.16)      1.37 (0.90-2.09)     1.52 (1.00-2.32)    1.28 (0.83-2.97)
                     Exclusive after hospital discharge      1.00 (0.58-1.69)    1.02 (0.59-1.73)    1.02 (0.59-1.73)      1.00 (0.58-1.69)     0.93 (0.53-1.58)    1.02 (0.59-1.73)
                     Exclusive (breast milk only)            1 [Reference]       1 [Reference]       1 [Reference]         1 [Reference]        1 [Reference]       1 [Reference]
                   Microbiota measures at 3 mo (n = 795)
                     Chao1 (per quartile increase)           1.25 (1.08-1.46)    1.20 (0.59-1.73)    NA                    NA                   NA                  1.16 (0.99-1.37)
                     Shannon (per quartile increase)         1.18 (1.02-1.38)    NA                  1.13 (0.97-1.32)      NA                   NA                  NA
                     High Lachnospiraceae                    1.82 (1.29-2.57)    NA                  NA                    1.66 (1.16-2.39)     NA                  1.58 (1.10-2.28)
                     (above median)c
                     F/B ratio (per quartile increase)       1.17 (1.00-1.38)    NA                  NA                    NA                   1.20 (1.02-1.42)    NA
                   Breastfeeding duration at 12 mo
                   (n = 695)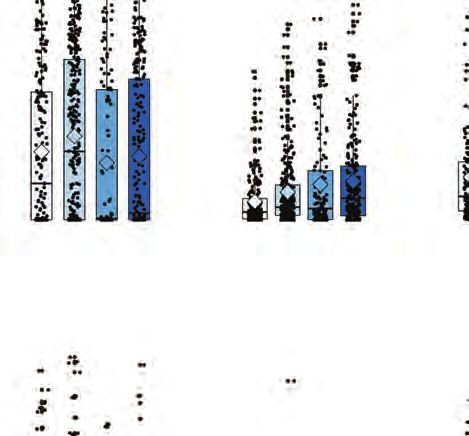
Association of Breastfeeding With Gut Microbiota and Risk of Overweight                                          Original Investigation Research

                 findings address important nuances that, to our knowledge,                tions since many neonates receive formula in the hospital, of-
                 have not been explored in previous studies, identifying                   ten without medical indication,48 yet the effect of this brief
                 differences according to the type and timing of supplemental              intervention on the developing microbiota (and related clini-
                 feeding. We also report novel longitudinal associations be-               cal outcomes) is not known. In our cohort, 179 of 579 infants
                 tween the composition of gut microbiota at 3 to 4 months of               (30.9%) reported by their mothers as exclusively breastfed ac-
                 age and weight status at 12 months of age.                                tually received some formula in the hospital. Overall, we found
                      Similar to previous studies,28,29 we found a 63% increased           no difference in the risk of overweight among these infants.
                 risk of overweight among infants who were partially vs exclu-             However, while their microbiota profiles at 3 to 4 months were
                 sively breastfed at 3 months and a 102% increased risk among              clearly more similar to those of exclusively breastfed than par-
                 exclusively formula-fed infants. As others have reported,25,27,30         tially or nonbreastfed infants, some significant differences were
                 we detected significantly lower bacterial richness and diversity          detected. The richness and diversity of the microbiota were
                 in breastfed infants, accompanied by enrichment of several taxa           lower, as was the relative abundance of Bifidobacteriaceae, sug-
                 (eg, Bifidobacteriaceae, Pasteurellaceae, and Enterobacteriaceae)         gesting that even brief exposure to formula may disrupt nor-
                 and depletion of others (eg, Bacteroidaceae and Lachnospiraceae),         mal colonization of the infant gut. We have likely underesti-
                 with dose effects according to the degree of breastfeeding exclu-         mated this disruption, since our first sample was not collected
                 sivity. These findings are consistent with evidence that human            until 3 to 4 months after hospital discharge. It is possible that
                 milk oligosaccharides function as selective substrates for particu-       the reason for formula supplementation contributed to the ob-
                 lar groups of microorganisms, including Bifidobacteriaceae.31-34          served microbiota differences, but this possibility could not
                      Building on previous studies of adults,35,36 children,9-12 and       be directly examined in our study because we did not system-
                 infants,37-42 our study provides new evidence linking gut mi-             atically document reasons for supplementation.
                 crobiota with the risk of overweight in the first year of life. Prior          Multiple studies have investigated the effects of breast milk
                 research of infants has reported reduced relative abundance of            on the gut microbiome24-26,34,49,50; however, many of these
                 Bifidobacteria and enrichment of streptococci and Bacteroides             studies did not distinguish between partial breastfeeding mixed
                 fragilis to be associated with overweight later in childhood.37-42        with formula vs mixed with foods. We found that breastfed in-
                 Although we did not observe these particular trends, perhaps              fants supplemented with formula were more similar to non-
                 owing to cohort differences in age, geography, or feeding prac-           breastfed infants, whereas breastfed infants given complemen-
                 tices (eg, extremely high rates of initiation of breastfeeding            tary foods (without formula) were more similar to exclusively
                 in the CHILD Study), we identified several novel associations.            breastfed infants. These differences might explain why mixed
                 Although few associations were detected between microbiota                feeding with (but not without) formula was associated with an
                 and overweight measured concurrently at 12 months, several                increased risk of overweight, although more research is needed
                 microbiota features associated with overweight were identi-               to characterize these complex associations.
                 fied at 3 to 4 months. For example, while Lachnospiraceae were
                 similarly abundant in normal-weight and overweight infants at             Strengths and Limitations
                 12 months, they were significantly enriched among over-                   The strengths of our study include the detailed description of
                 weight infants at 3 to 4 months. Lachnospiraceae has been as-             infant feeding practices, repeated analysis of microbiota, and
                 sociated with maternal obesity and is enriched in meconium                adjustment for multiple confounders. However, we lacked infor-
                 from neonates born to mothers with diabetes.43 In our study,              mation about the reasons for supplementation and did not ad-
                 enrichment of Lachnospiraceae was associated with exposure                dress the mode of breast milk feeding, type of formula, quantity
                 to formula in a dose-dependent manner, along with the rich-               of breast milk or formula intake, or breast milk composition.
                 ness and diversity of microbiota; adjustment for these micro-             Finally, a limitation of 16S ribosomal RNA analysis is that it can-
                 biota features partially explained the association between                not quantify or accurately resolve individual bacterial species.
                 exposure to formula and the risk of overweight.
                      Taken together, our results suggest that the transient per-
                 turbation of microbiota in early infancy (related to feeding prac-
                 tices or other exposures) may influence weight gain and body
                                                                                           Conclusions
                 composition, which may ultimately influence the risk of meta-             Our findings indicate that breastfeeding is protective against
                 bolic disease risk later in life.44 This hypothesis (eFigure 6 in         overweight and suggest that the gut microbiota contribute to
                 the Supplement) is consistent with studies of mice showing                this effect. Formula feeding was associated with higher mi-
                 that the disruption of gut microbiota limited to early life has           crobiota diversity and enrichment of Lachnospiraceae at 3 to
                 permanent metabolic effects, including elevated adiposity,                4 months, and these microbiota features partially explained
                 despite “recovery” of the microbiota. 45 Other important                  the increased risk of overweight among nonbreastfed in-
                 mechanisms linking gut microbiota and obesity include mi-                 fants. Subtle but statistically significant differences in the mi-
                 crobial metabolites influencing levels of and sensitivity to the          crobiota were observed after brief exposure to formula in the
                 satiety hormone leptin.46,47                                              hospital, although the clinical implications of these changes
                      To our knowledge, this is the first study to evaluate the po-        are unclear. Together, these results identify important areas
                 tential association of brief exposure to formula during the neo-          for future research and emphasize the importance of early in-
                 natal period as it pertains to the development of microbiota              fancy as a critical period during which transient gut dysbiosis
                 and the risk of overweight. These are clinically important ques-          is associated with the subsequent risk of overweight.

                 jamapediatrics.com                                                                 (Reprinted) JAMA Pediatrics July 2018 Volume 172, Number 7      9/11

                                                          © 2018 American Medical Association. All rights reserved.

Downloaded From: by a University of Manitoba User on 07/03/2018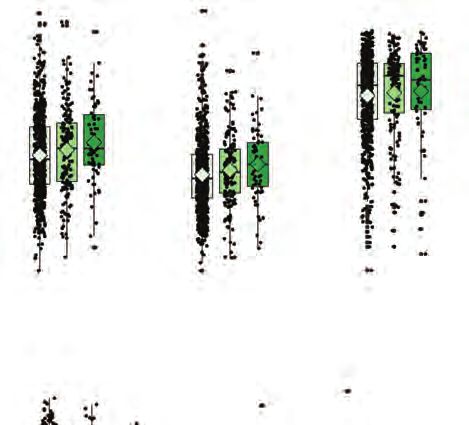
Research Original Investigation                                                               Association of Breastfeeding With Gut Microbiota and Risk of Overweight

                ARTICLE INFORMATION                                        Children’s Hospital Foundation of Manitoba.            British Columbia, Vancouver, British Columbia,
                Accepted for Publication: April 5, 2018.                   Additional funding was provided by Health Canada,      Canada; James A. Scott, PhD, University of Toronto,
                                                                           Environment Canada, Canada Mortgage and                Toronto, Ontario, Canada; Jeremy Scott, PhD,
                Published Online: June 4, 2018.                            Housing Corporation, the Sick Children’s Hospital      University of Toronto, Toronto, Ontario, Canada;
                doi:10.1001/jamapediatrics.2018.1161                       Foundation, Don & Debbie Morrison, the Silver          Frances Silverman, PhD, University of Toronto,
                Correction: This article was corrected on July 2,          Thread Foundation, the Childhood Asthma                Toronto, Ontario, Canada; Elinor Simons, MD, PhD,
                2018, to fix an error in a color key in all 3 figures.     Foundation, Research Manitoba, and the                 University of Manitoba, Winnipeg, Manitoba,
                Author Affiliations: Department of Pediatrics,             Government of Manitoba (Healthy Child Manitoba         Canada; Tim Takaro, MD, Simon Fraser University,
                University of Alberta, Edmonton, Alberta, Canada           Office).                                               Burnaby, British Columbia, Canada; Scott J.
                (Forbes, Tun, Mandhane, Kozyrskyj);                        Role of the Funder/Sponsor: The funding sources        Tebbutt, PhD, University of British Columbia,
                Developmental Origins of Chronic Diseases in               had no role in the design and conduct of the study;    Vancouver, British Columbia, Canada; and Theresa
                Children Network (DEVOTION), Department of                 collection, management, analysis, and                  To, PhD, The Hospital for Sick Children, Toronto,
                Pediatrics and Child Health, Children’s Hospital           interpretation of the data; preparation, review, or    Ontario, Canada.
                Research Institute of Manitoba, University of              approval of the manuscript; and decision to submit     Additional Contributions: We thank all the families
                Manitoba, Winnipeg, Manitoba, Canada (Forbes,              the manuscript for publication.                        who took part in this study and the entire CHILD
                Azad, Vehling, Becker); National Microbiology              Group Information: The CHILD Study investigators       team, which includes interviewers, nurses,
                Laboratory, Public Health Agency of Canada,                include Padmaja Subbarao, MD, MSc (director), The      computer and laboratory technicians, clerical
                Winnipeg, Manitoba, Canada (Forbes); Dalla Lana            Hospital for Sick Children, Toronto, Ontario,          workers, research scientists, volunteers, managers,
                School of Public Health, University of Toronto,            Canada; Stuart E. Turvey, MBBS, DPhil (co-director),   and receptionists. We also acknowledge the
                Toronto, Ontario, Canada (Konya, Scott);                   University of British Columbia, Vancouver, British     generosity of ALK-Abello, Mississauga, Ontario,
                Department of Cell and Systems Biology, University         Columbia, Canada; Malcolm R. Sears, MBChB              Canada, in supplying all allergens for the study, and
                of Toronto, Toronto, Ontario, Canada (Guttman);            (founding director), McMaster University, Hamilton,    Lincoln Diagnostics Inc, Decatur, Illinois, for
                Department of Agriculture, Food and Nutritional            Ontario, Canada; Sonia S. Anand, MD, PhD,              supplying the Duotip-Test II devices and skin
                Sciences, University of Alberta, Edmonton, Alberta,        McMaster University, Hamilton, Ontario, Canada;        testing kits.
                Canada (Field); Department of Medicine, McMaster           Meghan B. Azad, PhD, University of Manitoba,
                University, Hamilton, Ontario, Canada (Lefebvre,           Winnipeg, Manitoba, Canada; Allan B. Becker, MD,       REFERENCES
                Sears); Department of Pediatrics, University of            University of Manitoba, Winnipeg, Manitoba,            1. Ojha S, Budge H. Early origins of obesity and
                British Columbia, Vancouver, British Columbia,             Canada; A. Dean Befus, PhD, University of Alberta,     developmental regulation of adiposity. In: Symonds
                Canada (Turvey); Child and Family Research                 Edmonton, Alberta, Canada; Michael Brauer, ScD,        ME, ed. Adipose Tissue Biology. New York, NY:
                Institute, BC Children’s Hospital, Vancouver, British      University of British Columbia, Vancouver, British     Springer International Publishing; 2017:427-456.
                Columbia, Canada (Turvey); Department of                   Columbia, Canada; Jeff R. Brook, PhD, University of
                Pediatrics and Physiology, Hospital for Sick                                                                      2. Wang L, Collins C, Ratliff M, Xie B, Wang Y.
                                                                           Toronto, Toronto, Ontario, Canada; Edith Chen,         Breastfeeding reduces childhood obesity risks.
                Children, University of Toronto, Toronto, Ontario,         PhD, Northwestern University, Chicago, Illinois;
                Canada (Moraes, Subbarao).                                                                                        Child Obes. 2017;13(3):197-204.
                                                                           Michael M. Cyr, MD, McMaster University, Hamilton,
                Author Contributions: Drs Azad and Kozyrskyj had           Ontario, Canada; Denise Daley, PhD, University of      3. Marseglia L, Manti S, D’Angelo G, et al. Obesity
                full access to all the data in the study and take          British Columbia, Vancouver, British Columbia,         and breastfeeding: the strength of association.
                responsibility for the integrity of the data and the       Canada; Sharon D. Dell, MD, The Hospital for Sick      Women Birth. 2015;28(2):81-86.
                accuracy of the data analysis. Drs Forbes and Azad         Children, Toronto, Ontario, Canada; Judah A.           4. Rosenbaum M, Knight R, Leibel RL. The gut
                are co-first authors, and Drs Scott and Kozyrskyj are      Denburg, MD, McMaster University, Hamilton,            microbiota in human energy homeostasis and
                co-last authors.                                           Ontario, Canada; Qing L. Duan, PhD, Queen’s            obesity. Trends Endocrinol Metab. 2015;26(9):493-
                Study concept and design: Azad, Becker, Mandhane,          University, Kingston, Ontario, Canada; Thomas          501.
                Turvey, Subbarao, Scott, Kozyrskyj.                        Eiwegger, MD, The Hospital for Sick Children,          5. Ley RE. Obesity and the human microbiome.
                Acquisition, analysis, or interpretation of data: All      Toronto, Ontario, Canada; Hartmut Grasemann,           Curr Opin Gastroenterol. 2010;26(1):5-11.
                authors.                                                   MD, The Hospital for Sick Children, Toronto,
                Drafting of the manuscript: Forbes, Azad.                  Ontario, Canada; Kent HayGlass, PhD, University of     6. Le Chatelier E, Nielsen T, Qin J, et al; MetaHIT
                Critical revision of the manuscript for important          Manitoba, Winnipeg, Manitoba, Canada; Richard G.       Consortium. Richness of human gut microbiome
                intellectual content: Azad, Vehling, Tun, Konya,           Hegele, MD, PhD, The Hospital for Sick Children,       correlates with metabolic markers. Nature. 2013;
                Guttman, Field, Lefebvre, Sears, Becker, Mandhane,         Toronto, Ontario, Canada; D. Linn Holness, MD,         500(7464):541-546.
                Turvey, Moraes, Subbarao, Scott, Kozyrskyj.                University of Toronto, Toronto, Ontario, Canada;       7. Koliada A, Syzenko G, Moseiko V, et al.
                Statistical analysis: Forbes, Azad, Tun, Scott.            Perry Hystad, PhD, Oregon State University,            Association between body mass index and
                Obtained funding: Sears, Becker, Mandhane,                 Corvallis; Michael Kobor, PhD, University of British   Firmicutes/Bacteroidetes ratio in an adult Ukrainian
                Turvey, Subbarao, Scott, Kozyrskyj.                        Columbia, Vancouver, British Columbia, Canada;         population. BMC Microbiol. 2017;17(1):120.
                Administrative, technical, or material support: Tun,       Tobias R. Kollmann, MD, PhD, University of British     8. Turnbaugh PJ, Ley RE, Mahowald MA, Magrini V,
                Konya, Guttman, Field, Lefebvre, Sears, Mandhane,          Columbia, Vancouver, British Columbia, Canada;         Mardis ER, Gordon JI. An obesity-associated gut
                Turvey, Moraes, Scott, Kozyrskyj.                          Anita L. Kozyrskyj, PhD, University of Alberta,        microbiome with increased capacity for energy
                Study supervision: Azad, Guttman, Turvey, Scott,           Edmonton, Alberta, Canada; Catherine Laprise,          harvest. Nature. 2006;444(7122):1027-1031.
                Kozyrskyj.                                                 PhD, Université du Québec à Chicoutimi,
                                                                           Chicoutimi, Québec, Canada; Wendy Y.W. Lou, PhD,       9. Riva A, Borgo F, Lassandro C, et al. Pediatric
                Conflict of Interest Disclosures: Dr Azad reported                                                                obesity is associated with an altered gut microbiota
                holding a Canada Research Chair in the                     University of Toronto, Toronto, Ontario, Canada;
                                                                           Joseph Macri, PhD, McMaster University, Hamilton,      and discordant shifts in Firmicutes populations.
                Developmental Origins of Chronic Disease. Dr Sears                                                                Environ Microbiol. 2017;19(1):95-105.
                reported holding the AstraZeneca endowed chair in          Ontario, Canada; Piushkumar J. Mandhane, MD,
                respiratory epidemiology. No other disclosures             PhD, University of Alberta, Edmonton, Alberta,         10. Borgo F, Verduci E, Riva A, et al. Relative
                were reported.                                             Canada; Greg Miller, PhD, Northwestern University,     abundance in bacterial and fungal gut microbes in
                                                                           Chicago, Illinois; Theo J. Moraes, MD, PhD, The        obese children: a case control study. Child Obes.
                Funding/Support: The Canadian Institutes of                Hospital for Sick Children, Toronto, Ontario,          2017;13(1):78-84.
                Health Research (CIHR) and the Allergy, Genes and          Canada; Peter Pare, MD, University of British
                Environment Network of Centres of Excellence                                                                      11. Ignacio A, Fernandes MR, Rodrigues VAA, et al.
                                                                           Columbia, Vancouver, British Columbia, Canada;         Correlation between body mass index and faecal
                provided core funding for the Canadian Healthy             Clare Ramsey, MD, University of Manitoba,
                Infant Longitudinal Development (CHILD) Study.                                                                    microbiota from children. Clin Microbiol Infect.
                                                                           Winnipeg, Manitoba, Canada; Felix Ratjen, MD, The      2016;22(3):258.e1-258.e8.
                This research was specifically funded by CIHR              Hospital for Sick Children, Toronto, Ontario,
                Microbiome Initiative team grant 227312 and the            Canada; Andrew Sandford, PhD, University of

        10/11   JAMA Pediatrics July 2018 Volume 172, Number 7 (Reprinted)                                                                                         jamapediatrics.com

                                                                    © 2018 American Medical Association. All rights reserved.

Downloaded From: by a University of Manitoba User on 07/03/2018
Association of Breastfeeding With Gut Microbiota and Risk of Overweight Original Investigation Research
12. Lemas DJ, Yee S, Cacho N, et al. Exploring the 24. Paolella G, Vajro P. Childhood obesity, composition and weight development in children:
contribution of maternal antibiotics and breastfeeding, intestinal microbiota, and early the KOALA Birth Cohort Study. Int J Obes (Lond).
breastfeeding to development of the infant exposure to antibiotics: what is the link? JAMA 2015;39(1):16-25.
microbiome and pediatric obesity. Semin Fetal Pediatr. 2016;170(8):735-737. 39. White RA, Bjørnholt JV, Baird DD, et al. Novel
Neonatal Med. 2016;21(6):406-409. 25. Pannaraj PS, Li F, Cerini C, et al. Association developmental analyses identify longitudinal
13. Cerdó T, Ruiz A, Campoy C. Human gut between breast milk bacterial communities and patterns of early gut microbiota that affect infant
microbiota and obesity during development. In: establishment and development of the infant gut growth. PLoS Comput Biol. 2013;9(5):e1003042.
Gordeladze J, ed. Adiposity—Omics and Molecular microbiome. JAMA Pediatr. 2017;171(7):647-654. 40. Vael C, Verhulst SL, Nelen V, Goossens H,
Understanding. London, United Kingdom: 26. Timmerman HM, Rutten NBMM, Boekhorst J, Desager KN. Intestinal microflora and body mass
InTechOpen; 2017:265-285. et al. Intestinal colonisation patterns in breastfed index during the first three years of life: an
14. Subbarao P, Anand SS, Becker AB, et al; CHILD and formula-fed infants during the first 12 weeks of observational study. Gut Pathog. 2011;3(1):8.
Study investigators. The Canadian Healthy Infant life reveal sequential microbiota signatures. Sci Rep. 41. Kalliomäki M, Collado MC, Salminen S, Isolauri
Longitudinal Development (CHILD) Study: 2017;7(1):8327. E. Early differences in fecal microbiota composition
examining developmental origins of allergy and 27. Milani C, Duranti S, Bottacini F, et al. The first in children may predict overweight. Am J Clin Nutr.
asthma. Thorax. 2015;70(10):998-1000. microbial colonizers of the human gut: 2008;87(3):534-538.
15. WHO Multicentre Growth Reference Study composition, activities, and health implications of 42. Korpela K, Zijlmans MAC, Kuitunen M, et al.
Group. WHO Child Growth Standards: the infant gut microbiota. Microbiol Mol Biol Rev. Childhood BMI in relation to microbiota in infancy
Length/Height-for-Age, Weight-for-Age, 2017;81(4):e00036-e17. and lifetime antibiotic use. Microbiome. 2017;5(1):26.
Weight-for-Length, Weight-for-Height and Body 28. Yeung H, Leff M, Rhee KE. Effect of exclusive
Mass Index-for-Age: Methods and Development. 43. Singh S, Karagas MR, Mueller NT. Charting the
breastfeeding among overweight and obese maternal and infant microbiome: what is the role of
Geneva, Switzerland: World Health Organization; mothers on infant weight-for-length percentile at
2006. diabetes and obesity in pregnancy? Curr Diab Rep.
1 year. Breastfeed Med. 2017;12:39-47. 2017;17(2):11.
16. Corby L, Secker D. Growth monitoring of infants 29. Bider-Canfield Z, Martinez MP, Wang X, et al.
and children using the 2006 World Health 44. Roy SM, Spivack JG, Faith MS, et al. Infant BMI
Maternal obesity, gestational diabetes, or weight-for-length and obesity risk in early
Organization [WHO] Child Growth Standards and breastfeeding and childhood overweight at age 2
2007 WHO growth references: practice-based childhood. Pediatrics. 2016;137(5):e20153492-
years. Pediatr Obes. 2017;12(2):171-178. e20153492.
evidence in nutrition. Acta Paediatr. 2006;(suppl
450):76-85. 30. Castanys-Muñoz E, Martin MJ, Vazquez E. 45. Cox LM, Yamanishi S, Sohn J, et al. Altering the
Building a beneficial microbiome from birth. Adv Nutr. intestinal microbiota during a critical
17. Azad MB, Konya T, Persaud RR, et al; CHILD 2016;7(2):323-330.
Study Investigators. Impact of maternal developmental window has lasting metabolic
intrapartum antibiotics, method of birth and 31. Sela DA, Mills DA. Nursing our microbiota: consequences. Cell. 2014;158(4):705-721.
breastfeeding on gut microbiota during the first molecular linkages between bifidobacteria and milk 46. Cani PD, Lecourt E, Dewulf EM, et al. Gut
year of life: a prospective cohort study. BJOG. 2016; oligosaccharides. Trends Microbiol. 2010;18(7): microbiota fermentation of prebiotics increases
123(6):983-993. 298-307. satietogenic and incretin gut peptide production
18. Azad MB, Sharma AK, de Souza RJ, et al; 32. Marcobal A, Barboza M, Froehlich JW, et al. with consequences for appetite sensation and
Canadian Healthy Infant Longitudinal Development Consumption of human milk oligosaccharides by glucose response after a meal. Am J Clin Nutr.
Study Investigators. Association between artificially gut-related microbes. J Agric Food Chem. 2010;58 2009;90(5):1236-1243.
sweetened beverage consumption during (9):5334-5340. 47. Schéle E, Grahnemo L, Anesten F, Hallén A,
pregnancy and infant body mass index. JAMA Pediatr. 33. Azad MB, Konya T, Maughan H, et al; CHILD Bäckhed F, Jansson JO. The gut microbiota reduces
2016;170(7):662-670. Study Investigators. Gut microbiota of healthy leptin sensitivity and the expression of the
19. Guenther PM, Casavale KO, Reedy J, et al. Canadian infants: profiles by mode of delivery and obesity-suppressing neuropeptides proglucagon
Update of the Healthy Eating Index: HEI-2010. infant diet at 4 months. CMAJ. 2013;185(5):385-394. (Gcg) and brain-derived neurotrophic factor (Bdnf)
J Acad Nutr Diet. 2013;113(4):569-580. 34. Laursen MF, Andersen LBB, Michaelsen KF, in the central nervous system. Endocrinology. 2013;
et al. Infant gut microbiota development is driven 154(10):3643-3651.
20. Caporaso JG, Kuczynski J, Stombaugh J, et al.
QIIME allows analysis of high-throughput by transition to family foods independent of 48. Chantry CJ, Dewey KG, Peerson JM, Wagner
community sequencing data. Nat Methods. 2010;7 maternal obesity. mSphere. 2016;1(1):e00069-e15. EA, Nommsen-Rivers LA. In-hospital formula use
(5):335-336. 35. Boulangé CL, Neves AL, Chilloux J, Nicholson increases early breastfeeding cessation among
JK, Dumas M-E. Impact of the gut microbiota on first-time mothers intending to exclusively
21. DeSantis TZ, Hugenholtz P, Larsen N, et al. breastfeed. J Pediatr. 2014;164(6):1339-1345.e5.
Greengenes, a chimera-checked 16S rRNA gene inflammation, obesity, and metabolic disease.
database and workbench compatible with ARB. Genome Med. 2016;8(1):42. 49. Amarri S, Benatti F, Callegari ML, et al. Changes
Appl Environ Microbiol. 2006;72(7):5069-5072. 36. Fernandes J, Su W, Rahat-Rozenbloom S, of gut microbiota and immune markers during the
Wolever TM, Comelli EM. Adiposity, gut microbiota complementary feeding period in healthy
22. van Buuren S, Groothuis-Oudshoorn K. mice: breast-fed infants. J Pediatr Gastroenterol Nutr.
multivariate imputation by chained equations in R. and faecal short chain fatty acids are linked in adult
humans. Nutr Diabetes. 2014;4:e121. 2006;42(5):488-495.
J Stat Softw. 2011;45(3):1-67. doi:10.18637
/jss.v045.i03 37. Koleva PT, Bridgman SL, Kozyrskyj AL. The 50. Qasem W, Azad MB, Hossain Z, et al.
infant gut microbiome: evidence for obesity risk Assessment of complementary feeding of Canadian
23. Lozupone C, Knight R. UniFrac: a new infants: effects on microbiome & oxidative stress, a
phylogenetic method for comparing microbial and dietary intervention. Nutrients. 2015;7(4):2237-
2260. randomized controlled trial. BMC Pediatr. 2017;17
communities. Appl Environ Microbiol. 2005;71(12): (1):54.
8228-8235. 38. Scheepers LE, Penders J, Mbakwa CA, Thijs C,
Mommers M, Arts ICW. The intestinal microbiota
jamapediatrics.com (Reprinted) JAMA Pediatrics July 2018 Volume 172, Number 7 11/11
© 2018 American Medical Association. All rights reserved.
Downloaded From: by a University of Manitoba User on 07/03/2018Supplementary Online Content
Forbes JD, Azad MB, Vehling L, et al; Canadian Healthy Infant Longitudinal Development
(CHILD) Study investigators. Association of exposure to formula in the hospital and
subsequent infant feeding practices with gut microbiota and risk of overweight in the first year
of life. JAMA Pediatr. Published online June 4, 2018. doi:10.1001/jamapediatrics.2018.1161
eFigure 1. Flow Diagram Summarizing Selection of CHILD Study Infants Included in the Current
Analysis
eFigure 2. Microbial Community Structure of 3-Month and 12-Month Microbiota Based on
Breastfeeding Status at 3-4 Months and Infant Diet at 6 months, Respectively, as Measured
by Beta-Diversity
eFigure 3. Infant Gut Microbiota at 12 Months According to Breastfeeding (BF) Duration
eFigure 4. Infant Gut Microbiota Characterization at 12 Months According to Infant Weight Status at
12 Months
eFigure 5. Association of Key Microbiota Measures at 3 and 12 Months With Infant Weight Status at
12 Months
eFigure 6. Associations and Hypothesized Mechanisms Linking Infant Feeding Practices, Gut
Microbiota and Obesity
eTable 1. Characteristics of Participants Included in the Current Study and the General CHILD
Cohort
eTable 2. Infant Feeding and Weight Variables Among Participants in the Subcohort
eTable 3. Prevalence of Potential Confounders and Associations With Breastfeeding and Overweight
Risk
eTable 4. Sensitivity Analyses: Association of Infant Feeding Practices With Infant Weight Status at
12 Months
eTable 5. Median Relative Abundance of Abundant Taxa in Gut Microbiota at 3-4 Months According
to Feeding Status
eTable 6. Pairwise PERMANOVA Analyses of Infant Microbiota According to Feeding Status at 3-4
Months and 6 Months
eTable 7. Median Relative Abundance of Abundant Taxa in Fecal Microbiota of Infants at 12 Months
According to Feeding Status at 6 Months
eTable 8. Median Relative Abundance of Abundant Taxa in Fecal Microbiota of Infants at 12 Months
According to Breastfeeding (BF) Duration
eTable 9. Median Relative Abundance of Abundant Taxa in Fecal Microbiota of Infants at 3-4 and 12
Months According to Infant Weight Status at 12 Months
eAppendix. Detailed Methods
This supplementary material has been provided by the authors to give readers additional information
about their work.
© 2018 American Medical Association. All rights reserved.
Downloaded From: by a University of Manitoba User on 06/04/2018eFigure 1. Flow Diagram Summarizing Selection of CHILD Study Infants Included in the
Current Analysis
© 2018 American Medical Association. All rights reserved.
Downloaded From: by a University of Manitoba User on 06/04/2018eFigure 2. Microbial Community Structure of 3-Month and 12-Month Microbiota Based on
Breastfeeding Status at 3-4 Months and Infant Diet at 6 months, Respectively, as Measured by
Principal Components Analysis and tested by PERMANOVA.
Principal coordinate analysis based on (A,C) unweighted or (B,D) weighted Unifrac distances, with community structure differences tested by
PERMANOVA with 999 permutations.
© 2018 American Medical Association. All rights reserved.
Downloaded From: by a University of Manitoba User on 06/04/2018eFigure 3. Infant Gut Microbiota at 12 Months According to Breastfeeding (BF) Duration#
(A) Alpha diversity evaluated by richness (ACE, Chao1) and diversity (Simpson, Shannon). Median estimates compared across feeding groups using the Kruskal–Wallis test and Dunn’s post-hoc tests for
multiple comparisons. Boxes indicate interquartile range, lines indicate medians, diamonds indicate means and whiskers represent range. P-values represent overall FDR corrected P-values: *p 12 months; no significant differences were observed between BFeFigure 4. Infant Gut Microbiota Characterization at 12 Months According to Infant Weight Status at 12 Months
(A) Alpha diversity evaluated by richness (ACE, Chao1) and diversity (Simpson, Shannon). Median estimates compared across weight status using the Kruskal–Wallis test and Dunn’s post-hoc tests for
multiple comparisons. Boxes indicate interquartile range, lines indicate medians, diamonds indicate means and whiskers represent range. P-values represent overall FDR corrected P-values: *peFigure 5. Association of Key Microbiota Measures at 3 and 12 Months With Infant Weight
Status at 12 Months
F/B ratio, Firmicutes/Bacteroidetes ratio; CI, confidence interval; OR, unadjusted odds ratio.
© 2018 American Medical Association. All rights reserved.
Downloaded From: by a University of Manitoba User on 06/04/2018eFigure 6. Associations and Hypothesized Mechanisms Linking Infant Feeding Practices, Gut
Microbiota and Obesity
Results from this study show that formula-feeding is strongly associated with increased overweight risk at 1 year of age, and provide evidence
that early changes in the gut microbiota (i.e. during the first 3-4 months of life) contribute to this association. Infant formulas differ from human
milk in composition and bioactivity, causing changes in gut microbial communities that likely lead to altered metabolic networks affecting
energy harvest, satiety and inflammation. These physiological changes, along with host genotype and environmental exposures, influence
infant weight gain, adiposity and obesity risk later in life. Aside from these microbiota-related pathways, formula may influence weight gain
through other mechanisms related to its composition (eg. higher protein content compared to human milk) or delivery to the infant (e.g. bottle
feeding may discourage self-regulation compared to suckling at the breast). *Indicates microbiota features significantly associated with both
formula feeding and risk of overweight in this study.
© 2018 American Medical Association. All rights reserved.
Downloaded From: by a University of Manitoba User on 06/04/2018eTable 1. Characteristics of Participants Included in the Current Study and the General CHILD
Cohort
Subset for General
current study CHILD cohort
(N=1087) (N=3296)
Breastfeeding duration 10.26 [6.81] 10.39 [6.81]
Exclusive breastfeeding duration 2.90 [2.37] 3.16 [2.31]
Weight for length (WFL) z-score 0.29 [1.08] 0.25 [1.04]
Maternal race
Asian 164 (15.2) 508 (15.7)
Caucasian 817 (75.8) 2359 (72.9)
FN 48 (4.5) 143 (4.4)
Other 49 (4.5) 225 (7.0)
Maternal postsecondary degree
No 230 (21.8) 746 (23.7)
Yes 823 (78.2) 2407 (76.3)
Maternal smoking in pregnancy
No 967 (91.5) 2897 (90.9)
Yes 90 (8.5) 290 (9.1)
Maternal Healthy Eating Index
< 70 306 (30.4) 990 (33.1)
70 to 75 240 (23.9) 682 (22.8)
> 75 459 (45.7) 1323 (44.2)
Maternal weight class
Underweight 31 (3.0) 103 (3.5)
Normal 586 (57.2) 1760 (59.9)
Overweight 230 (22.4) 633 (21.6)
Obese 178 (14.4) 440 (15.0)
Dog in home
No 687 (66.9) 2142 (69.7)
Yes 340 (33.1) 930 (30.3)
Cat in home
No 745 (72.6) 2308 (75.2)
Yes 281 (27.4) 762 (24.8)
Older siblings
No 569 (52.3) 1772 (53.9)
Yes 518 (47.7) 1519 (46.2)
Infant sex
Male 580 (53.4) 1726 (52.7)
Female 507 (46.6) 1550 (47.3)
Birth weight (g)
< 3000 162 (15.2) 527 (16.5)
3000 to < 3500 419 (39.4) 1243 (38.9)
3500 to < 4000 350 (32.9) 1024 (32.0)
4000 + 133 (12.5) 403 (12.6)
Birth mode
CS-Elective 121 (11.4) 346 (10.8)
CS-Emergency 153 (14.4) 466 (14.6)
Vaginal, IAP 237 (22.3) 688 (21.5)
Vaginal, no IAP 553 (52.0) 1695 (53.1)
Oral antibiotics before 12 months
No 815 (79.7) 2266 (80.3)
Yes `208 (20.3) 557 (19.7)
BMI, body mass index; WFL, weight-for-length; FN, First Nations; CS, caesarean section; IAP, intrapartum antibiotic prophylaxis.
Values are n (%) or mean [standard deviation]. Percentages reflect proportion of non-missing data for each variable. Breastfeeding
refers to breast milk feeding, regardless of feeding mode (at the breast or from a bottle).
© 2018 American Medical Association. All rights reserved.
Downloaded From: by a University of Manitoba User on 06/04/2018eTable 2. Infant Feeding and Weight Variables Among Participants in the Subcohort (N* = 1087)
Feeding exposure variables
Breastfeeding at 3 months
None (formula only) 175 (16.1)
Partial (breast milk + formula) 323 (29.7)
Exclusive after hospital (brief formula supplementation in hospital) 179 (16.5)
Exclusive (breast milk only) 400 (36.8)
Missing 10 (0.9)
Breastfeeding status at time of 3-4 month sampling
None (formula only) 225 (20.7)
Partial (breast milk + formula) 367 (33.8)
Exclusive after hospital (brief formula supplementation in hospital) 150 (13.8)
Exclusive (breast milk only) 324 (29.8)
Missing 21 (1.9)
Breastfeeding at 6 months
None (formula +/- food) 264 (24.3)
Partial breastfeeding with formula (breast milk + formula +/- food) 307 (28.2)
Partial breastfeeding without formula (breast milk + food) 286 (26.3)
Exclusive (breast milk only) 183 (16.8)
Missing 47 (4.3)
Breastfeeding at 12 months
No 591 (54.4)
Yes 459 (42.2)
Missing 37 (3.4)
Breastfeeding duration
Never breastfed 49 (4.5)
Breastfed < 6 months 324 (29.8)
Breastfed 6 – 12 months 249 (22.9)
Breastfed > 12 months 459 (42.2)
Missing 6 (0.05)
Breastfeeding duration at time of 12 month sampling
Never breastfed 43 (4.0)
Breastfed < 6 months 200 (18.4)
Breastfed > 6 months, but not currently breastfeeding 365 (33.6)
Currently breastfeeding 367 (33.8)
Missing 112 (10.3)
Breastfeeding duration (months; N = 1081) 10.26 [6.81]
Exclusive breastfeeding duration (months; N = 1058) 2.90 [2.37]
Weight outcome variables
Weight class at 1 year
Normal (WFL z-score < 85th percentile) 778 (71.6)
At risk (85th – 97th percentile) 178 (16.4)
Overweight (> 97th percentile) 71 (6.5)
Missing 60 (5.5)
WFL z-score at 12 months (N = 1027) 0.29 [1.08]
WFL, weight-for-length. *N = number of infants with 3 month and/or 12 month microbiota data. Values are n (%) or
mean [± standard deviation]. Breastfeeding refers to breast milk feeding, regardless of feeding mode (at the breast or
from a bottle).
© 2018 American Medical Association. All rights reserved.
Downloaded From: by a University of Manitoba User on 06/04/2018You can also read