At the heart of discontent - Measuring public violence in South Africa Lizette Lancaster - ISS Africa
←
→
Page content transcription
If your browser does not render page correctly, please read the page content below
ISS paper 292 | MAY 2016

At the heart of discontent
Measuring public violence in South Africa
Lizette Lancaster

   Summary
   Civil protests and strike action have become increasingly commonplace in South
   Africa. Although several institutions collect data on various forms of protest, the
   available information varies in quality, reliability, coverage and accessibility. It is for
   this reason that the Institute for Security Studies launched its interactive public and
   election violence-monitoring project in 2014. The objective of this project is to enhance
   understanding of the nature and extent of all forms of public violence taking place
   across South Africa to contribute to better initiatives that address their root causes.
   This paper sets out some of the preliminary findings from the project and provides
   initial considerations for ensuring appropriate responses to protest and strike action.

Protest action has been part of South African political expression for decades. In 1994, as a
result of ongoing political violence from the 1980s, South Africa’s national homicide rate stood at
67 murders per 100 000 people. Twenty-two years on from the end of apartheid and the factors
that drove the high murder rate at the birth of democracy have abated, resulting in fewer than
half of that number of murders taking place. However, challenges such as rapid urbanisation
and high levels of unemployment, poverty and inequality, along with uneven service delivery and
unaccountable governance, continue to plague the country. Moreover, murders have again started
to increase, from 30.2 murders per 100 000 in 2011/12 to 32.9 in 2014/15. This means that South
Africa still has one of the highest homicide rates in the world. The murder rate is driven primarily by
interpersonal conflict, with contributions from armed robberies and collective violence such as taxi
and gang warfare, vigilantism and xenophobic attacks.

While a fair amount of research has been undertaken into much of the interpersonal and criminal
violence that takes place in South Africa, far less work has been done on collective or public
violence. Consequently, little is known about the true extent of the substantial variety of collective
violence taking place across the country on a daily basis, or how best to address it. This paper
aims to explain the importance of measuring the nature and extent of violence that takes place
in public, in its various forms. However, this is a complex and difficult undertaking, as will be
PAPER

    explained. This paper therefore also proposes a way forward           In the South African context, groups that commit violent acts
    towards establishing a more comprehensive monitoring system           can be charged with a whole range of crimes if harm was done
    for tracking protest and collective violence across South Africa.     or there was an attempt at causing harm. Criminal charges
                                                                          could include murder, assault, arson, malicious damage to
    Public protest as legitimate political activity                       property, or attempts of such. However, during what the police
                                                                          term ‘unrest-related incidents’, arrests are often made for the
    The right to publicly protest, demonstrate or strike is entrenched
                                                                          crime of ‘public violence’.
    in Section 17 of the South African Constitution.1 In terms of the
    Constitution, this right must not infringe on the rights of others.   South Africa’s common law defines public violence as ‘the
    The Regulation of Gatherings Act 205 of 1993 (RGA) seeks              unlawful and intentional performance by a number of persons

    to give effect to this right by providing the legal framework         of an act or acts which assumes serious proportions and are
                                                                          intended to disturb public peace and order by violent means,
    through which this right is regulated by the state.2 The RGA in
                                                                          or to infringe the rights of another’.9 It is therefore a broad term
    its preamble states ‘every person has the right to assemble with
                                                                          that encompasses a range of actions in the public space that
    other persons and to express his views on any matter freely in
                                                                          may or may not be deemed to be violent. The South African
    public and to enjoy the protection of the State while doing so’.3
                                                                          Police Service (SAPS) provides the following examples in its
    The RGA defines a gathering as ‘any assembly, concourse               manual of crime statistics:10
    or procession of 15 or more persons on a public road … or
                                                                          • Faction fighting between groups
    any public space or premises wholly or partly open to the
                                                                          • Violent resistance to the police by a mob
    air’.4 The right to assemble and associate freely is therefore
    a lawful means of political participation and civil action. In        • Rioting
    addition, an increase in political participation is widely regarded   • Forcible coercion of other workers by strikers
    as a constructive and conventional form of participation in a
                                                                          • Breaking up and taking over any meeting attended by a
    democratic state.5
                                                                            number of persons

                                                                          John RL Milton, in South African criminal law and procedure
       Many acts that form part of the South                              volume II, adds as examples ‘a gratuitous group attack on
       African protest repertoire, such as tyre                           members of the public or their property’ and ‘stone-throwing
                                                                          and disruption of traffic’.11 Milton notes that the instance of
       burning, are disruptive but not violent
                                                                          ‘violent resistance to the police by a mob’ is applicable only if
                                                                          the police are ‘acting lawfully’.12
    The government has expressed its concern about what is                Therefore, in the South African legal context of public violence,
    considered to be increasing levels of violence associated with
                                                                          acts of collective violence must be of ‘sufficiently serious
    many incidents of public protest and industrial strike action.6
                                                                          dimensions’ to be regarded as an act of public violence.13 Very
    International evidence suggests that exposure to violence
                                                                          often, the seriousness of the violence is quite visible given
    leads to the normalisation of violence in communities, which in
                                                                          that acts associated with public violence are accompanied
    turn forms the basis for the acceptance of violent means as a
                                                                          by clearly defined criminal acts such as malicious damage
    conventional form of political expression.7
                                                                          to property, arson, assault and, at the extreme end, murder.
    Defining public violence                                              However, the question remains whether disruptions to traffic
                                                                          flow and blocking off of streets are serious enough to be
    The World Health Organization (WHO) provides a useful
                                                                          regarded as being violent, despite the example offered by
    framework for the notion of violence associated with groups. It
                                                                          Milton of traffic disruption.
    defines the term ‘collective violence’ as ‘the instrumental use
    of violence by people who identify themselves as members of           It is for this reason that research by the University of
    a group … against another group or set of individuals, in order       Johannesburg’s Social Change Research Unit distinguishes
    to achieve a political, economic or social objective’.8 The types     between peaceful, disruptive and violent protests.14 Its position
    of objectives are useful as they provide some context to the          is that many acts that form part of the South African protest
    varying nature of the motives for violence. The definition also       repertoire, such as tyre burning, are disruptive but not violent.
    emphasises the presence of a group or members of a group.             For example, in a recent analysis of police crowd incidents,

2   At the heart of discontent: Measuring public violence in South Africa
researchers concluded that 46% of incidents described as ‘unrest related’ by the
SAPS were in fact disruptive rather than violent.15
South African research undertaken by Harvard Law School researchers Jain and
Karamoko define violent protests ‘as those protests where some of the participants
have engaged in physical acts that either cause immediate harm to some person,
or are substantially likely to result in such harm’.16 They include examples such as
causing injury, burning down buildings, looting, throwing rocks at passing motorists,
and burning tyres to block roads. They acknowledge that this definition is limited, as it
requires a subjective valuation as to what is deemed to be violent and what is not.17
The question remains whether disruptions to traffic flow
and blocking off of streets are serious enough to be
regarded as being violent
For the purposes of this paper, any action that may fall foul of the provisions of the RGA
and involve a criminal act of violence as defined by Milton will be recorded as such.
Challenges in determining the extent of public violence
In recent years, the SAPS has released data on public order incidents recorded on its
Incident Registration Information System (IRIS). According to the SAPS’s 2015 annual
report, the police monitored 14 740 ‘crowd-related events’ (including recreational,
religious, cultural or sports events) between April 2014 and March 2015.18 Therefore,
the police are deployed to monitor more than 40 public gatherings per day on average
(three more per day than in the previous year and six more than two years previously).
The events that required the SAPS to take action are described as ‘unrest-related’.
Overall, 15.5% of the crowd events were categorised on IRIS as ‘unrest-related’.
The Social Change Research Unit, in its research report into this data, quotes a senior
SAPS member describing what is meant by ‘crowd unrest’ as events that require
‘interventions’ such as ‘pushing back’ or making arrests.19 Examples sited of such
interventions include the use of the police’s non-lethal crowd management equipment
such as water cannons, tear gas, stun grenades and rubber bullets.20
Researchers have raised numerous detailed concerns over the reliability of this data.21
For one, the data is not subjected to any external or independent auditing processes.
The IRIS trends over time seem to reflect the frequency of police activity rather than the
46%
number of crowd events.22 Capturing of the data seems to be fairly arbitrary rather than
as the result of adhering to systematic recording protocols, definitions
and categorisations.23
The SAPS also releases the number of recorded cases of public violence as part of the
annual crime statistics. The police data for the past decade is contained in Figure 1.
The percentage of
Given that the SAPS’s IRIS data is highly unreliable in clearly establishing the extent of
incidents described as
public violence incidents in South Africa, it may be more useful to look at its statistics ‘unrest related’ by the
on arrests made for public violence. According to the 2015 annual report, the Public SAPS that were disruptive
Order Policing Units made 3 389 arrests during the 2 289 ‘unrest-related incidents’ rather than violent
captured on the IRIS system.24 The number of arrests provides a useful trend over time,
ISS paper 292 • MAY 2016 3PAPER
Figure 1: Number of peaceful crowd-related events, unrest-related incidents
and public violence cases, 2004/05 to 2014/15
14
12 451
12 11 680
10 744 11 668
10 156
10 10 517
8 981
Thousands
8 7 993
7 858 6 640
6 342
6
4
2 289
1 907
2 1 500 1 323 1 226 1 882
974 1 044 1 023 895 1 152
1 783 1 691 1 993
660 965 753 755 753 1 014 971 1 194
0
05
06
07
08
09
10
11
12
13
14
15
0
0
0
0
0
0
0
0
0
0
0
/2
/2
/2
/2
/2
/2
/2
/2
/2
/2
/2
04
05
06
07
08
09
10
11
12
13
14
20
20
20
20
20
20
20
20
20
20
20
Crowd-related events Unrest-related events Public violence cases
Source: SAPS (Compiled from various South African Police Service Annual Reports, http://www.saps.
gov.za/about/stratframework/annualreports.php; IRIS data sent to ISS by SAPS in 2013, Crime Statistics
releases available on saps website, http://www.saps.gov.za/resource_centre/publications/statistics/
crimestats/2015/crime_stats.php).
but several arrests are often made during events and the arrests are dependent on
not only the behaviour of the crowd but also the discretion of the police on the day.
Figure 1 shows that the number of ‘unrest-related’ incidents recorded by the SAPS
on the IRIS system (2 289) since 2011/2012 surpass the number of public violence
cases opened (1 993).25 This could be the result of more comprehensive capturing
of incidents in recent years or other factors, such as an indication that the police are
increasingly unable to deal with the increase in the number of events that they deem
violent or simply that they arrest proportionately fewer people. Nonetheless, this is
an interesting anomaly that requires further investigation.
Who is involved in public violence?
The nature and drivers of the violence are complex. To understand what drives
public violence is to firstly understand what is behind most of the country’s high
interpersonal violence levels. A useful departure point for some of the contributing
risk factors is contained in the ecological framework. This framework attempts to
3 389
explain many of the multilevel risk factors that contribute to interpersonal violence.26
These risk factors are related to the individual, his/her lifetime relationships, the
community dynamics and societal realities and norms.27 Societal factors, for
instance, include social and economic inequality, poverty, rapid social change, weak
social nets and cultural norms that support violence.28
The number of arrests
made by Public Order Many of these are also the risk factors for collective violence. Among the specific
Policing Units risk factors for collective violence mentioned by the WHO are political factors such
during 2 289 ‘unrest- as a lack of democratic processes, unequal access to power and government
related incidents’ corruption. Also included are demographic, societal and economic factors such
as socio-economic inequality, uneven development and access to resources, high
4 At the heart of discontent: Measuring public violence in South AfricaFigure 2: The World Health Organization’s ecological framework – examples of multi-level risk factors
• Rapid social change • Poverty
• Gender, social and economic • High crime levels
inequalities Societal • High residential mobility
• Poverty • High unemployment
• Weak economic safety nets • Local illicit drug trade
• Poor rule of law • Situational factors
Community
• Cultural norms that support
violence
Relationship
Individual
• Poor parenting practices
• Victim of child maltreatment
• Marital discord
• Psychological/personality
• Violent parental conflict
disorder
• Friends that engage in violence
• Alcohol/substance abuse
• Low socio-economic status of
• History of violent behaviour
the household
Source: Adapted from WHO, The ecological model, 2015, http://www.who.int/violenceprevention/approach/ecology/en/.
levels of unemployment, high population density and rapid
These general risk factors are often exacerbated by the motives
social change.29 of different actors who are directly and sometimes indirectly
These risk factors often ignite when certain triggers are involved in the protest and strike action. The RGA identifies
introduced. Through cohort analysis, Bedasso concluded that three main actors in the orderly exercise of gatherings: the
besides the lasting political consciousness of groups established police, municipalities and convenors (gathering organisers).
under apartheid, the ‘gap between actual income and expected The triggers for escalation into violence should be studied by
returns to education explains protest’. He states, ‘[U]nfulfilled
30 exploring the actions (or inactions) of these role players.
expectations with respect to one’s human capital accumulation
Role of local government
has been the strongest and most significant of all relative welfare
indicators to predict a positive probability of political action Many incidents of protest-related violence are often
across the years.’ 31 preceded by the use of protracted conventional methods
to air grievances. For example, communities may discuss
their grievances with their ward councillors and the relevant
Government tends to follow a top-down government department, and may ultimately mobilise, sign a
petition or protest at the relevant departmental offices to hand
approach when implementing policy or
over the petition. Twala notes that the government is often
delivering services regarded as unresponsive to the needs and grievances of its
constituents. He adds that the government tends to follow a
top-down approach when implementing policy or delivering
ISS analysis of incidents of public violence over the 2014
services, without meaningful consultation with communities.32
national election period indicated that participants often employ
disruptive or violent actions during gatherings to ensure that the The Department of Cooperative Governance and Traditional
authorities, decision-makers and media pay greater attention Affairs (COGTA) in its 2014 Strategic Plan acknowledges the
to demands. However, it is short-sighted to blame protestors role played by local government when discussing the risk of
exclusively for the violence. Such an approach provides limited violent community protests. It lists several contributing factors,
insight into workable solutions that can address public violence. such as ‘inadequate communication, feedback and response
ISS paper 292 • MAY 2016 5PAPER
on community issues’; ‘poor attitude of public servants’; motivation is often political or economic gain such as access to
‘disengaged public servants’; and negative perceptions positions of power or ‘lucrative council business’.39 However,
about the government by the communities, relating to this is not always the case, as the same research found that
maladministration, fraud and corruption.33 ‘others appeared to be genuinely concerned to struggle against
corruption and incompetence’.40
In terms of the RGA, convenors of public gatherings must
give notice to the authorities. Yet it seems an increasing Langa, in the same CSVR research, adds that community
number are not doing so. An unpublished 2006 report by members strategically often in turn use the ambitions of these
Hlatshwayo noted: political opportunists to take their grievances ‘to relevant offices
because of their understanding of local politics’.41
there is a growing perception that authorities have used
the RGA, particularly section 3(2) to deny activists their Among the multiple dimensional and nuanced triggers of violent
basic civil rights. The RGA, according to activists, is protest are the presence of criminal sub-groups, the use of
used by the ruling elite to criminalise genuine grassroots violence in an attempt to ensure causes are taken seriously,
political actions, delegitimize and discredit civil society and xenophobia.42
organisations and social movements. Activists further
caution that the RGA’s provisions might seem harmless –
but in essence pose a serious challenge to the poor – who
Municipalities and police increasingly
might not be able to comply for a variety of reasons. At deny groups the right to protest, and the
the same time, basic freedoms of association, expression reasons for denial are often arbitrary
and assembly are seriously and adversely affected by the
onerous regulations, which some activists argue might
Generally, though, protestors are not aware of the complexity
be unconstitutional.34
of service delivery. For example, many regard municipalities
Subsequent studies support this view that municipalities and as the sole contact point for government grievances even
police increasingly deny groups the right to protest. The reasons
though complaints may be related to provincial or national
for denial are often arbitrary and sometimes politically motivated.
competencies. Often, the local ward councillor is regarded as
In other instances, authorities place unreasonable conditions on
the main contact with the government, regardless of
groups or demand exorbitant fees.35 According to Royeppen
the grievance.
and Duncan, these ‘injustices’ lead to a growing trend of
organisers ‘not bothering with the official process of notifying A comprehensive analysis of the drivers of protest and strike
municipalities anymore’. 36 actions will form part of a future paper. For now, in the absence
of comprehensive and nuanced data, responses are largely ad
Researchers caution that attempts by the state to stem public
hoc, uncoordinated and heavily reliant on the police.
protests as a form of political expression or participation will
lead to increased anger and frustration, which may boil over into
Role of the police
displays of public violence.37 This will exacerbate pre-existing
tensions associated with experiences and perceptions of There are various triggers that can lead to this form of violence.
political, social and economic marginalisation and exclusion. 38 The most noticeable is when the police (SAPS or metro police)
respond with excessive force or respond too quickly, with the
Role of communities and use of rubber bullets and teargas, to quell the rowdiness of
community leadership the crowd. This can increase tensions and lead to repeated
Qualitative studies provide a glimpse into the troubled nature of confrontations between the police and community groups,
protests and community leadership and mobilisation generally. further eroding trust in the police and the government.
Past research have also called into question the motives of Recommendations have been made about the role of
certain protest organisers. policing during violent protests in several recent inquests and
The 2011 Centre for the Study of Violence and Reconciliation complaints, such as in the 2012 Human Rights Commission’s
(CSVR) publication The smoke that calls, reviewing eight report on police brutality.43 The inquiry came after the Council
community-level case studies, suggests that organisers are for the Advancement of the South African Constitution lodged
often political leaders who use community frustrations to a complaint in which it alleged that members of the SAPS
mobilise supporters to take up popular causes. Their true assaulted and caused the death of an unarmed civilian during a
6 At the heart of discontent: Measuring public violence in South Africaservice delivery protest. Andries Tatane was brutally assaulted and shot dead by
police during a protest in Ficksburg in April 2011.
Among others, the report condemned the use of ‘excessive’ and ‘disproportionate’
force by the SAPS in this instance, the police officers’ ignorance of the provisions
of the RGA and their infringement of the basic human rights of the deceased. The
report noted that the SAPS, in this instance, was ‘not suitably equipped to quell public
disorder and failed … to devise a plan to regulate and monitor the gathering’.44
Although this case cannot be regarded as an indictment of all public order policing,
it is a stark reminder of what public order policing should not be. Tait and Marks
note that ‘public order policing must adhere to the “rules” of democratic policing,
which include embodying values respectful of human dignity, adhering to due
process, intervening in the life of citizens only under limited and carefully controlled
circumstances, operating in equitable ways, and being publicly accountable’.45
Often, communities regard the police as a reactive force that responds with force on
behalf of an unaccountable and usually unresponsive state to quell citizens’ right to
demonstrate. The CSVR found that the ineffective policing of protests could escalate
peaceful protests into violent ones.46 It recommended that clear guidelines be drafted
for the democratic policing of protests and that specific training be provided.47
The 28 Public Order Policing (POP) units (one national mobile and 27 provincial units)
consisted of 4 314 operational members in March 2015.48 Since 2012, refresher
training courses have been offered to POP members and training curricula have been
reviewed and updated.49 However, police interventions during protests and strike
actions need to be monitored by civil society, and the policing oversight role of the
Civilian Secretariat for Police should be strengthened in this regard.50
Existing data collection efforts
In addition to the SAPS, several public and civil institutions gather data on various
forms of protest. A summary of key institutions and their findings is contained in
Table 1.
Table 1: Protest numbers supplied by various organisations, 2013 to 2015
Organisation Focus area 2012 2013 2014 2015
Protests against
Municipal IQ 173 155 191 164
local government
Social Change
Research Unit, ‘Community’ Not Not
470 287
University of protests available available
4 314
Johannesburg
Civic Protest
‘Civil’ protests
Barometer, Not
against local 150 140 218
University of the available
government
Western Cape The number of
operational members in
Source: Municipal IQ press briefing, 2016, http://www.municipaliq.co.za/index.php?site_page=press.
php, Social Change Research Unit media briefing: Community Protests, 2014, https://www.youtube. 28 Public Order Policing
com/watch?feature=player_embedded&v=XqwBSNBMPCU, Multi-Level Government Initiative, Civic units in March 2015
protests barometer 2007–2014, http://mlgi.org.za/talking-good-governance/20150219%20Civic%20
Protest%20Barometer%20Published%20%20DP.pdf
ISS paper 292 • MAY 2016 7PAPER
The private research organisation Municipal IQ publishes the Municipal Hotspots Monitor,
which covers ‘major’ community protests against local government service delivery. It
has been collecting data from media reports since 2004.51 Between January and
December 2015 it recorded 164 protests, down from 191 in 2014, which was the highest
recorded number since 2004. It recorded 155 incidents in 2013 and 173 in 2012.52
Researchers from the Social Change Research Unit started conducting detailed research
on community protests in 2009. By the end of 2013, the unit’s database consisted of
2 020 protests collected from media reports since 2004. In addition, its researchers have
conducted 250 interviews nationally.53 The database shows 287 incidents for 2013, down
39% from the 470 recorded in 2012.
A freely available, complete and updated public violence
database will help build knowledge about the nature
and extent of this phenomenon
The Multi-Level Government Initiative is described as ‘a multi-disciplinary project of
the Community Law Centre at the University of the Western Cape’.54 Its Civic Protest
Barometer measures protest action trends in South Africa’s municipalities since 2007.55
The analysis shows an increase to 218 protests in 2014 from around 140 in 2013 and
about 150 in 2012.56
The organisation defines the protest action covered in its barometer as ‘civil protest’, to
which it applies ‘a narrow definition, referring to organized protest action within a local
area which directly targets municipal government or targets municipal government as a
proxy to express grievances against the state more widely’.57
The Social Protest Observatory is based at the Centre for Civil Society at the University
of KwaZulu-Natal. The observatory utilises media reports and a network of activists
and scholars to monitor national protest action.58
Currently, the available data does not provide a comprehensive picture of public
violence regardless of its form, because of the varying nature of the data. Jane Duncan
points out that the narrow view of protest applied by many of the private and civil
organisations, and the inherent assumption that community protests are largely aimed
at local government failure, ignores the service delivery complexities and varying
service delivery mandates of different spheres of government.59
There is a need for a broader defined comprehensive database that goes beyond the
scope of protests targeting municipalities. The reasons are as follows:
2 880
• Data collection on and research into protests have been ad hoc and infrequent.
• The data varies in scope and uses different definitions.
• The data is often not publicly available or easily accessible. For example, the
the number of incidents Municipal IQ database is accessible via paid subscription and the SAPS IRIS
captured by the ISS’ database is not released publicly.
Public Violence
• The data varies in terms of quality, credibility and reliability.
Monitoring project
database during its • The data lacks the scope and nuanced detail necessary to better analyse patterns,
first three years trends and possible correlations between various forms of public violence and
other variables.
8 At the heart of discontent: Measuring public violence in South AfricaConsequently, a freely available, complete and frequently The use of media reports as the basis for identifying incidents of
updated database of various forms of public violence will help public violence poses a range of challenges. The exact nature
build a body of knowledge about the nature and extent of this of the relevant event is often not clear due to insufficient details
phenomenon in South Africa. Such a comprehensive data set in the report. For instance, the community grievances behind a
could help inform a better understanding of the drivers that protest are reported on in broad terms such as being ‘service
result in public violence in different contexts. This would enable delivery’ related. The fundamental reasons for the protests
all parties, including state institutions, to develop multi-faceted are not always apparent. Furthermore, some reports focus on
and suitable proactive responses to better manage and, where secondary events such as an attack on shops owned by foreign
possible, prevent such events, hopefully without the unintended nationals during a protest, without specifying why the protest
consequence of causing further violence. was occurring in the first place.
Moreover, the media covers some localities better than others.
ISS Public Violence Monitoring project For example, metropolitan areas will have more media coverage
The aim of the ISS’ Public Violence Monitoring project is than rural areas. Jane Duncan points out that ‘it stands to
to improve our understanding of the extent and nature of reason that it [the media] would record more protests in the
public violence in South Africa, in an attempt to help develop Western Cape and Gauteng, as these are the most media-
better approaches in addressing this phenomenon. Towards rich provinces’.62 Non-English sources require additional
this end the ISS has developed a comprehensive database consultation and may well interpret events differently.63
to systematically track the extent and nature of all forms of
violence that occur in public spaces. This includes, for example,
violence resulting from community-based protests, labour Relying on media sources makes
strikes, vigilantism, xenophobic attacks, political conflict and it difficult to assess when a protest
other crowd or inter-group activity.
became violent and which group
In the first three years of its existence 2 880 incidents were
escalated the event into violence
captured in the database. The incidents were sourced from
more than 100 local, national and international news sources
available online. In addition to media outlets, the research team It has been noted in the previous sections that the classification
examines newsletters and notices by trade unions, political of what is regarded as ‘violent’ is controversial. The media tends
parties and universities. The team also verifies its data and, to report on predominantly violent protests rather than peaceful
where relevant, incorporates the data captured by the Armed ones. Moreover, what is considered violent may vary, with some
Conflict Location & Event Data Project. 60
media articles labelling a protest as violent even if only tyres
are set alight. Reports are mostly silent about the proportion of
The captured data contains information on the following:61
protestors who engage in violent actions during a gathering and
• Dates and locations of events their motivation for committing this violence.64
• Descriptions of events Consequently, relying on media sources makes it difficult to
• Categories and main motivation of these protest incidents assess at what point a protest became violent and which group
or subgroup escalated the event into violence. The motives and
• Whether the events were peaceful or violent interests of different groupings are largely unreported.
• Range of actors involved It is for this reason that the longer-term intention of the ISS’
• Estimates of the size of the crowd monitoring project is to become less dependent on secondary
sources of information such as media reports. Towards this
• Reported fatalities and arrests
end, the ISS is actively seeking out collaboration with various
What is regarded as violent is far from precise. Incidents are civil society organisations and government agencies to capture
classified as violent as soon as there is evidence in the report information on crowd events first-hand. It is envisaged that
that the definition of public violence (set out above) has been incident capturing will take place using an integrated information
met. In many instances the harm is evident in the form of injury system comprising an interactive website,65 mobile applications,
or damage to property. In other instances the media reports are Facebook, and Twitter, among others. The system will also
not clear and the media’s interpretation and characterisation of contain stringent verification processes to ensure that data
the event as ‘peaceful’ or ‘violent’ needs to be accepted. integrity is maintained.
ISS paper 292 • MAY 2016 9PAPER
Since collection started in 2013, the data has proved useful in highlighting that most
protest actions and gatherings are aimed not at local government but at various
government departments. The information collected highlights fundamental grievances
relating to, for instance, crime and housing that have previously not been included in
many of the narratives on protest action. It is also clear that the proportion of gatherings
related to strike action is significant and places a burden not only on the economy but
also on the municipalities in which strike actions take place, the police that manage these
and citizens in general, especially when they affect the rendering of government services.
The following section highlights some of the key findings from data for the three-year
period between January 2013 and December 2015.
Key preliminary findings
By the end of 2015 the public violence database showed 2 880 incidents of public
gatherings related to protests or public violence. The classification of any event is based
on the main motivation of the crowd as identified in the source. A summary of these
categories is contained in Table 2. Future analysis will incorporate additional motives
behind events.
Table 2: Types of peaceful and violent events, 2013 to 2015
Percent- % %
Main motivation Number
age peaceful violent
Labour-related strikes and marches 641 22% 70% 30%
Anti-crime/policing-related protests 342 12% 71% 29%
Education-related protests 265 9% 47% 53%
Unspecified ‘service delivery’ protests 262 9% 22% 78%
Vigilantism 196 7% 3% 97%
Housing-related protests 181 6% 30% 70%
Election-related protests 146 5% 29% 71%
Transport-related protests 129 4% 54% 46%
Foreigner/xenophobic incidents 120 4% 16% 84%
Party-political protests/attacks 118 4% 35% 65%
Electricity-related protests 65 2% 29% 71%
International causes 57 2% 93% 7%
Water-related protests 46 2% 28% 72%
Business practice (private sector) 44 2% 68% 32%
National causes (e.g. rights issues) 41 1% 90% 10%
Land issues 37 1% 35% 65%
Corruption-related protests 32 1% 47% 53%
Sanitation/refuse-related protests 31 1% 32% 68%
Environmental-related protests 29 1% 90% 10%
Healthcare 26 1% 73% 27%
Demarcation 23 1% 13% 87%
181 housing-related
protests took place Other 49 2% 31% 69%
between 2013 and 2015 2 880 100% 47% 53%
Source: Data from ISS’ Public Violence Monitoring project.
10 At the heart of discontent: Measuring public violence in South AfricaOf these, more than half (53%) were termed ‘violent’ in media reports. This is in stark
contrast to the SAPS IRIS database’s 15.5% in 2015. The reasons for the discrepancy
are largely twofold. Firstly, the IRIS database includes a significant percentage of
non-protest or strike action-related incidents such as sporting events. Secondly, as
indicated in the previous section, the media is more likely to report on violent than non-
violent incidents.
The analysis also indicated that the percentage of events that turned violent increased
significantly from 44% in 2013 to 63% in 2015. The percentage was 58% for 2014. One
in five incidents took the form of labour-related strikes and marches (22%), followed
by anti-crime events (12%). Anti-crime events often involve protests over crime in
general, focus on specific cases or policing-related matters. The crime-related category
should not be confused with clear acts of vigilantism (7%), which sporadically erupt in
communities where the intention of groups is to take the law into their own hands.
Many of the protests on primary and secondary school
issues were about admissions, the quality of education
or access to educational facilities
Almost one in 10 events (9%) were education related, and of these 53% were marked
by some level of violence, if not from the protestors then from the police. The 2015
incidents include the #RhodesMustFall and #FeesMustFall protests at different
university campuses. Many of the protests focusing on primary and secondary school
issues were about admissions, the quality of education or access to educational
facilities. Incidents were recorded as violent when physical clashes between the police
and parents were recorded.
The data highlights that several government agencies other than those at a local level
are also the target of protests. For example, Table 2 shows the extent of grievances
directed at the police, the departments of Basic and Higher Education and the
Department of Human Settlements.
Election-related violence
The 2014 national elections took place during the analysis period. As a result, the
database was able to provide a baseline of public violence incidents that were
electorally related. As many as 146 incidents could be linked directly to the elections
in the six months leading up to the elections and directly after the event or during
party-political campaigning. Of these, 71% were violent. For example, the days
directly preceding the election day saw the burning down of Independent Electoral
Commission (IEC) tents and buildings demarcated as poling stations in areas such
as Richards Bay, Sterkspruit and Bekkersdal. Protest action was recorded on several
separate occasions in these localities in the months preceding the elections. Clashes
between political parties were recorded in provinces such as KwaZulu-Natal, Western
Cape and Gauteng.
In addition, several protests took place on the election day and some voting stations The percentage of events
were targeted and attacked. The link between elections and protests, especially that turned violent
violent protests, needs to be properly understood if the government is to respond
increased from 44% in
appropriately to ensure free and fair elections. Similar trends were recorded during the
voter registration weekends ahead of the 2016 local government elections. 2013 to 63% in 2015
ISS paper 292 • MAY 2016 11PAPER
Figure 3 describes the location of the events in terms of their metro, urban or rural
(non-urban) character.
Figure 3: Location of events by area type, 2013 to 2015
19%
Urban
Rural
63% 18%
Metro
Source: Data from ISS’ Public Violence Monitoring project.
Figure 3 shows that metro areas are well represented in the data, which could be
the result of rapid urbanisation and population density, in addition to higher media
coverage. It is thus unsurprising that two-thirds of recorded events (1 823) took place
in the metros.66 The remainder occurred equally in urban (19%) and rural areas (18%).
Certain incident types are more likely to take place in non-metro than metro areas.
Figure 4 provides a breakdown of the percentage of each incident type that occurred
in either a metro or a non-metro area.
Figure 4: Types of incidents by metro or non-metro, 2013 to 2015
4 5
16 20 20 20 21 24 25
31
36 36 37 37 39 40 40 41 41 45 47
55 56
60
71
76
Percentage
96
96 95
84
80 80 80 79 76 75
69
64 64 63 63 61 60 60 59 59
55 53
45 44
40
29
24
4
International causes
National causes
Sanitation/refuse
Electricity
Various
Housing
Environmental
Land
Transport
Healthcare
By-law enforcement
Party political
Education
Crime/Anti
Labour/strikes
Foreigners
Mismanagement/removal
Unspecified
Business practice
Elections
Vigilantism
Other
Corruption
Jobs
Roads
Water
Demarcation
Metro Non-metro
Source: Data from ISS’ Public Violence Monitoring project.
12 At the heart of discontent: Measuring public violence in South AfricaNon-metro areas were more likely to experience protests over issues relating to water,
roads, jobs and municipal demarcation (such as the ongoing disputes in Sterkspruit
in the Eastern Cape and Malamulele in Limpopo Province). The data shows that
almost all demarcation-related protest action and three out of four water- or roads-
related protests took place in non-metro areas. Close to half of the protests over jobs
or corruption, as well as incidents of vigilantism and elections-related incidents, took
place in non-metro areas.
The predominantly urbanised provinces account for most of the events. Figure 5
illustrates that Gauteng experienced almost one-third of all incidents, followed by
the Western Cape (21%), KwaZulu-Natal (15%) and the Eastern Cape (14%).
These provinces are the most urbanised and highest populated and contain the
largest metros.
Figure 5: Provincial spread of events, 2013 to 2015
Gauteng
2%
4% 2% Western Cape
KwaZulu-Natal
6%
Eastern Cape
7% 29%
Limpopo
14% North West
21% Mpumalanga
15% Free State
Northern Cape
Source: Data from ISS’ Public Violence Monitoring project.
The data shows that protest actions are more likely to occur in some localities than
others. Therefore, protest ‘hotspots’ can be identified in each province by assessing
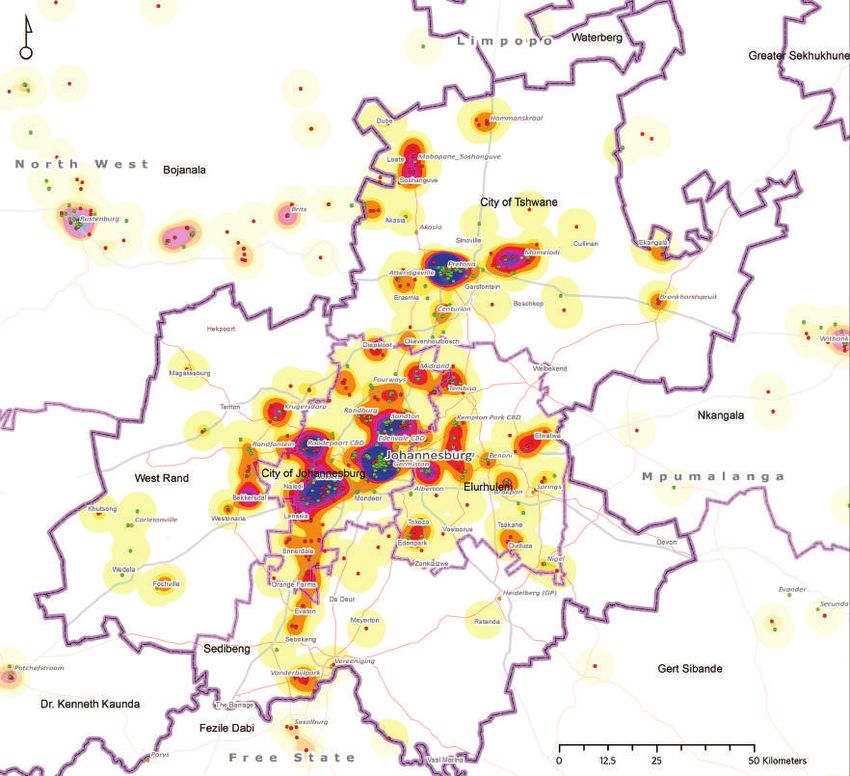
the data over time. Figure 6 shows the spread of incidents within Gauteng. It
highlights which incidents were violent and which were described as peaceful. The
notion of ‘hotspots’ has been well defined in relation to crime analysis and refers to
‘an area that has a greater than average number of criminal or disorder events, or an
area where people have a higher than average risk of victimization’.67
The map in Figure 6 shows the hotspots in terms of both the number of events and
violence, using kernel density estimates.68 Kernel density estimates is a statistical
method used to estimate the location of data – in this case protest hotspots. Eck et
al. explain that this method ‘creates a smooth surface of the variation in the density
of point events across an area’.69 By clustering protests within a 5km bandwidth
or radius, it is possible to identify what could be termed ‘protest and public
violence’ hotspots. The blue, purple and red areas show the locations that have a
proportionally higher number of violent incidents. The blue areas have the highest Close to half of the
protests over jobs or
proportion of such incidents.
corruption took place in
Hotspot analysis of protest and crowd violence is helpful when looking at protest non-metro areas
locations over time. This trend analysis approach may be useful to determine likely
ISS paper 292 • MAY 2016 13PAPER
Figure 6: Gauteng spread of events by peaceful and violent classification, 2013 to 2015
Public protests
Peaceful (514)
Violent (470)
Clustering of
protests
(5km kernels)
None
Lowest
Highest
Source: Data from ISS’ Public Violence Monitoring project.
hotspots in the future. It may also be useful for either the random or the purposive
identification of locations for further qualitative research processes.
Events seem to follow a seasonal pattern, with the lowest number of incidents
recorded in December and January, with peaks around May each year. This
seasonality of such event types needs to be explored in further research.
Significant decreases in protest events were recorded for 2015. This was mainly
due to the notable decreases in Gauteng during 2015. One possibility is that
specific interventions to address community grievances were introduced at this
time. Gauteng Premier David Makhura ascribed this reduction to the launch of the
Ntirhisano community outreach programme using a ‘proactive and participatory
approach to problem-solving’. He claimed this was ‘restoring levels of trust and public
confidence on the ground … and improving the pace of service delivery … and making
government officials and service providers more accountable’.70 However, it is also
possible that, due to reporting fatigue, media coverage of public protests decreased
during this time. More in-depth research and analysis will need to be undertaken to
better explain this notable trend change.
14 At the heart of discontent: Measuring public violence in South AfricaFigure 7: Seasonality of incidents, 2013 to 2015
160 155
140
131 131 130
126
120
Number of incidents
100
80
55 57
60
40
20
0
Jan 2013
Mar 2013
May 2013
Jul 2013
Sep 2013
Nov 2013
Jan 2014
Mar 2014
May 2014
Jul 2014
Sep 2014
Nov 2014
Jan 2015
Mar 2015
May 2015
Jul 2015
Sep 2015
Nov 2015
Source: Data from ISS’ Public Violence Monitoring project.
Conclusion
Measuring public violence is complicated by the difficulty of developing a suitable
definition that adequately describes the phenomenon in all its various forms.
Moreover, the nature of public violence can shift or expand, with, for example, a
protest starting over inadequate housing but resulting in attacks on foreign-owned
shopkeepers. Research also shows that inappropriate actions by state and non-state
actors can escalate tensions and result in violence.71 Without an improvement in the
understanding of the extent, nature and dynamics of different forms of public violence,
it will be difficult to develop and implement effective strategies or responses that result
in sustainable reductions.
Certain steps can be taken to improve responses to the challenge of addressing
public violence in South Africa:
• Efforts should focus on collaboration and analysis by all role players to establish
a common understanding of the meaning of ‘violence’ during crowd events. This
process should include the development of a shared and objective definition of
‘violence’ during crowd events.
• A national information-gathering system should be established. It could be similar
to the peace monitor system that existed during the first years of democracy.
This emanated from the signing of the National Peace Accord72 and the Election
Monitoring Services73 once managed by the now defunct Institute for Democracy
in Africa.
ISS paper 292 • MAY 2016 15PAPER
• Further research is required to examine the inter-relatedness of various forms of
public violence and the triggers that can lead to these forms of violence. For example,
the triggers for xenophobic attacks need to be interrogated, as well as whether these
can be identified and addressed before their resulting in physical violence.
• Mechanisms for the notification of public marches or protests should be user friendly
and permission should be encouraged, unless rational and clear reasons for denial
are given and discussed. The research shows that the notification processes provide
an opportunity for organisers, municipalities and the police to open dialogue that
could minimise the occurrence of violence during public events.
The nature of public violence can shift or expand, with
a protest starting over inadequate housing but resulting
in attacks on foreign-owned shopkeepers
• The role of the SAPS, as well as of the metro or traffic police and private security,
in relation to managing incidents of public disorder needs to be the topic of further
research. This should include not only analysis of law enforcement’s capacity,
methods, actions and inactions but also an examination of the potential need for
improved command and control, as well as gaps in training and policy.
• Better monitoring of the period leading up to the 2016 local government elections
will allow the IEC to better identify hotspots and strengthen its dispute and conflict
resolution capacity in these areas. It will also capacitate other role players such as
the police and officials from the Department of Local Governance and Traditional
Affairs and local government to respond quickly and effectively to threats of
intimidation and violence. This may help to ensure that this phenomenon does not
threaten South Africa’s proud track record of free and fair elections.
16 At the heart of discontent: Measuring public violence in South AfricaNotes
1 Constitution of South Africa, 1996, section 17, states, ‘Everyone has the 26 WHO, Violence Prevention Alliance, The ecological model, 2015,
right, peacefully and unarmed, to assemble, to demonstrate, to picket and http://www.who.int/violenceprevention/approach/ecology/en/.
to present petitions.’
27 Ibid.
2 South Africa, Regulation of Gatherings Act (Act 205 of 1993).
28 Ibid.
3 Ibid.
29 A Zwi, R Garfield and A Loretti, Collective violence, in E Krug et al. (eds),
4 Ibid. World report on violence and health, Geneva: WHO, 2002, 220.
5 CH Heyns and K Stefiszyn (eds), Human rights, peace and justice in 30 B Bedasso, A dream deferred: the microfoundations of direct political
Africa: a reader, Pretoria: PULP, 2006. action in pre- and post democratization South Africa, Economic Research
Southern Africa (ERSA) Working Paper 483, 2014, 1, http://www.econrsa.
6 South African Police Service (SAPS), Annual performance plan: 2013/14
org/system/files/publications/working_papers/working_paper_483.pdf.
financial year, Pretoria: SAPS, 2014, 1; South African Local Government
Association (SALGA), SALGA deeply concerned about violent community 31 Ibid., 13.
protests, 6 May 2016, http://www.salga.org.za/NewsArticle/340. 32 C Twala, The causes and socio-political impact of the service delivery
7 E Krug et al., The way forward: recommendations for action, in E Krug protests to the South African citizenry: a real public discourse, J Soc Sci,
et al. (eds), World report on violence and health, Geneva: WHO (World 39:2, 2014, 159–167, 163.
Health Organization), 2002, www.who.int/violence_injury_ prevention/ 33 Gauteng Department of Cooperative Government and Traditional Affairs,
violence/world_report/en/full_en.pdf. Strategic Plan 2014–2019, 2015, 45, http://www.cogta.gpg.gov.za/
8 A Zwi, R Garfield and A Loretti, Collective violence, in E Krug et al. (eds), Pages/default.aspx.
World report on violence and health, Geneva: WHO, 2002, 240. 34 Z Hlatshwayo, Intabazwe – a portrait of a revolt, Freedom of Expression
9 SAPS, Crime definitions to be utilised by police officials for purposes of Institute, 2006, 11, quoted in South African Human Rights Commission
the opening of case dockets and the registration thereof on the crime (SAHRC), Report no. FS/2011/0009, 2012, http://www.sahrc.org.za/
administration system, Pretoria: SAPS, 2012, 18, http://www.saps.gov.za/ home/21/files/Report%20Comm%20%20SA%20Police%20Service%20
faqdetail.php?fid=9. 301012.pdf.
10 Ibid. 35 Examples provided by the researchers included placing minimum age
limits on groups and providing permission only if obscure routes are taken.
11 JLR Milton, South African criminal law and procedure volume ii: common- A Royeppen and J Duncan, Death by a thousand pinpricks: South Africa’s
law crimes (3rd ed.), Kenwyn: Juta, 1996, 89. ever-vanishing right to protest, Daily Maverick, 8 March 2013, http://www.
12 Ibid., 89. dailymaverick.co.za/article/2013-03-08-death-by-a-thousand-pinpricks-
south-africas-ever-vanishing-right-to-protest/#.VVmi5lpRfdk.
13 Ibid., 89.
36 Ibid.
14 Social Change Research Unit, University of Johannesburg, Community
protests 2004–2013: some research findings, Media Briefing, 12 February 37 Ibid.
2013, http://www.uj.ac.za/EN/Newsroom/News/Pages/UJ-researchers- 38 Centre for the Study of Violence and Reconciliation (CSVR) and Society,
release-service-delivery-protest-findings.aspx. Work and Development Institute (SWOP), The smoke that calls: insurgent
15 Social Change Research Unit, University of Johannesburg, South African citizenship, collective violence and the struggle for a place in the new
Police Service (SAPS) data on crown incidents: a preliminary analysis, South Africa. Eight case studies of community protest and xenophobic
May 2015, http://www.uj.ac.za/EN/Newsroom/News/Documents/2015/ violence, Johannesburg: CSVR, 2011, 13.
South%20African%20Police%20Service%20Data%20on%20Crowd%20 39 Ibid., 11.
Incidents%20Report.pdf.
40 Ibid., 11.
16 H Jain and J Karamoko, Community protests in South Africa: trends,
41 Ibid., 11.
analysis and explanations, South African Jewish Report (SAJR), 2011, 10,
http://www.sajr.co.za/docs/default-source/default-document-library/14- 42 Ibid., 11.
community-protests.pdf?sfvrsn=2.
43 Z Hlatshwayo, Intabazwe – a portrait of a revolt, Freedom of Expression
17 Ibid. Institute, 2006, 11, quoted in SAHRC, Report no. FS/2011/0009, 2012,
http://www.sahrc.org.za/home/21/files/Report%20Comm%20%20SA%
18 SAPS, Annual report: 2014/15 financial year, Pretoria: SAPS, 2014, 182.
20Police%20Service%20301012.pdf.
19 Social Change Research Unit, University of Johannesburg, South African
44 Ibid.
Police Service (SAPS) data on crown incidents: a preliminary analysis, May
2015, 19, http://www.uj.ac.za/EN/Newsroom/News/Documents/2015/ 45 S Tait and M Marks, When you strike a gathering you strike a rock: current
South%20African%20Police%20Service%20Data%20on%20Crowd%20 debates in the policing of public order in South Africa, South African
Incidents%20Report.pdf. Crime Quarterly, 38, 2011, 22.
20 Ibid. 46 CSVR and SWOP, The smoke that calls: insurgent citizenship, collective
violence and the struggle for a place in the new South Africa. Eight case
21 Ibid.
studies of community protest and xenophobic violence, Johannesburg:
22 Ibid. CSVR, 2011, 131.
23 Ibid. 47 Ibid., 131.
24 SAPS, Annual report: 2014/15 financial year, SAPS: Pretoria, 2014, 182. 48 SAPS, Annual report: 2013/14 financial year, Pretoria: SAPS, 2014, 181.
25 Ibid., 143. 49 Ibid., 181–182.
ISS paper 292 • MAY 2016 17PAPER
50 CSVR and SWOP, The smoke that calls: insurgent citizenship, collective 72 For more information, see O’Malley The Heart of Hope, The National
violence and the struggle for a place in the new South Africa. Eight case Peace Accord and its structures, https://www.nelsonmandela.org/
studies of community protest and xenophobic violence, Johannesburg: omalley/index.php/site/q/03lv02424/04lv03275/05lv03294/06lv03321.
CSVR, 2011, 131. htm
51 Municipal IQ, Gauteng and national service delivery protest figures fall, 73 For more information see Institute for Democracy in Africa, Managing
Press Release, 23 February 2016, http://www.municipaliq.co.za/index. conflict in elections, 25 March 2009, https://idasa.wordpress.com/
php?site_page=press.php. 2009/03/25/managing-conflict
52 Ibid.; Municipal IQ, Briefing 608: Final protest tally for 2015; off 2014
record, 12 January 2016.
53 University of Johannesburg, UJ researchers release service delivery
protests findings, 13 February 2014, http://www.uj.ac.za/newandevents/
Pages/UJ-researchers-release-service-delivery-protest-findings.
aspx; YouTube, Media briefing: community protests, University of
Johannesburg, https://www.youtube.com/watch?feature=player_
embedded&v=XqwBSNBMPCU
54 DM Powell, M O’Donovan and J de Visser, Civic protests barometer
2007–2014, Cape Town: Multilevel Government Initiative (MLGI), 2014,
http://mlgi.org.za/talking-good-governance/20150219%20Civic%20
Protest%20Barometer%20Published%20%20DP.pdf.
55 Ibid.
56 Ibid., 3. The report does not provide exact numbers for these years, which
need to be derived from the graphs.
57 Ibid.
58 A Nyar and C Wray, Understanding protest action: some data collection
challenges for South Africa, Transformation: Critical Perspectives on
Southern Africa, 80, 2012, 22–43.
59 J Duncan, Are South Africa’s protests really driven by rising expectations?,
South African Civil Society Information Service, 6 October 2014,
http://sacsis.org.za/site/article/2156
60 Armed Conflict Location & Event Data Project, http://www.acleddata.com.
61 The technical notes are being finalised.
62 J Duncan, Are South Africa’s protests really driven by rising expectations?,
South African Civil Society Information Service, 6 October 2014,
http://sacsis.org.za/site/article/2156
63 A Nyar and C Wray, Understanding protest action: some data collection
challenges for South Africa, Transformation: Critical Perspectives on
Southern Africa, 80, 2012, 22–43.
64 H Jain and J Karamoko, Community protests in South Africa: trends,
analysis and explanations, SAJR, 2011, 10, http://mlgi.org.za/
publications/publications-by-theme/local-government-in-south-africa/
community-protests/Community_Protests_SA.pdf/view.
65 See http://www.issafrica.org/crimehub/public-violence
66 The metro areas are the cities of Johannesburg, Cape Town, Tshwane
(Pretoria), Ekhuruleni (East Rand), eThekwini (Durban) and Nelson
Mandela Bay Metro (Port Elizabeth).
67 J Eck et al., Mapping crime: understanding hotspots, Washington DC:
National Institute of Justice, 2005, 2.
68 Ibid., 26.
69 Ibid., 26.
70 South African Government, Premier David Makhura: Gauteng 2016 state
of the province address, 22 February 2016, http://www.gov.za/speeches/
premier-david-makhura-gauteng-state-prov-state-province-address-
2016-22-feb-2016-0000.
71 CSWR and SWOP, The smoke that calls: insurgent citizenship, collective
violence and the struggle for a place in the new South Africa. Eight case
studies of community protest and xenophobic violence, Johannesburg:
CSVR, 2011.
18 At the heart of discontent: Measuring public violence in South AfricaYou can also read