ATM Role in Intermodal Transport: Opportunities for Innovative Intermodal Concepts and Passenger Information Services - Nommon
←
→
Page content transcription
If your browser does not render page correctly, please read the page content below
EXPLORATORY RESEARCH

ATM Role in Intermodal
Transport: Opportunities
for Innovative Intermodal
Concepts and Passenger
Information Services
Deliverable ID:           D2.1
Dissemination Level:      PU
Project Acronym:          TRANSIT
Grant:                    893209
Call:                     H2020-SESAR-2019-2
Topic:                    SESAR-ER4-10-2019
Consortium coordinator:   Nommon
Edition date:             26 March 2021
Edition:                  01.00.00
Template Edition:         02.00.02
D2.1 - ATM ROLE IN INTERMODAL TRANSPORT: OPPORTUNITIES FOR
INNOVATIVE INTERMODAL CONCEPTS AND PASSENGER
INFORMATION SERVICES

Authoring & Approval

Authors of the document
Name/Beneficiary                    Position/Title                             Date
Daniel Delahaye (ENAC)              WP2 Leader                                 26/03/2021
Eric Feron (ENAC)                   Project Team                               26/03/2021
Geoffrey Scozzaro (ENAC)            Project Team                               26/03/2021
Clara Buire (ENAC)                  Project Team                               26/03/2021
Clarissa Livingston (ETH)           Project Team                               26/03/2021
Alex Gregg (Nommon)                 Project Team                               26/03/2021

Reviewers internal to the project
Name/Beneficiary                    Position/Title                             Date
Georges Mykoniatis (ENAC)           Project Team                               26/03/2021
Javier Burrieza (Nommon)            Project Team                               26/03/2021
Alex Gregg (Nommon)                 Project Team                               26/03/2021
Ricardo Herranz (Nommon)            Project Team                               26/03/2021

Approved for submission to the SJU By — Representatives of beneficiaries involved in the project
Name/Beneficiary                    Position/Title                             Date
Daniel Delahaye (ENAC)              WP2 Leader                                 26/03/2021
Rubén Alcolea (Nommon)              Project Coordinator                        26/03/2021

Rejected By - Representatives of beneficiaries involved in the project
Name/Beneficiary                    Position/Title                             Date
-                                   -                                          -

Document History
Edition              Date               Status               Author                Justification
00.00.01             09/10/2020         Draft                Daniel Delahaye       Initial draft
00.01.00             23/12/2020         Submitted to the SJU Daniel Delahaye       Internal review before
                                        for approval                               submission to the SJU
01.00.00             26/03/2021         Review after SESAR   Daniel Delahaye       Internal review before
                                        feedback                                   new submission

                                                                                                            2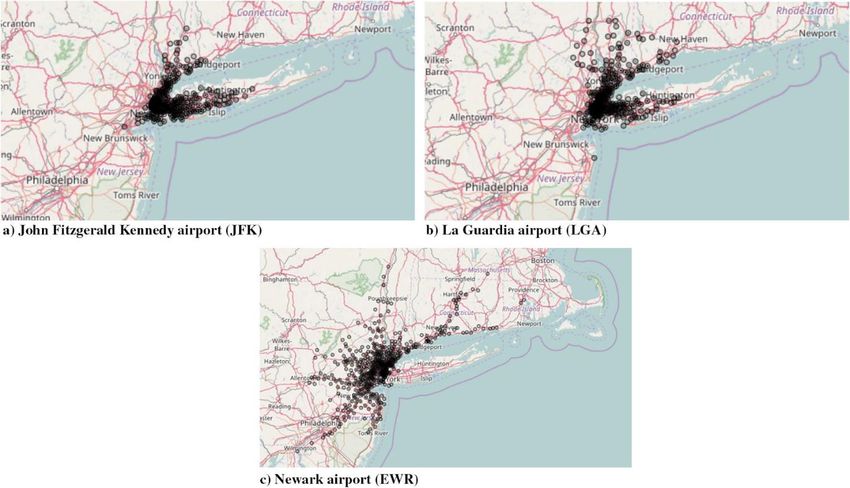
D2.1 - ATM ROLE IN INTERMODAL TRANSPORT: OPPORTUNITIES FOR
INNOVATIVE INTERMODAL CONCEPTS AND PASSENGER
INFORMATION SERVICES

Copyright Statement
© 2020 TRANSIT Consortium.
All rights reserved. Licensed to the SESAR Joint Undertaking under conditions.

                                                                                 3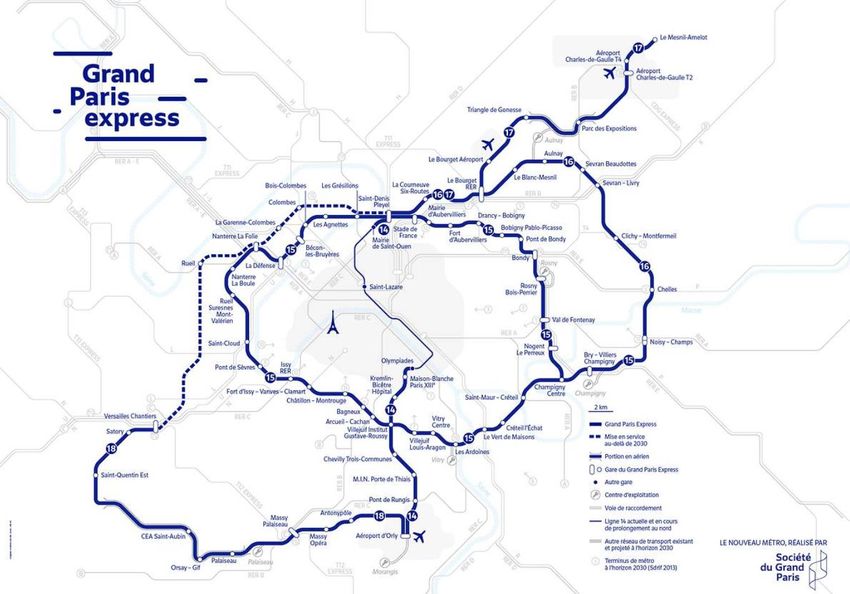
D2.1 - ATM ROLE IN INTERMODAL TRANSPORT: OPPORTUNITIES FOR
INNOVATIVE INTERMODAL CONCEPTS AND PASSENGER
INFORMATION SERVICES

TRANSIT
TRAVEL INFORMATION MANAGEMENT FOR SEAMLESS INTERMODAL
TRANSPORT

This report is part of a project that has received funding from the SESAR Joint Undertaking under grant
agreement No 893209 under European Union’s Horizon 2020 research and innovation programme.

Abstract
This document presents a series of innovative intermodal concepts based on information sharing
between air transport and other transport modes. The document starts with an analysis of the current
policy context and intermodality trends. It then defines several coordination mechanisms between the
ATM system and ground transport modes, as well as different innovative passenger information
services. A literature review on the modelling of intermodal solutions and information services in then
included, in order to discuss how the new proposed concepts could be modelled. Finally, it presents
the specification of the TRANSIT case studies, which will be developed in the subsequent work
packages.

                                                                                                      4
D2.1 - ATM ROLE IN INTERMODAL TRANSPORT: OPPORTUNITIES FOR
INNOVATIVE INTERMODAL CONCEPTS AND PASSENGER
INFORMATION SERVICES

Table of Contents
    Abstract ................................................................................................................................... 4

1      Introduction ............................................................................................................. 11
    1.1        Scope and objectives ................................................................................................... 11
    1.2        List of acronyms .......................................................................................................... 12

2      Analysis of policy context and intermodality trends .................................................. 14
    2.1        Factors that may influence the evolution of intermodal transport in Europe ................. 14
       2.1.1      Growing demand for travel ............................................................................................................. 14
       2.1.2      Green wave ..................................................................................................................................... 15
       2.1.3      Data accessibility ............................................................................................................................. 17
       2.1.4      COVID-19 pandemic ........................................................................................................................ 17
    2.2        Evolution of intermodal transport in Europe ................................................................ 18
       2.2.1      Authorities’ investment in transportation ...................................................................................... 18
       2.2.2      Opening of competition .................................................................................................................. 20
       2.2.3      Feeder flights removal .................................................................................................................... 20
    2.3        Emerging technologies ................................................................................................. 21
       2.3.1      Data release .................................................................................................................................... 21
       2.3.2      Technological advances................................................................................................................... 21
       2.3.3      Mobility-as-a-Service ....................................................................................................................... 22
    2.4        Societal attitudes towards long-distance travel ............................................................ 23
       2.4.1      The importance of the value of time ............................................................................................... 23
       2.4.2      Social attitudes ................................................................................................................................ 23

3 Definition of coordination mechanisms between the ATM system and ground
transport modes ............................................................................................................. 24
    3.1        Definition of coordination mechanisms at strategic level .............................................. 24
       3.1.1      Long-distance coordination mechanisms at strategic level ............................................................ 25
       3.1.2      Short-distance coordination mechanisms at strategic level ........................................................... 30
       3.1.3      A more futuristic view ..................................................................................................................... 34
    3.2        Definition of coordination mechanisms at tactical level ................................................ 35
       3.2.1      Long-distance coordination mechanisms at tactical level .............................................................. 35
       3.2.2      Short-distance coordination mechanisms at tactical level ............................................................. 45

4      Definition of innovative passenger information services ........................................... 48
    4.1        Passenger services provided at the strategic level......................................................... 48
       4.1.1      Long-distance passenger services ................................................................................................... 48
       4.1.2      Short-distance passenger services .................................................................................................. 49
    4.2        Passenger services provided at tactical level................................................................. 51
       4.2.1      Long-distance services .................................................................................................................... 51
       4.2.2      Short-distance services ................................................................................................................... 56

                                                                                                                                                                    5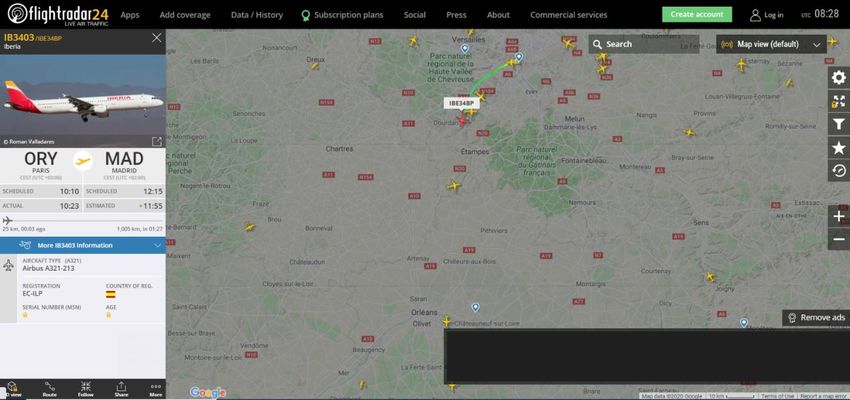
D2.1 - ATM ROLE IN INTERMODAL TRANSPORT: OPPORTUNITIES FOR
INNOVATIVE INTERMODAL CONCEPTS AND PASSENGER
INFORMATION SERVICES

5      Modelling of intermodal solutions and information services ..................................... 58
    5.1        Literature review on the modelling of intermodal transportation ................................. 59
       5.1.1      Strategic planning............................................................................................................................ 59
       5.1.2      Tactical planning.............................................................................................................................. 59
       5.1.3      Operational planning....................................................................................................................... 60
    5.2        Intermodal network graphs - multiplex networks ......................................................... 60
    5.3        Intermodal routing algorithms ..................................................................................... 61
    5.4        Literature review on the modelling of passenger information services .......................... 62
       5.4.1      Passenger information services - generalised categorisation ......................................................... 63
    5.5        Modelling passenger information services and corresponding passenger reactions ....... 64
       5.5.1      Pre-trip information for “foreseeable” conditions .......................................................................... 64
       5.5.2      En-route Information for “unforeseeable” conditions .................................................................... 65
       5.5.3      Modelling decisions triggered by en-route information services ................................................... 65
       5.5.4      Representing en-route information services in agent-based models ............................................. 66
       5.5.5      Reoccurring vs Unexpected Events ................................................................................................. 67
       5.5.6      Modelling decisions based upon reliability ..................................................................................... 67
    5.6        Summary and conclusions ............................................................................................ 68

6      Specification of case studies ..................................................................................... 70
    6.1        Case study selection .................................................................................................... 70
    6.2        Available data ............................................................................................................. 69
       6.2.1      Data sources – Madrid/Spain .......................................................................................................... 69
       6.2.2      Source of data – Paris/France ......................................................................................................... 70
    6.3        Integrated ticketing and schedule coordination scheme ............................................... 72
       6.3.1      Motivation ....................................................................................................................................... 72
       6.3.2      Link with the proposed innovative intermodal concepts ................................................................ 72
       6.3.3      Research questions ......................................................................................................................... 72
       6.3.4      Scenarios ......................................................................................................................................... 73
       6.3.5      KPIs .................................................................................................................................................. 74
    6.4        Disruption response plan ............................................................................................. 75
       6.4.1      Motivation ....................................................................................................................................... 75
       6.4.2      Link with innovative the proposed intermodal concepts ................................................................ 75
       6.4.3      Research questions ......................................................................................................................... 75
       6.4.4      Scenarios ......................................................................................................................................... 77
       6.4.5      KPIs .................................................................................................................................................. 78

7      References ............................................................................................................... 80
Appendix I: 1st Stakeholder Workshop ............................................................................. 85
    Project description, workshop objectives and approach .......................................................... 86
    Case study 1: Disruption Management .................................................................................... 86
       Levers & barriers of the concept .................................................................................................................. 87

                                                                                                                                                                          6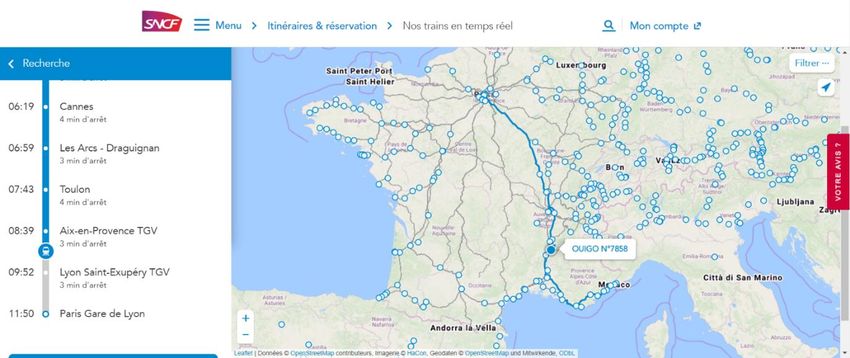
D2.1 - ATM ROLE IN INTERMODAL TRANSPORT: OPPORTUNITIES FOR
INNOVATIVE INTERMODAL CONCEPTS AND PASSENGER
INFORMATION SERVICES

     Relevance of new intermodal concepts ....................................................................................................... 87
     Stakeholders involved - benefits and drawbacks for them .......................................................................... 88
     Previous experiences .................................................................................................................................... 88
  Case study 2: Integrated ticketing and timetable synchronisation ............................................ 89
     Levers & barriers of the concept .................................................................................................................. 89
     Relevance of new intermodal concepts ....................................................................................................... 90
     Stakeholders involved - benefits and drawbacks for them .......................................................................... 90
     Previous experiences .................................................................................................................................... 90
  Indicators ............................................................................................................................... 91

                                                                                                                                                               7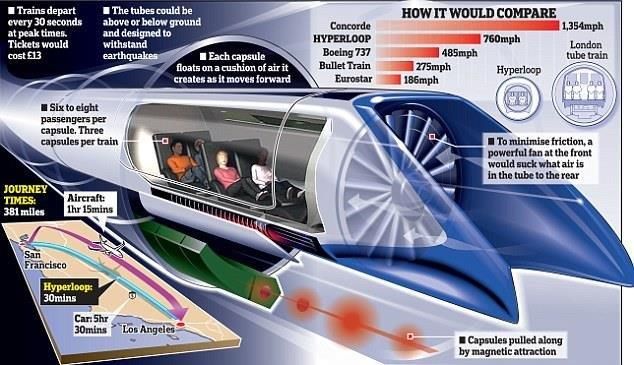
D2.1 - ATM ROLE IN INTERMODAL TRANSPORT: OPPORTUNITIES FOR
INNOVATIVE INTERMODAL CONCEPTS AND PASSENGER
INFORMATION SERVICES

List of figures
Figure 1 - Passenger-Kilometres Performed Total Scheduled Traffic, 2009-2018. Source: ICAO ......... 15
Figure 2 - CO2 emission by sector from 1990 to 2018. Source: IEA ...................................................... 16
Figure 3 - Greenhouse gas emission by transportation means. Source: European Environment Agency
(EEA) ...................................................................................................................................................... 16
Figure 4 - Evolution of the passenger traffic evolution in the world. Source: ICAO Air Transport
Reporting Form A and A-S plus ICAO estimates .................................................................................... 17
Figure 5 - Global scheduled flights change 2020-over-2019. Source: OAG schedules analyser. .......... 18
Figure 6 - Grand Paris Express Project. Source: Société du Grand Paris. .............................................. 19
Figure 7 - Aircraft C919 of COMAC ........................................................................................................ 20
Figure 8 - The Hyperloop project of encapsulated transportation of humans (Source:
http://www.dailymail.co.uk/sciencetech/article-2912170/LA-San-Francisco-half-hour-moves- closer-
Elon-Musk-reveals-plans-Hyperloop-test-track-Texas.html) ................................................................ 22
Figure 9 – Coordination mechanisms at strategic level ........................................................................ 24
Figure 10 - Ground connectivity of the three major New-York airports. The connectivity of Newark
airport (EWN) goes farther than that of John Fitzgerald Kennedy airport (JFK) or La Guardia airport
(LGA), due in part to its excellent connectivity to the rail system. Note, however, that EWN hardly
serves any Long Island resident, thus indicating a strong geographical partitioning of airport clientele.
European airports such as Frankfurt (FRA) or Charles de Gaulle (CDG) are expected to follow the same
patterns. (Source: [4]) ........................................................................................................................... 26
Figure 11 - Gate assignment for passengers connecting with ground transportation system (Source:
[7]) ......................................................................................................................................................... 27
Figure 12 - Timetable synchronisation between several transportation modes minimises slack time
between transportation modalities and optimises robustness against modal and transfer time
disruptions. ............................................................................................................................................ 28
Figure 13 - Urban subnetworks (road, train, subway, bikeway, etc.) ................................................... 30
Figure 14 - Door-to-door travel time decomposition (Source: [18]) ..................................................... 32
Figure 15 - Example of the distribution of two connection times initially scheduled for 70 min. ........ 32
Figure 16 - Illustration of a transportation network at regional scale (
D2.1 - ATM ROLE IN INTERMODAL TRANSPORT: OPPORTUNITIES FOR
INNOVATIVE INTERMODAL CONCEPTS AND PASSENGER
INFORMATION SERVICES
linked to this flight such as the scheduled departure and arrival time, the actual departure and the
estimated arrival time. .......................................................................................................................... 43
Figure 25 - Outbound and Inbound Traffic Queues from a Flight Phase Perspective. (Source:
https://ansperformance.eu/methodology/additional-asma-time-pi) .................................................. 44
Figure 26 - Urban transportation network ............................................................................................ 46
Figure 27 - Regional transportation network ........................................................................................ 47
Figure 28 - Description of passenger service rerouting in case of an expected disruptive event ........ 49
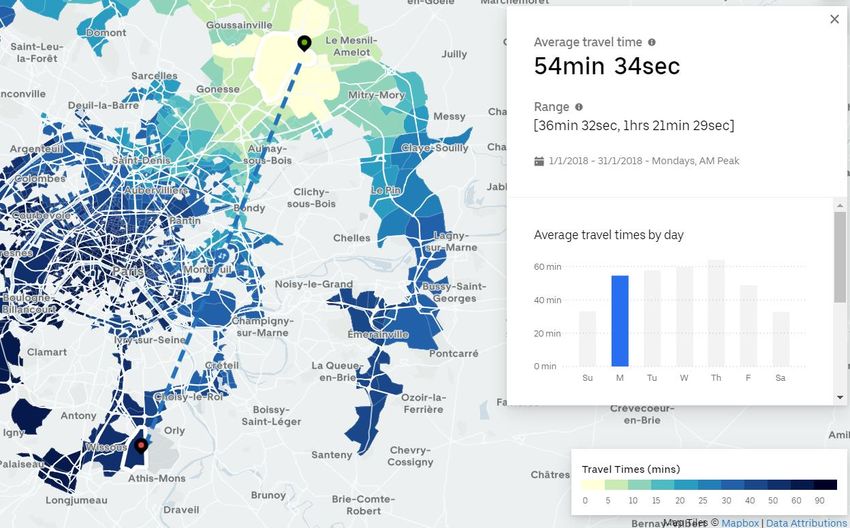
Figure 29 - Average connection estimation between CDG and ORLY airports operated by car on
Mondays during AM peak (Source: Uber Data) .................................................................................... 50
Figure 30 - Illustration of passenger services using DMAN/AMAN optimisation ................................. 52
Figure 31 - Passenger information services at security checkpoints .................................................... 52
Figure 32 - Mode-sharing rerouting option (green) for a delayed passenger ...................................... 53
Figure 33 - In this figure flights targeted to land at airport 1 (red arrows) are resigned to airport 2 in
city B (green arrows). This situation happened in 1999 between Paris-CDG (city A) and Brussel (city B),
for which CDG had to close due to a storm. ......................................................................................... 54
Figure 34 - Information services for connection time estimation after a gate reassignment .............. 55
Figure 35 - Disruption on the air transportation subnetwork between Paris and Toulouse ................ 57
9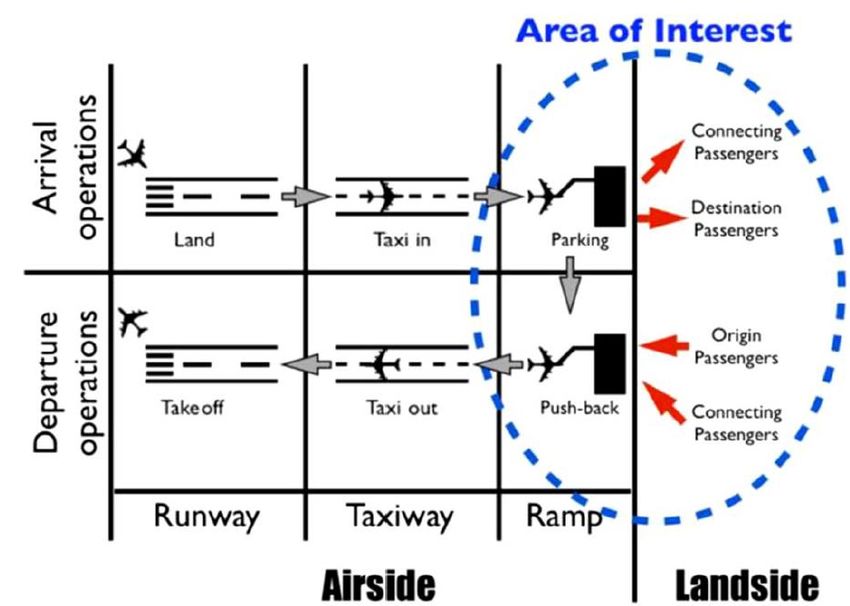
D2.1 - ATM ROLE IN INTERMODAL TRANSPORT: OPPORTUNITIES FOR
INNOVATIVE INTERMODAL CONCEPTS AND PASSENGER
INFORMATION SERVICES

List of tables
Table 1 - List of acronyms ...................................................................................................................... 13
Table 2 - Identification of origin-destination demand problem............................................................ 26
Table 3 - Gate assignment optimisation problem ................................................................................. 27
Table 4 - The aircraft/train timetable synchronisation optimisation problem ..................................... 29
Table 5 - Actual travel time estimation optimisation problem ............................................................. 29
Table 6 - Robust urban assignment optimisation problem ................................................................... 31
Table 7 - Urban public transport frequencies optimisation problem ................................................... 31
Table 8 - Robustness in transfer/connection time estimation problem ............................................... 33
Table 9 - Resilient regional transport network optimisation problem ................................................. 34
Table 10 - Mode share allocation optimisation problem ...................................................................... 34
Table 11 - DMAN/AMAN optimisation problem ................................................................................... 36
Table 12 - Security checkpoints processing time estimation problem ................................................. 37
Table 13 - PIF/PAF staff optimisation and guidance service ................................................................. 37
Table 14 - Passenger rebooking to other transport modes problem optimisation .............................. 38
Table 15 - Airport reassignment optimisation problem ........................................................................ 39
Table 16 - Gate allocation optimisation problem ................................................................................. 40
Table 17 – Dynamic access and egress travel times estimation optimisation problem ....................... 42
Table 18 - Frequencies and scheduling optimisation problem ............................................................. 43
Table 19 - Airport rerouting (in case of a disruption) optimisation problem ....................................... 44
Table 20 – Dynamic flight time estimation optimisation problem ....................................................... 45
Table 21 - Dynamic traffic assignment problem at urban scale optimisation problem ........................ 46
Table 22 - Dynamic traffic assignment at regional scale optimisation problem ................................... 47
Table 23 - Connection time at regional scale optimisation problem .................................................... 47
Table 24 – Data sources available for Madrid/Spain analyses .............................................................. 69
Table 25 – Data sources available for Paris/France analyses ................................................................ 70
Table 26 – Links between the integrated ticketing case study and the proposed concepts ................ 72
Table 27 – KPIs from TRANSIT performance assessment framework applicable to the integrated
ticketing case study ............................................................................................................................... 74
Table 28 – Links between the disruption response case study and the intermodal concepts and
solutions proposed ................................................................................................................................ 75
Table 29 – KPIs from TRANSIT performance assessment framework applicable to the disruption
response case study .............................................................................................................................. 79

                                                                                                                                                    10
D2.1 - ATM ROLE IN INTERMODAL TRANSPORT: OPPORTUNITIES FOR
INNOVATIVE INTERMODAL CONCEPTS AND PASSENGER
INFORMATION SERVICES
1 Introduction
1.1 Scope and objectives
The objectives of the TRANSIT project are the following:
1. Propose innovative intermodal transport solutions based on information sharing and
coordinated decision-making between air transport and other transport modes.
2. Develop multimodal KPIs to evaluate the quality and efficiency of the door-to-door passenger
journey.
3. Investigate new methods and algorithms for mobility data collection, fusion and analysis
allowing a detailed reconstruction of the different stages of long-distance multimodal trips and
the measurement of the new multimodal KPIs.
4. Develop a modelling and simulation framework for the analysis of long-distance travel behaviour
that allows a comprehensive assessment of intermodal solutions in terms of the proposed
multimodal KPIs.
5. Assess the expected impact of the proposed intermodal concepts and derive guidelines and
recommendations for their practical development and implementation.
Specifically, this document aims to:
• propose a set of new intermodal concepts;
• review the modelling of intermodal solutions and information services;
• propose a set of case studies to test these new intermodal concepts
The document is structured as follows:
• Section 2 analyses the current policy context and intermodality trends.
• Section 3 proposes a set of advanced coordination mechanisms based on information sharing
between the ATM systems and grounds transport modes.
• Section 4 defines a set of innovative passenger information services.
• Section 5 discusses the modelling of intermodal solutions and information services.
• Section 6 specifies the case studies that will be run to test these new intermodal concepts in the
two evaluation scenarios foreseen by the project: Madrid-Spain and Paris-France.
• Appendix I: 1st Stakeholder Workshop summarises the discussion and results of the first TRANSIT
stakeholder workshop, which took place on the 11th of November 2020 and whose conclusions
were used as an input for the preparation of this deliverable.
11D2.1 - ATM ROLE IN INTERMODAL TRANSPORT: OPPORTUNITIES FOR
INNOVATIVE INTERMODAL CONCEPTS AND PASSENGER
INFORMATION SERVICES
1.2 List of acronyms
Acronym Definition
ACO Ant Colony Optimisation
ADS-B Automatic Dependent Surveillance–Broadcast
AMAN Arrival Manager
ANS Air Navigation Services
ANR Access-Node Routing
ARES Airspace Reservation/Restriction
ATC Air Traffic Control
ATFM Air Traffic Flow Management
ATM Air Traffic Management
CDG Charles de Gaulle Airport
CDM Collaborative Decision Making
COMAC Commercial Aircraft Corporation of China
DFA Deterministic Finite Automaton
DMAN Departure Manager
D2D Door to Door
D2K Door to Kerb
EC European Commission
EW Newark Airport
FNDP Feeder Bus Network Design Problem
GAs Genetic Algorithms
FRA Frankfurt Airport
JFK Fitzgerald Kennedy Airport
LGA La Guardia Airport
ICAO International Civil Aviation Organisation
IoT Internet of Things
K2G Kerb to Gate
KPA Key Performance Areas
KPI Key Performance Indicators
NM Network Manager
SA Simulated Annealing
SDALT State Dependent ALT
SES Single European Sky
SESAR Single European Sky ATM Research
SFO San Francisco Airport
12D2.1 - ATM ROLE IN INTERMODAL TRANSPORT: OPPORTUNITIES FOR
INNOVATIVE INTERMODAL CONCEPTS AND PASSENGER
INFORMATION SERVICES
Acronym Definition
TS Tabu Search
WCA Water Cycle Algorithm
Table 1 - List of acronyms
13D2.1 - ATM ROLE IN INTERMODAL TRANSPORT: OPPORTUNITIES FOR
INNOVATIVE INTERMODAL CONCEPTS AND PASSENGER
INFORMATION SERVICES
2 Analysis of policy context and
intermodality trends
Long-distance journeys within Europe relies on air transportation system. Nevertheless, air trips are in
practice impossible without multimodality. Multimodality could be defined as “the movement of
passengers from door-to-door using a combination of different transport modes”. Indeed, reaching or
leaving the airport is made by the use of cars, trains or public transports. In this context, we can
introduce intermodality such as “the coordinated use of more than one transport mode in one trip”.
Therefore, experiencing a seamless trip depends on a smooth and coordinated use of several
transportation modes. This stems from information sharing between passengers and transportation
actors but also between actors themselves in order to provide passengers with a consistent service. In
the next years, passengers could expect to travel faster, safer and greener. The information availability
for passengers and coordination mechanisms between transport modes will be essential to deal with
passengers’ expectations, environmental issues and economic challenges.
This section introduces an analysis of the ATM policy context and the intermodality trends and
provides and insight on the evolution of the intermodal transport in Europe as a whole, the key factors
driving its implementation, as well as the emerging technologies that are enabling and facilitating the
widespread use of multiple modes for door-to-door long-distance trips.
2.1 Factors that may influence the evolution of intermodal transport
in Europe
2.1.1 Growing demand for travel
The growing trend of demand for travel over the last years lets foresee a saturation in transportation
capacity (Figure 1). According to some studies, the demand in air transportation in 2040 may lead to a
surplus of 1.5 million flights which could not be accommodated [1]. This congestion will lead to more
delays and pressure on the transportation network.
14D2.1 - ATM ROLE IN INTERMODAL TRANSPORT: OPPORTUNITIES FOR
INNOVATIVE INTERMODAL CONCEPTS AND PASSENGER
INFORMATION SERVICES
Figure 1 - Passenger-Kilometres Performed Total Scheduled Traffic, 2009-2018. Source: ICAO
In order to absorb this growing demand, transportation operators will have to adapt their offer to
serve all passengers. However, increasing the capacity means facing safety and environmental issues
that cannot be ignored.
2.1.2 Green wave
Environmental issues are one of the biggest challenges of the 21st century, and transport represents
the second source of CO2 emissions (Figure 2).
15D2.1 - ATM ROLE IN INTERMODAL TRANSPORT: OPPORTUNITIES FOR
INNOVATIVE INTERMODAL CONCEPTS AND PASSENGER
INFORMATION SERVICES
Figure 2 - CO2 emission by sector from 1990 to 2018. Source: IEA
Within the transportation system, road transport (personal and freight vehicles) is the main
greenhouse gas producer, followed by air and maritime transport. More and more, people get
concerned about environmental issues. Alternative green transportation services have increased all
over Europe through the emergence of carpooling apps, electric scooters, bicycle sharing systems or
the construction of clean public transportation lanes in big cities. People start to shift from their
unimodal transportation operated by their personal vehicle to “greener” multimodal transportation
and therefore reduce traffic congestion. This trend is growing in urban mobility, but the aviation
system is also affected by the green wave.
Figure 3 - Greenhouse gas emission by transportation means. Source: European Environment Agency (EEA)
16D2.1 - ATM ROLE IN INTERMODAL TRANSPORT: OPPORTUNITIES FOR INNOVATIVE INTERMODAL CONCEPTS AND PASSENGER INFORMATION SERVICES As an example, the anti-flying #Flygskam movement (“flight shame”), which started in Sweden in 2018, has had a deep impact on the Swedish Air Traffic. The idea was to encourage people to stop taking flights in order to lower carbon emission. This movement resulted in a reduction of domestic flights and in an increase of rail travel inside the country. In addition to people’s initiatives, governments tend to reduce transportation emissions by encouraging people to take the train for short distances (
D2.1 - ATM ROLE IN INTERMODAL TRANSPORT: OPPORTUNITIES FOR
INNOVATIVE INTERMODAL CONCEPTS AND PASSENGER
INFORMATION SERVICES
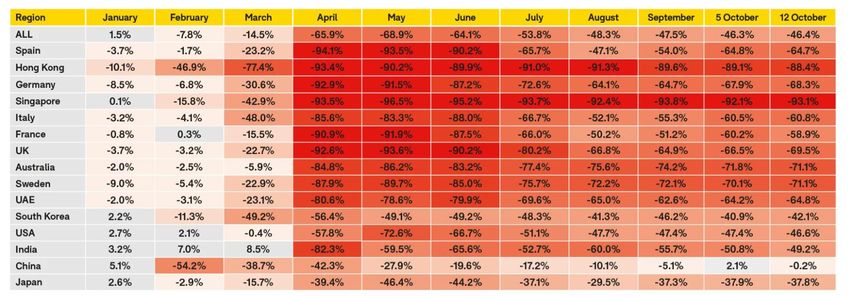
The drop in passenger traffic illustrated in Figure 4 brings about economic challenges for airlines, which
directly suffer from the closure of borders, but will also have to face the looming economic crisis. The
decrease of household purchasing power, the spending reduction of companies and the generalisation
of teleworking may significantly reduce and change air travel demand. Indeed, business class, which
represents up to a third of airlines revenues for only 10% of passengers, may be seriously affected by
the spreading of teleworking and the budgetary restrictions of companies. Some airlines such as Virgin
Atlantic or Thai Airways are now facing bankruptcy and debt restructuring. The COVID-19 crisis may
lead to a global restructuring of the air transportation system with disappearing or buyout of weakest
airlines, workforce reduction and government support plans (nationalisation, bailouts, etc..).
Moreover, airports and airlines must adapt their operations in order to reduce the risk of
contamination: measures such as mandatory PCR tests before take-off, social distancing and cleaning
and disinfecting may significantly increase the processing time at the airport. Even in the case of air
travel demand going back to its previous level (which is already the case in China, as presented in
Figure 5), these additional constraints will affect the flow capacity at airports and aircraft.
Finally, the COVID-19 worldwide fast spreading highlights the role of aviation in virus propagation. Hub
airports are crossing places for thousands of people where the risk of contamination is high.
Consequently, we may see people who avoid these areas by switching from hub-and-spoke to a more
“point-to-point” scheme.
Figure 5 - Global scheduled flights change 2020-over-2019. Source: OAG schedules analyser.
2.2 Evolution of intermodal transport in Europe
2.2.1 Authorities’ investment in transportation
The European long-term vision for aviation described in the report “Flightpath 2050- Europe’s vision
for aviation” [2] is to maintain a global leadership and meet societal and market needs while protecting
the environment. “In 2050, passenger experience is paramount”. Such a new trend stresses the
growing awareness of the importance of passenger experience inside the transportation system. One
of the main objectives is defined as follows: “90% of travellers within Europe are able to complete their
18D2.1 - ATM ROLE IN INTERMODAL TRANSPORT: OPPORTUNITIES FOR
INNOVATIVE INTERMODAL CONCEPTS AND PASSENGER
INFORMATION SERVICES
journey, door-to-door within 4 hours. Passengers and freight are able to transfer seamlessly between
transport modes to reach the final destination smoothly, predictably and on-time”. In this context,
Europe heads for a resilient, seamless and efficient intermodal system with high-speed communication
to ensure passengers a continuous journey.
Some projects are currently running to improve the transportation supply. For example, the Grand
Paris Express project presented in Figure 6 aims to increase the accessibility of the centre while
reducing pollution and traffic jam. The future network will connect peripheral municipalities to
business centres but also to airports and train stations.
Figure 6 - Grand Paris Express Project. Source: Société du Grand Paris.
Moreover, government, encourage more and more people to use ‘soft’ transportation modes: cycling,
walking, roller-skating etc… in order to reduce congestion and pollution. Cities invest in this new
mobility by building “green lane” for buses and bicycles in order to encourage people to be more
‘multimodal’ and drop their car.
19D2.1 - ATM ROLE IN INTERMODAL TRANSPORT: OPPORTUNITIES FOR
INNOVATIVE INTERMODAL CONCEPTS AND PASSENGER
INFORMATION SERVICES
2.2.2 Opening of competition
The opening of competition among operators could significantly improve passengers’ intermodal
experience. Indeed, historical operators might lose their total control of the supply and therefore will
have to improve their customer-oriented services in order to keep attracting passengers. For example,
in France, people are reluctant to take the train because of its weak reliability. Fair competition may
encourage companies to offer passengers the best transportation service and to build a trust
relationship between them. Moreover, competition induce a price drop and therefore in the end,
multimodality could be more attractive than using its personal vehicle.
Competition might also appear in next years in the air sector with the emergence of COMAC
(Commercial Aircraft Corporation of China), which is likely to have a strong impact on air transportation
in Europe. Indeed, this new manufacturer is willing to sell in Europe a medium range aircraft called
C919 (Figure 7) starting in 2021, in order to compete with Airbus 320 and Boeing 737.
Figure 7 - Aircraft C919 of COMAC
2.2.3 Feeder flights removal
Environmental policy tends to reduce transportation pollution and some countries have decided to
remove feeder flights (short-distance flights used to bring passengers to hub airports where they can
catch long-distance flights). For instance, in France, government stated that flight which could be
20D2.1 - ATM ROLE IN INTERMODAL TRANSPORT: OPPORTUNITIES FOR
INNOVATIVE INTERMODAL CONCEPTS AND PASSENGER
INFORMATION SERVICES
operated by trains in less than 2h30 should be removed. Passengers would then have to take a train
before their long flight. Then a better coordination between trains and flights could be expected.
Moreover, the removal of these short flights in hub airports should increase their capacity by releasing
some slots for long distance flights.
2.3 Emerging technologies
2.3.1 Data release
The emergence of new technologies allows passengers to be more confident about multimodality. The
increase of real-time data sources, such as FlightRadar24, as well as communication from
transportation companies through social networks (Twitter or Facebook), provides passengers with
accurate information on their transportation modes. This makes multimodality easier for passengers,
who can plan their trips in advance and adapt them in real-time in case of disruptive events. Data
collected through mobile devices and IoT (Internet of Things) systems are also useful for operators to
gain insights on passenger behaviour and design new passenger-oriented metrics to evaluate the
performance of the global transportation system.
2.3.2 Technological advances
At the same time, new technologies are changing the classical vision of transportation. Over the past
few years, the transportation system has been altered with the emergence of ride sharing apps.
Platforms such as Blablacar or CarFly (an application launched in 2017 that aims to connect passengers
taking the same flight in order to enable them to use ride-sharing to reach or leave the airport) are
now competing with public transportation or even air transport on short distance trips. Emerging
means of ground transportation could also have a deep impact on the global transportation system
structure. For example, even though it still raises many unanswered questions, the hyperloop project
launched by Elon Musk (see Figure 8) would make passengers travel at hypersonic speed thanks to a
system of tubes with low air pressure, in a range of 1,500km. This system would be faster than the
train while being much more energy efficient than aircraft.
21D2.1 - ATM ROLE IN INTERMODAL TRANSPORT: OPPORTUNITIES FOR
INNOVATIVE INTERMODAL CONCEPTS AND PASSENGER
INFORMATION SERVICES
Figure 8 - The Hyperloop project of encapsulated transportation of humans (Source:
http://www.dailymail.co.uk/sciencetech/article-2912170/LA-San-Francisco-half-hour-moves- closer-Elon-
Musk-reveals-plans-Hyperloop-test-track-Texas.html)
At airport level, emerging new technologies are also likely to reduce the processing time of passengers
at departure and arrival airports. As an example, biometrics identification systems are already
implemented in several airports, like the Automated EasyPASS border checks at Frankfurt Airport
which lets passengers clear border checks faster. The development of end-to-end touchless technology
might grow rapidly, especially with the COVID-19 crisis. The generalisation of such systems in European
airports would help reach the Flightpath 2050 goal of 4 hours door-to-door travel.
Finally, the improvement of Internet connectivity with 5G deployment is also likely to have an impact
on passenger behaviour. Due to COVID-19, most business trips have already been replaced by
videoconference and teleworking. After the post-COVID crisis, 5G is likely to encourage companies to
keep increasing the use of videoconference while reducing business trips and may badly impact the air
transportation system.
2.3.3 Mobility-as-a-Service
The emergence of new apps with real-time information (Google Maps, Moovit, Citymapper, etc)
enables people to have a clear vision of the system state. Indeed, combined multiple transportation
modes may appear uncertain or unreliable. Thus, the development of accessibility to information, at
the planning scale but also in real-time, is an essential point to “transfer seamlessly between transport
modes” and increase the confidence of passengers in the transportation system.
22D2.1 - ATM ROLE IN INTERMODAL TRANSPORT: OPPORTUNITIES FOR
INNOVATIVE INTERMODAL CONCEPTS AND PASSENGER
INFORMATION SERVICES
2.4 Societal attitudes towards long-distance travel
2.4.1 The importance of the value of time
Each unit of time is valuable and perceived differently depending on the activity running. Especially,
time spent on transport is considered by users as a loss of time. Numerous transfers, waiting time, and
uncertainties have a higher value of time than in-vehicle times. Indeed, waiting minutes could be
perceived by passengers as twice the in-vehicle time [3]. In order to shift from the usual road mono-
mode to a greener multi-mode trip, transportation operators must ensure seamless and reliable trips
to make intermodality attractive.
2.4.2 Social attitudes
Over the past few years, the performance of the transportation system was assessed by means of
transport-centric metrics. The idea that the passenger experience could appear as a good indicator of
the system performance was slowly arising but has become clearer with the COVID-19 crisis: without
demand, the overall transportation system collapsed. Thus, the societal attitude towards the
transportation system is an essential parameter to ensure its sustainability. Today, people’s sentiments
begin to be considered by transportation stakeholders and are at the centre of transportation system
challenges.
The green wave actions, such as #Flygskam, aviation bashing or the recent demonstration at Paris-CDG
airport to protest against the airport expansion project, tend to reduce air traffic and long-distance
travel. Secondly, the pandemic curbs long-distance travel demand. Indeed, with uncertainties about
the evolution of the world health situation and the risk of lockdowns, people are cautious and prefer
to travel inside their borders. Moreover, the risk of contamination inside aircraft and hub airports,
coupled with the heavy process to respect social distancing, discourages some people to take
long-distance flights.
This unwillingness to travel is also easier to share for people since the explosion of social media. More
and more passenger experiences are shared on Twitter [4]. Social actions, new trends and information
arise on social networks and propagate faster than ever around the world. The transportation system
must be aware of people’s minds and not neglect these data in order to fit the passengers’
expectations and adapt its offer.
23D2.1 - ATM ROLE IN INTERMODAL TRANSPORT: OPPORTUNITIES FOR
INNOVATIVE INTERMODAL CONCEPTS AND PASSENGER
INFORMATION SERVICES
3 Definition of coordination mechanisms
between the ATM system and ground
transport modes
This section describes a set of innovative coordination mechanisms at tactical and strategic level
between ATM and ground transportation systems that could be explored. These mechanisms relate to
the system stakeholders (ATM, airlines, railway operators, public transportation) which interact with
each other at different scales (from urban to international scale). While information sharing may allow
them to better adapt their connections, this bilateral transparency may also be useful for passengers,
who are the final users of this complex system.
3.1 Definition of coordination mechanisms at strategic level
In this section, we present a number strategic coordination mechanisms between ATM and ground
transportation systems that refer to long-term scheduling (months, weeks in advance). These
mechanisms are summarised in Figure 9.
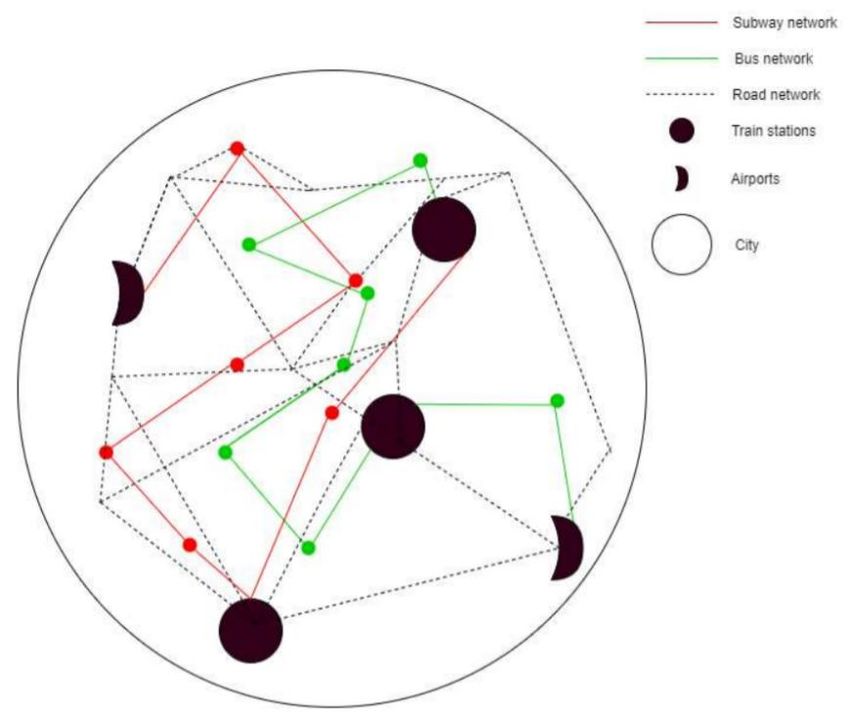
Figure 9 – Coordination mechanisms at strategic level
24D2.1 - ATM ROLE IN INTERMODAL TRANSPORT: OPPORTUNITIES FOR
INNOVATIVE INTERMODAL CONCEPTS AND PASSENGER
INFORMATION SERVICES
3.1.1 Long-distance coordination mechanisms at strategic level
An efficient transportation system must meet the needs of its users. A better knowledge of the actual
behaviour of passengers is essential to provide them with reliable, safe, and suitable transportation
services. This can be achieved through an improvement of the existing information sharing schemes.
Identification of origin-destination demand
All passengers rely on several transportation modes articulated around their flights to perform their
journey from door to door. While many passengers opt for on-demand services, such as taxi,
ride-hailing and, possibly, future urban air mobility services, most rely on scheduled transportation
services, such as trains and light rail, as well as on the use of private vehicles. Identifying the scheduled
multimodal patterns of air passengers provides an initial “state of the system”. Feasibility of such an
identification task is supported by prior research. For example, cell phone positioning data has been
successfully validated against traditional data available from the US air transportation system, such as
airport congestion, air traffic delays, irregular operations, and passenger transit time [5]. Moreover,
this data also contains detailed information about the ground transportation part of the passenger
journey. Figure 10 illustrates this claim by revealing the “ground transportation reach” of New York’s
main airports, Newark (EWN), John Fitzgerald Kennedy (JFK), and La Guardia (LGA) airports. The black
circles indicate the locations of cell phones that were used during a flight into or out of any of these
three airports. LGA and JFK airports serve some radius in the east and north directions, in particular
Long Island. However, EWR serves a much broader area south, including passengers going/coming
from as far as Philadelphia and Wilmington, PA, west as far as Allentown, PA, north as far as Albany,
NY, and East as far as Providence, RI and Hartford, CT. Unlike LGA and JFK, EWR serves almost no
passengers in Long Island, thus indicating a geographical partition of New-York passengers. The
highway system seems to be playing an important role here, with zip codes lined up along highways to
the airports showing up distinctly. However, the striking difference between EWR and JFK/LGA relates
to the presence of another transit system opposed to the highway system: the public transit system,
of interest to our study. As it happens, EWR has a direct stop on two different regional trains connected
to the centre of Manhattan, whereas JFK and LGA are much harder to access, requiring connecting
trains and/or buses.
25D2.1 - ATM ROLE IN INTERMODAL TRANSPORT: OPPORTUNITIES FOR
INNOVATIVE INTERMODAL CONCEPTS AND PASSENGER
INFORMATION SERVICES
Figure 10 - Ground connectivity of the three major New-York airports. The connectivity of Newark airport
(EWN) goes farther than that of John Fitzgerald Kennedy airport (JFK) or La Guardia airport (LGA), due in part
to its excellent connectivity to the rail system. Note, however, that EWN hardly serves any Long Island
resident, thus indicating a strong geographical partitioning of airport clientele. European airports such as
Frankfurt (FRA) or Charles de Gaulle (CDG) are expected to follow the same patterns. (Source: [5])
The use of mobile phone records for estimating the catchment areas of airports has been also exploited
in Europe. This type of analysis has revealed the differences between accessibility to airports and
high-speed train stations in corridors where there is competition between both modes ( [6]) and has
also shed light on the access and egress mode used in combination to the flight to complete the whole
trip ( [7]). Mobile phone data can be complemented with other data sources such as passenger
statistics, parking data or passenger surveys. Data sharing among different stakeholders can therefore
enrich these analyses.
Having a better knowledge of passengers is valuable for the transportation system which can adapt its
offer by proposing consistent choices. The table below summarises the data that can be leveraged for
this analysis.
Stakeholders Airlines, Tour operators
Passenger click stream (coupled with IP address), mobile phone
Input Data
passenger tracking historical data, passenger profiles
Decision Variables Estimated door to door demand
Constraints Transportation network constraints
Objective Minimise the demand prediction error
Table 2 - Identification of origin-destination demand problem
26D2.1 - ATM ROLE IN INTERMODAL TRANSPORT: OPPORTUNITIES FOR
INNOVATIVE INTERMODAL CONCEPTS AND PASSENGER
INFORMATION SERVICES
Gate and apron assignment
At the airport, boarding and deboarding occurs at gates or aprons that are allocated by airports (UE)
or airlines (US) for each flight (see Figure 11). This allocation is done by identifying statistically
significant flights that may have frequent connecting passengers. Data sharing by ground
transportation companies may help airlines identify passengers coming to the airport by trains or other
scheduled transportation modalities and then provide this information to the managers of airport
departure operations, especially those in charge of optimising gate allocation, to minimise passengers’
connection time. Likewise, informing airport ground operation teams with train connections of arriving
passengers may be factored into arrival gate optimisation. Extracting historical gate allocation data
and train schedules from published information by airport, airlines, and rail service providers allows
analysts to provide decision-makers with estimates of the impact of such optimised operations on
passenger experience. The resulting analyses necessarily include other factors currently accounted for
in airport airside operations, including fairness requirements when several airlines and ground
operators are involved. This mechanism can be part of the coordination between feeder trains and
flights, in a similar fashion to the current coordination mechanisms between connecting flights.
Figure 11 - Gate assignment for passengers connecting with ground transportation system (Source: [8])
Historical gate allocation, train schedules, flight schedules, passenger
Input Data
connection information
Decision Variables Gate assignment
Constraints Gate capacity
Minimise transfer time from ground transportation terminal to gate and
Objective
gate to ground transportation terminal.
Table 3 - Gate assignment optimisation problem
27D2.1 - ATM ROLE IN INTERMODAL TRANSPORT: OPPORTUNITIES FOR
INNOVATIVE INTERMODAL CONCEPTS AND PASSENGER
INFORMATION SERVICES
Air-rail timetable synchronisation
Based on the overall traffic demand in both the aircraft network and the rail network, timetables are
established for trains and aircraft in order to adapt capacity to the corresponding demand. Limited
railroad / air transportation schedule coordination efforts exist wherever airports are co-located with
a large railway station, but this area deserves further investigation, including when train departure and
arrivals and airports are not co-located. More attractive schedules could be developed that include
one or multiple performance criteria, such as connection robustness, connection transfer time, etc.
Such optimisation processes may have to consider intra-mode synchronisation schemes that optimise
individual transportation modes. For instance, if the arrival time of an aircraft is changed in order to
maximise the synchronisation with a train, the impact of this change on connecting aircraft must also
be considered. This synchronisation optimisation process must also be done jointly with the frequency
optimisation of the transportation modes used for connecting airports to the railway stations. Based
on the optimised timetable of trains and aircraft, such optimisation process aims at adapting the
ground transportation mode frequencies (light rail, bus, regional and national trains...) to provide
passengers with robust and efficient transfers between airports and railways stations. Link and node
capacity constraints must also be considered in order to avoid congestion in the ground transportation
system. A synopsis is shown in Figure 12 that illustrates the foregoing needs.
Figure 12 - Timetable synchronisation between several transportation modes minimises slack time between
transportation modalities and optimises robustness against modal and transfer time disruptions.
In this figure, three transportation modes are considered with their own schedules. The left column
identifies the arrivals and the right one the departures. The lines between such columns correspond
to the intra-mode connection. By considering transfer time (including holding time), it is possible to
28D2.1 - ATM ROLE IN INTERMODAL TRANSPORT: OPPORTUNITIES FOR
INNOVATIVE INTERMODAL CONCEPTS AND PASSENGER
INFORMATION SERVICES
synchronise transportation modes at the strategic level for transportation actors to optimise a global
efficiency objective (e.g., average or worst-case passenger journey duration). The red line on the figure
represents journeys of passengers connecting origin O to destination D. The necessity to arrange
smooth journeys for a large number of passengers is reminiscent of the classical “green wave” design
problem in urban traffic optimisation, whereby as many drivers as possible must only meet green lights
during transit [9].
Such multimodal transportation schedule optimisation, where multiple, possibly independent business
entities with differing objectives must interact, may borrow from the distributed optimisation
literature and practice to implement convergent and easy-to maintain strategies in a decentralised
fashion ( [10], [11]). The challenge is then to determine the minimal information that each entity must
share to enable such a distributed optimisation scheme. Traditional approaches to the solution of such
problems rely on nonlinear variants of the Dantzig-Wolfe decomposition and other primal-dual
approaches to distributed optimisation.
Input Data OD demand (door to door), initial transportation mode schedules
Decision Variables Transportation mode schedules
Constraints Capacity, airport opening/closing time
Objective Maximise inter/intra mode connections (robustness, shortest time, etc...)
Table 4 - The aircraft/train timetable synchronisation optimisation problem
Actual time estimation
Collecting historical mobile phone and GPS data (FlightRadar24, SNCF) on flights or trains make it
possible to identify their actual arrival time distributions [12]. For instance, the arrival time distribution
of shuttle flights into SFO may be statistically very different from scheduled arrival times, due to
uncertainty about San Francisco fog evaporation. Likewise, air traffic congestion may force an arriving
flight to enter a holding pattern or a ground delay program. Such congestion management procedures
usually result in delayed actual arrival time relative to scheduled arrival time. This analysis could be
extended to rail transportation, which is also subject to delays. Estimating the actual transit time is
helpful in order to engineer a resilient door-to-door journey schedule. The sharing of such information
between ATM and ground transportation would let stakeholders adapt their schedules (for instance
flights/train connections) to minimise missed connections between them. This work could also be used
to gain insights on delays factors.
Input Data Historical scheduled flight times/ train journey times and real travel times
(source: FlightRadar24, SNCF.com, mobile devices)
Decision Variables Probability density function parameters (mean, variance)
Constraints Physics of the system (e.g., flight time > 0)
Objective Minimise prediction error
Output Flight/Train delay probability distribution function
Table 5 - Actual travel time estimation optimisation problem
29You can also read