AUCKLAND GROWTH MONITOR - A SNAPSHOT INTO AUCKLAND'S ECONOMY AND PLACE ON THE WORLD STAGE AUGUST 2018 - Knowledge Auckland

Page created by Sam Mills
 
CONTINUE READING
AUCKLAND GROWTH MONITOR - A SNAPSHOT INTO AUCKLAND'S ECONOMY AND PLACE ON THE WORLD STAGE AUGUST 2018 - Knowledge Auckland
AUCKLAND
GROWTH MONITOR
A SNAPSHOT INTO AUCKLAND’S ECONOMY AND PLACE ON THE WORLD STAGE
AUGUST 2018
aucklandnz.com/auckland-index
AUCKLAND GROWTH MONITOR - A SNAPSHOT INTO AUCKLAND'S ECONOMY AND PLACE ON THE WORLD STAGE AUGUST 2018 - Knowledge Auckland
Auckland Growth Monitor 2018                                                                                             2

CONTENTS
WELCOME                                        3
   Auckland at a glance                        4
PEOPLE                                         5
   Population                                  6
   Demography and diversity                    7
   Labour market                               9
MĀORI ECONOMY                                12
   Population                                 13
   Labour market                              14
   Unlocking Māori youth potential             15
BUSINESS AND ECONOMY                          18
   Gross domestic product                     19
   Exports                                    20
   Confidence indices                         21
   Infrastructure development                 22
AUCKLAND IN DEPTH                             23
  Sectors of focus                            24                                                                       21
  Visitor economy                             27
  Areas of business and employment            29
AUCKLAND IN THE WORLD                         35
   Auckland’s global connections             36
   Auckland rankings                         38
   New Zealand rankings                      39
KEY AUCKLAND INDICATOR TABLES                40
ENDNOTES AND TERMS OF USE                    45
ACKNOWLEDGEMENTS                             46
CONTACT US                                    47

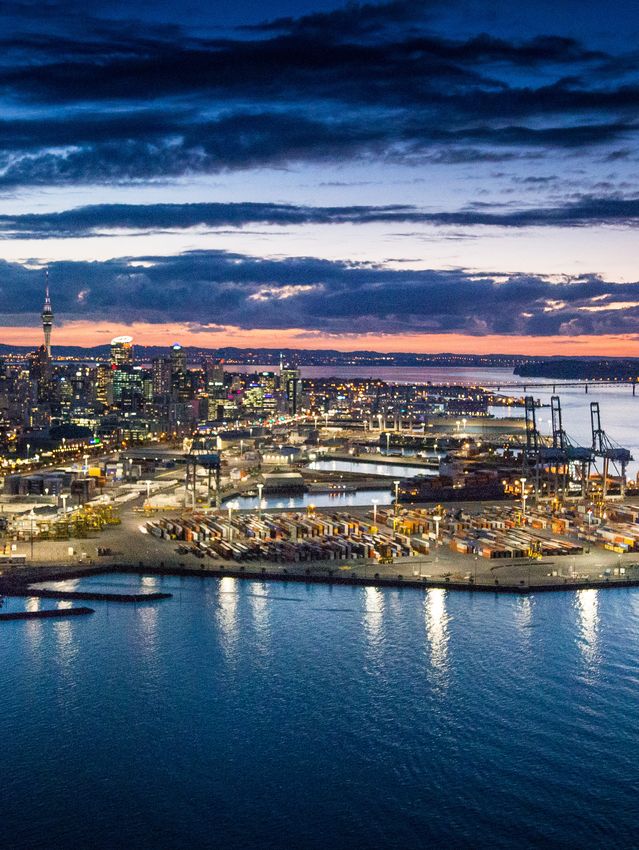
                                     Cover image: Ports of Auckland aerial. Courtesy of Alex Wallace and Ports of Auckland.
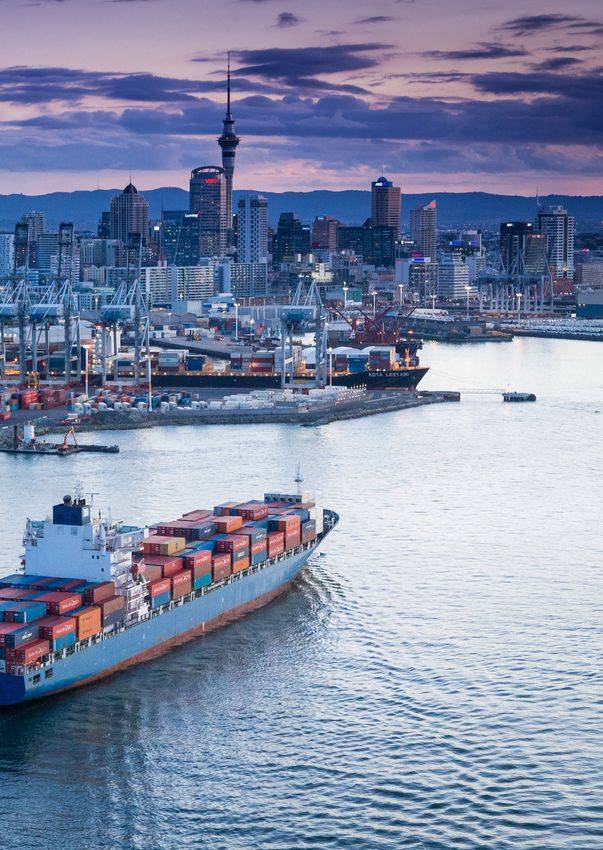
AUCKLAND GROWTH MONITOR - A SNAPSHOT INTO AUCKLAND'S ECONOMY AND PLACE ON THE WORLD STAGE AUGUST 2018 - Knowledge Auckland
3

WELCOME
                                                                 NORTH
                                                                AUCKLAND
                                                                                HAURAKI GULF

                                                                            CENTRAL
                                                               WEST        AUCKLAND
                                                             AUCKLAND

                                                                            SOUTH-EAST
                                                                            AUCKLAND

Auckland is
New Zealand’s
global city.
This means Auckland offers all the benefits that the
rest of New Zealand has – relative safety and security,
little corruption, ease of doing business, and economic
freedom – as well as being the country’s commercial
capital and cosmopolitan melting pot, Auckland is a place
to live, work or do business.
                                                                 Our mix of industries is as diverse as their locations
Auckland is the gateway to New Zealand, with direct              across the region. Auckland is not all about its city centre,
flights to 48 overseas markets, and then on to more              although there are over 200,000 jobs there; 35 per cent of
than 20 domestic destinations. The city is home to the           which are in high-end professional and financial services.
vast bulk of multi-national and national head offices in         In fact, three-quarters of our workforce are in other parts
New Zealand and with these global connections comes              of the city, such as the industrial and logistics precinct
diversity. Almost 40 per cent of residents were born             near the airport, or the rural hinterland an hour’s drive
outside of New Zealand, in addition to the city having one       from the CBD.
quarter of New Zealand’s Māori population and a large
                                                                 Although growth is slowing in Auckland after many years,
Pasifika community.
                                                                 this is all relative. Real GDP growth is still well over 2
Recent years have seen enviable growth in population             per cent a year, construction is surging again to deliver
and Gross Domestic Product (GDP), as the rest of the             the tens of thousands of new homes we need for the
world and returning Kiwis have come to appreciate                burgeoning population, and retail trade growth remains
what Auckland has to offer and have made the city their          well above inflation.
home. While we have around 38 per cent of the country’s
                                                                 This monitor provides a wealth of information on the
real GDP, we also have almost half (42 per cent) of New
                                                                 economy’s shape and direction. Read it. Enjoy it. And
Zealand’s total population growth. The pull of the city
                                                                 don’t forget to click on the graphs to access the interactive
for working-age people also means we have one of the
                                                                 data on The Auckland Index!
youngest populations in the country, and a 956,800 strong
workforce, more than one-third of them with bachelor’s           David Norman
degrees or higher.                                               Chief Economist, Auckland Council

aucklandnz.com/auckland-index
AUCKLAND GROWTH MONITOR - A SNAPSHOT INTO AUCKLAND'S ECONOMY AND PLACE ON THE WORLD STAGE AUGUST 2018 - Knowledge Auckland
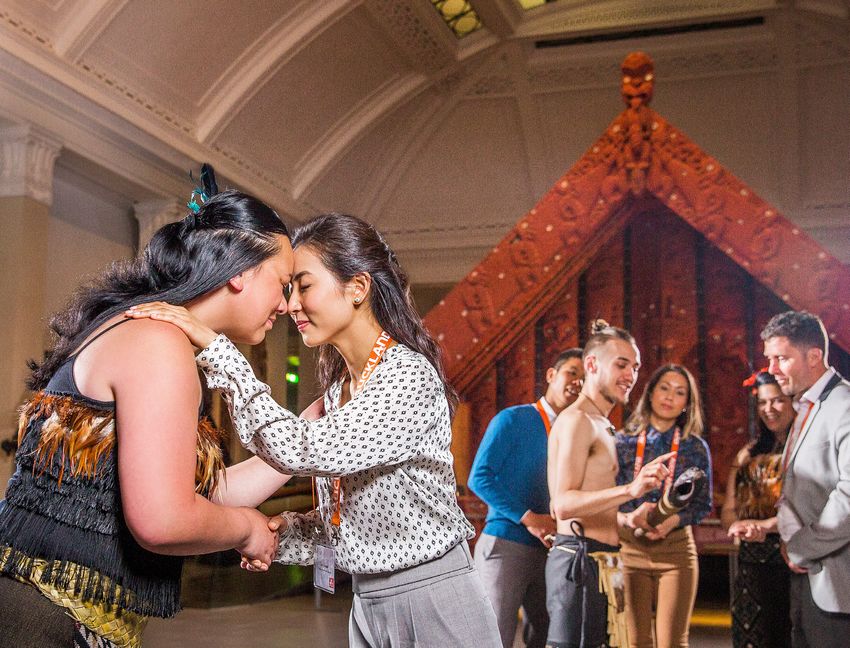
Auckland Growth Monitor 2018                                                                                                           4

AUCKLAND AT A GLANCE
POPULATION
• 43,000 new residents for the year
  ended June 2017.
• 2.6 per cent annual growth since the
  year ended June 2016.                                             1.65m                                     220+
• 13 per cent of Auckland’s population
  is of Māori descent.

LABOUR FORCE                                                         POPULATION                              ETHNICITIES
• L abour force of 956,800 for the year                              Statistics New Zealand                 Statistics New Zealand
                                                                      (year ended June 2017)                      (2013 Census)
   ended March 2018.
• 29,900 additional members joined
  the labour force in the past 12 months,
  a 3.2 per cent increase since March 2017.

EMPLOYMENT
• T otal employment of 913,900 for

                                                                      914K                                   4.5%
   the year ended March 2018.
• Growth of 3.8 per cent on previous year.
• Unemployment at 4.5 per cent, one of
  the lowest levels in the past decade.

BUSINESS
• 1 92,000 registered businesses for the                     EMPLOYED PERSONS                            UNEMPLOYMENT RATE
                                                                      Statistics New Zealand                  Statistics New Zealand
   year ended March 2017, a net annual                               (year ended March 2018)                 (year ended March 2018)
   increase of 8,000 new businesses.
• Global and local political factors
  are considered key drivers behind
  a business confidence dip in 2017–2018.

ECONOMIC OUTPUT
• Auckland’s real GDP1 is 38 per cent of

                                                                       192K                                    38%
  national output, totalling just under
  $92 billion for the year ended
  March 2018.
• Annual growth of 2.2 per cent since
  March 2017 and averaging 3.9 per cent
  growth per annum over past five years.
• Construction and tourism sectors are                          # OF BUSINESSES                            % NATIONAL GDP
  major growth contributors with 13.9                                    Infometrics Ltd                         Infometrics Ltd
  and 7.6 per cent growth, respectively,                             (year ended March 2017)                 (year ended June 2017)

  over the past 12 months.

1
  Real GDP is the inflation-adjusted estimate presented in 2010 prices. All GDP figures in the Auckland
Growth Monitor are presented in real GDP to allow for meaningful year-on-year GDP comparison.
AUCKLAND GROWTH MONITOR - A SNAPSHOT INTO AUCKLAND'S ECONOMY AND PLACE ON THE WORLD STAGE AUGUST 2018 - Knowledge Auckland
Auckland Growth Monitor 2018                                                                       5

PEOPLE
Home to a diverse, growing and youthful
population that is amongst the most
highly skilled in the Asia-Pacific.
• Population
• Demography
• Diversity
• Labour market

aucklandnz.com/auckland-index

                                     ATEED Major events, Pasifika Festival. Courtesy of Gareth Cooke.
AUCKLAND GROWTH MONITOR - A SNAPSHOT INTO AUCKLAND'S ECONOMY AND PLACE ON THE WORLD STAGE AUGUST 2018 - Knowledge Auckland
People – Population                                                                                                                 6

POPULATION
  Auckland’s economic performance continues to be
  underpinned by a large and growing population.
                                                                                              Between June 2016
  Auckland is New Zealand’s most populous region.                                          and June 2017, the city
  For the year ended June 2017, Auckland was home to
  more than 1.65 million people, accounting for more                                     added 43,000 additional
  than a third of New Zealand’s population.
                                                                                          people – the population
  Between 2012 and 2017, Auckland added 180,000 new
  residents, with growth averaging 2.3 per cent per annum                                          of Upper Hutt.
  during this period. This equates to adding a town just
  larger than Hamilton since 2013. Between June 2016
  and June 2017, the city added 43,000 additional people
  – the population of Upper Hutt.
  According to Statistics New Zealand medium
  projections, Auckland’s population may reach 2 million
  by as early as 2029 and hit 2.5 million by 2043. While
  this growing population supports demand for goods
  and services, and provides additional labour force
  capacity to enable growth, it will also place increasing
  pressure on housing, transport, infrastructure and
  public services.
  Source: Statistics New Zealand

  Auckland population growth (2007-2017)
  Source: Statistics New Zealand (year-endedAUCKLAND
                                             June).  POPULATION GROWTH (2007               - 2017)
                           50K                                                                                    3.0%   ANNUAL POPULATION GROWTH RATE

                           45K
ANNUAL POPULATION GROWTH

                                                                                                                  2.5%
                           40K

                           35K
                                                                                                                  2.0%
                           30K
                           25K                                                                                    1.5%
                           20K
                                                                                                                  1.0%
                           15K
                           10K
                                                                                                                  0.5%
                            5K

                            0K                                                                                    0.0%
                                               09
                                        08
                                 07

                                                      10

                                                                                     14

                                                                                                     16
                                                                                            15
                                                                       12

                                                                              13

                                                                                                           17
                                                             11
                                 20

                                       20

                                              20

                                                     20

                                                            20

                                                                   20

                                                                             20

                                                                                    20

                                                                                           20

                                                                                                     20

                                                                                                          20

                                      ANNUAL POPULATION GROWTH (LHS)        ANNUAL POPULATION GROWTH RATE (RHS)
AUCKLAND GROWTH MONITOR - A SNAPSHOT INTO AUCKLAND'S ECONOMY AND PLACE ON THE WORLD STAGE AUGUST 2018 - Knowledge Auckland
People – Demography                                                                                    7

DEMOGRAPHY
Auckland is a relatively young city with a larger proportion
of working age population than the rest of New Zealand.
                                                                           An aging population is a
For the year ended June 2017, Auckland’s combined                           common characteristic
median age was 33.9 compared to the national median
age of 37.                                                                of developed nations like
In 2017, 34.5 per cent of Auckland’s population was aged                      New Zealand and has
under 25, compared to a New Zealand average of 33.9
per cent. However, this group has been slowly declining                   planning implications for
(as a percentage of total population) since 2000, when
36.9 per cent of Auckland’s population was aged under 25.               superannuation, healthcare
As New Zealand’s population is aging, this trend is                              services, housing/
projected to continue and in 10 years’ time (2028),
people under 25 will only make up 30.7 per cent of                      accommodation, transport,
Auckland’s population. An aging population is a common
characteristic of developed nations like New Zealand and                 provision of aged care and
has planning implications for superannuation, healthcare
services, housing/accommodation, transport, provision
                                                                                many other factors.
of aged care and many other factors.
Auckland’s working age population (aged 15–64) makes
up 68.7 per cent of the region’s total population.
This compares to 65.5 per cent across New Zealand.
Since 2000, Auckland’s proportion of working age
population has increased from 67.3 per cent, while the
New Zealand-wide figure has decreased slightly (65.6 per
cent at 30 June 2000).
Source: Statistics New Zealand

Auckland population distribution (2018)
                                           AUCKLAND'S POPULATION DISTRIBUTION (2018)
Source: Statistics New Zealand (year-ended June).

                  85+
               80–84
               75 –79
               70 –74
               65 –69
               60–64
               55 –59
   AGE GROUP

               50 –54
               45 –49
               40–44
               35 –39
               30 –34
               25 –29
               20 –24
               15 –19
               10 –14
                  5 –9
                  0–4
                         5%   4%   3%       2%        1%       0%        1%        2%   3%   4%   5%
                                                  PROPORTION OF POPULATION
                                                     FEMALE (%)       MALE (%)
People – Diversity                                                                                                              8

DIVERSITY
Auckland’s demographics play an important role in
the function of its economy, with its cultural diversity
                                                                             Auckland was ranked fourth
a key driver of innovation, rising productivity and                              most diverse city in the
global engagement.
Auckland was ranked fourth most diverse city in the
                                                                               world by the International
world by the International Organization for Migration                         Organization for Migration.
in 2015 – with 39 per cent of residents born overseas and
over 220 resident ethnicities. It is also home to
one of the largest communities of urban Pacific peoples
in the world, who currently account for 15 per cent
of Auckland’s population. According to Statistics
New Zealand’s medium population projections, the
Pacific population will grow to over 360,000 within the
next 20 years, accounting for 16.5 per cent of Auckland’s
population by 2038.
With forecast ongoing inward migration, Auckland is set
to become even more diverse. The Asian population,
in particular, is projected to grow at more than 3 per
cent per annum over the next 20 years and will make up
35.5 per cent of Auckland’s population by 2038.
Specific to migration, it is worth noting that the most
recent figures show net migration has slowed slightly
to 34,448 (year ended March 2018) from a high point
of 35,772 a year ago.
Source: Statistics New Zealand

   Auckland:
   A diverse city
                                                                             39   %
                                                                                                        29        %

                                      European
                                      Asian

            220+
              Ethnicities in
                                      Pacific peoples
                                      Māori
                                      Middle Eastern/Latin
                                                                        39 per cent of            29 per cent of
                Auckland              American/African
                                                                        Auckland residents        Aucklanders can
                                      Other                             Were born overseas.       speak two or more
                                                                                                  languages.

   Source: Statistics New Zealand (2013 Census, excludes unspecified data)                                      aucklandnz.com
                                                                                      Source: Statistics New Zealand (2013 Census)
People – Labour market – size                                                                                                      9

                   LABOUR MARKET – SIZE
                         A skilled and growing labour force is vital for economic
                         success. A balance between an engaged labour market
                                                                                                                 This growing labour market
                         and availability of labour is key to an economy’s future                                     has been an important
                         growth prospects.
                         With a working age population of 1.34 million and a
                                                                                                                 driver of growth, with many
                         labour force of 956,800 for the year ended March 2018,                                 industries able to meet their
                         Auckland is home to New Zealand’s largest workforce
                         and talent base.                                                                             demand for additional
                         Auckland’s labour force increased by 350,900 people
                         between March 2000 and 2018 – an increase of 58 per cent
                                                                                                                             labour capacity.
                         that translates to an average growth rate of 3.2 per cent
                         per annum.
                         The majority of this growth has occurred post the Global
                         Financial Crisis (GFC), with Auckland adding 194,500 to its
                         labour market since 2011. This growing labour market has
                         been an important driver of growth, with many industries
                         able to meet their demand for additional labour capacity.
                         With 914,000 employed for the year ended March 2018,
                         labour force participation rates are at 71.1 per cent
                         – the second highest rate since 2000. This may place
                         constraints on future growth as capacity within the active
                         labour market declines.
                         Source: Statistics New Zealand

                         Auckland labour market (2008-2018)
                                             AUCKLAND LABOUR MARKET (2008                                            -2018)
                         Source: Statistics New Zealand, Household Labour Force Survey (quarterly).
                          1.6M

                          1.4M
WORKING AGE POPULATION

                          1.2M

                          1.0M

                          0.8M

                          0.6M

                          0.4M

                          0.2M

                          0.0M
                                                    Q3
                                       Q3

                                              Q1
                                 Q1

                                                                  Q3

                                                                                                                     Q3

                                                                                                                                          Q3
                                                                                                                                Q3
                                                                                             Q3

                                                                                                           Q3
                                                           Q1

                                                                                                                                                    Q3
                                                                                                                Q1

                                                                                                                                     Q1

                                                                                                                                                         Q1
                                                                                                                          Q1
                                                                                      Q1
                                                                               Q3

                                                                                                      Q1

                                                                                                                                               Q1
                                                                        Q1
                                           09

                                                  09
                             08

                                    08

                                                          10

                                                               10

                                                                                                            14

                                                                                                                  14

                                                                                                                                   16

                                                                                                                                        16

                                                                                                                                                       18
                                                                                                                        15

                                                                                                                              15
                                                                                    12

                                                                                           12

                                                                                                  13

                                                                                                       13

                                                                                                                                             17

                                                                                                                                                  17
                                                                      11

                                                                             11
                           20

                                  20

                                         20

                                               20

                                                      20

                                                               20

                                                                    20

                                                                           20

                                                                                  20

                                                                                         20

                                                                                                20

                                                                                                       20

                                                                                                            20

                                                                                                                 20

                                                                                                                       20

                                                                                                                              20

                                                                                                                                   20

                                                                                                                                        20

                                                                                                                                             20

                                                                                                                                                  20

                                                                                                                                                       20

                                                ACTIVE LABOUR FORCE (#)                 NOT IN LABOUR FORCE (#)             WORKING AGE POPULATION (#)
People – Labour market – employment                                                                           10

             LABOUR MARKET –
             EMPLOYMENT
                   For the year ended March 2018, 913,900 of the
                   Auckland labour market were employed, reflecting
                                                                                                         Auckland is New Zealand’s
                   an unemployment rate of 4.5 per cent.                                               largest and most consistent
                   Auckland is New Zealand’s largest and most consistent
                   source of job growth. Around 190,200 jobs were
                                                                                                              source of job growth.
                   added in the past five years, reflecting a growth
                   rate of 26 per cent and contributing 45 per cent of
                   national employment growth. During the same period,
                   Auckland’s unemployment rate has declined from 6.9
                   per cent to 4.5 per cent.
                   These trends indicate positive demand for labour and
                   increasing uptake of employment from within the local
                   labour market.
                   Since the post-GFC peak in 2012, the average rate of
                   young people not in employment, education or training
                   (NEET) per annum has declined from 12.7 per cent to 11.5
                   per cent for the year ended March 2018.
                   These figures continue to reflect strong labour market
                   performance and a growing talent and labour pool
                   within Auckland’s diverse labour market.
                   Source: Statistics New Zealand

                   Auckland employment rates (2008-2018)
                   Source: Statistics New Zealand, HouseholdAUCKLAND     EMPLOYMENT
                                                            Labour Force Survey (quarterly). RATES (2008    -2018)

                   10.0%

                     8.0%

                     6.0%
EMPLOYMENT RATES

                     4.0%

                     2.0%

                     0.0%

                    -2.0%

                    -4.0%

                    -6.0%
                                               Q3
                                 Q3

                                        Q1
                          Q1

                                                           Q3

                                                                         20 3

                                                                         20 3
                                                                         20 3
                                                                         20 3

                                                                         20 3
                                                      Q1

                                                                         20 3
                                                                         20 1

                                                                         20 1

                                                                              Q1
                                                                         20 1
                                                                         20 1
                                                                               3

                                                                         20 1

                                                                         20 1
                                                                    1

                                                                              Q

                                                                              Q

                                                                              Q

                                                                              Q
                                                                              Q

                                                                              Q
                                                                              Q

                                                                              Q

                                                                              Q

                                                                              Q

                                                                              Q

                                                                              Q
                                                                  Q

                                                                         Q
                                     09

                                            09
                        08

                              08

                                                     10

                                                          10

                                                                           14

                                                                           14

                                                                           16

                                                                           16

                                                                           18
                                                                           15

                                                                           15
                                                                           12

                                                                           12

                                                                           13

                                                                           13

                                                                           17

                                                                           17
                                                               11

                                                                      11
                     20

                            20

                                   20

                                          20

                                                    20

                                                          20

                                                               20

                                                                    20

                                                                         20

                                                    ANNUAL EMPLOYMENT GROWTH RATE                      UNEMPLOYMENT RATE
People – Labour market – quality talent                                                                                                                                                       11

LABOUR MARKET –
QUALITY TALENT
      Auckland’s population has continued to shift towards
      a higher skills base, with more than 36 per cent of
                                                                                                                                       Auckland’s population has
      employment in knowledge intensive industries1 and                                                                                continued to shift towards
      47.4 per cent employed in high-skilled and medium-
      to-high-skilled jobs for the year ended March 2017.                                                                                    a higher skills base.
      There has been a significant improvement in skills over
      the last decade. For the year ended March 2007,
      40.5 per cent of Auckland’s workforce was classified
      as low-skilled compared to 37.1 per cent in 2017, while
      those classified as high-skilled have increased from 32.9
      per cent to 36 per cent over the same period.
      This is also reflected in the number of people employed
      in the technology sector, increasing from 46,127 in 2012
      to 55,132 in 2017 (an annual growth rate of 3.6 per cent).
      In fact, Auckland accounts for around 48 per cent of
      New Zealand’s technology workforce.
      According to the 2013 Census, 86 per cent of
      Auckland’s working age population is either secondary
      or tertiary-educated (excluding unspecified results)
      – providing a strong foundation for further shift towards
      high-skilled jobs.
      Source: Statistics New Zealand and Infometrics Ltd.

      Auckland employment by broad skill level (2007-2017)
                                      AUCKLAND
      Source: Statistics New Zealand, Household    EMPLOYMENT
                                                Labour Force SurveyBY BROAD SKILL LEVEL (2007-2017)
                                                                   (quarterly).

                                100%
PROPORTION OF PEOPLE EMPLOYED

                                90%
                                80%
                                70%
                                60%
                                50%
                                40%
                                30%
                                20%
                                10%
                                  0%
                                            2007           2008          2009           2010          2011           2012          2013          2014           2015          2016           2017
                                                         HIGH-SKILLED               MEDIUM/HIGH-SKILLED                      MEDIUM-SKILLED                  LOW-SKILLED

      •                          High-skilled occupations typically require a bachelor degree or higher qualification. The category includes professionals (accountants, teachers and engineers).
      •                          Medium/high-skilled occupations typically require an NZQA registered diploma. The category includes some managers (retail managers) and technicians
                                 (architectural draftspersons, ICT support technicians and dental hygienists).
      •                          Medium-skilled occupations typically require an NZQA registered level 4 qualification. The category includes tradespersons (such as motor mechanics),
                                 skilled service workers (such as firefighters), and skilled clerical or sales workers (such as legal secretaries and estate agents).
      •                          Low-skilled occupations typically require an NZQA registered level 3 qualification or lower. This category includes general clerks, caregivers,
                                 and sales assistants, through to cleaners and labourers.

      1
       Knowledge-intensive industries are industries that satisfy two basic criteria: At least 25 per cent of the workforce must be qualified to degree level and
      at least 30 per cent of the workforce must be employed in professional, managerial, as well as scientific and technical occupations.
12

MĀORI
ECONOMY
One in four New Zealand Māori live and
work in Auckland – our unique Māori
identity is an important component
of our city’s global proposition.
• Māori economy – people
• Māori economy – labour force

aucklandnz.com/auckland-index

                                         Rangitoto Island, collecting shellfish. Courtesy of Todd Eyre.
Māori Economy – People                                                                                                13

                          MĀORI ECONOMY – PEOPLE
                          The Māori economy contributes across Auckland’s
                          business, social, and community dimensions and is
                                                                                                                 Auckland’s unique Māori
                          becoming a formidable force. Auckland’s unique Māori                                    identity is an important
                          identity is an important component of the city’s global
                          business and investment proposition.                                                    component of the city’s
                          Auckland Council officially recognizes 19 iwi (Māori tribal                                global business and
                          authorities) as representing mana whenua (Māori with
                          ancestral relationships to certain areas) interests in                                 investment proposition.
                          Auckland. According to the 2013 Census, 13 per cent of
                          Auckland’s population is of Māori descent, compared
                          to 17 per cent for New Zealand. However, only 16 per
                          cent of Auckland Māori are mana whenua, the rest
                          are mātāwaka (Māori associated with iwi outside of
                          Auckland or not associated with any iwi).
                          Between 2011 and 2017, Auckland’s Māori population
                          increased by over 13,000 or 8.4 per cent. More than
                          a quarter of New Zealand’s Māori population live
                          in Auckland.
                          Importantly, 33 per cent of Māori in Auckland are aged
                          0–14, compared to only 19 per cent for the same age
                          group for all other ethnic groups.
                          Source: Auckland Council; Statistics New Zealand and Infometrics Ltd.

                          Auckland Māori population (2007-2017)
                          Source: Infometrics Ltd (year ended June).AUCKLAND MAORI POPULATION (2001-2017)
                          240 K                                                                                                               1.8%
                          220 K                                                                                                                      MĀORI POPULATION ANNUAL GROWTH RATE
                                                                                                                                              1.6%
                          200 K
                                                                                                                                              1.4%
                          180 K
MĀORI DECENT POPULATION

                          160 K                                                                                                               1.2%
                          140 K
                                                                                                                                              1.0%
                          120 K
                                                                                                                                              0.8%
                          100 K
                           80 K                                                                                                               0.6%
                           60 K
                                                                                                                                              0.4%
                           40 K
                                                                                                                                              0.2%
                           20 K
                            0K                                                                                                                0.0%
                                     2007        2008        2009        2010        2011         2012   2013   2014    2015    2016   2017

                                           AUCKLAND MĀORI POPULATION (LHS)                        MĀORI POPULATION ANNUAL GROWTH RATE (RHS)
Māori Economy – Labour force                                                                                                      14

                        MĀORI ECONOMY –
                        LABOUR FORCE
                        Māori are playing an increasing role in the Auckland
                        labour market. In the five years between March 2012 and
                                                                                                                   The impact of positive
                        March 2017, Māori employment increased by 21.6 per                                      Māori employment growth
                        cent, adding 14,763 people to the Auckland workforce.
                        The impact of positive Māori employment growth has
                                                                                                                 has decreased the Māori
                        decreased the Māori unemployment rate in the same                                       unemployment rate in the
                        period by 3.4 per cent to 10.2 per cent, falling from a
                        2013 high of 14.1 per cent.                                                           same period by 3.4 per cent.
                        This remains higher than the Auckland unemployment
                        rate of 4.5 per cent but represents a positive trend that
                        will assist in improving Māori prosperity and well being.
                        Source: Infometrics Ltd (year ended March).

                        Māori employment level vs unemployment rate (2007-2017)
                        Source: Infometrics Ltd (yearMended
                                                         ORIMarch).
                                                             EMPLOYMENT       LEVEL VS
                                                                    Māori unemployment    UNEMPLOYMENT
                                                                                       rate data prior to 2009 isRATE  (2007
                                                                                                                  unavailable.    -2017)
                        100 K                                                                                                                            16%
                         90 K
                                                                                                                                                         14%
PERSONS IN EMPLOYMENT

                         80 K
                                                                                                                                                               UNEMPLOYMENT RATE

                                                                                                                                                         12%
                         70 K
                         60 K                                                                                                                            10%

                         50 K                                                                                                                            8%
                         40 K
                                                                                                                                                         6%
                         30 K
                                                                                                                                                         4%
                         20 K
                         10 K                                                                                                                            2%

                         00 K                                                                                                                            0%
                                    2007        2008        2009       2010        2011       2012        2013        2014       2015      2016   2017
                                                     MĀORI EMPLOYMENT (LHS)                           MĀORI EMPLOYMENT RATE (RHS, %)
Auckland in depth – Unlocking economic potential of Māori youth                                  15

UNLOCKING THE ECONOMIC
POTENTIAL OF AUCKLAND’S
MĀORI YOUTH
Ka pū te ruha, ka hao te rangatahi.
As the old net weakens, a new one
prepares to take over.
BY TANIA TARAWA, MĀORI ECONOMIC DEVELOPMENT DELIVERY MANAGER, ATEED.
                                                                            164K
                                                                            OF MĀORI DESCENT    of Māori Descent
                                                                                                Other ethnicity
As the region’s economic growth agency, ATEED is committed
to helping realise the economic potential of Auckland’s
Māori community – particularly rangatahi (youth). We will
do this principally by taking an opportunity-based approach
                                                                       Māori descendants
and seeking ways to leverage Māori culture and matauranga
Māori (indigenous knowledge) as a platform to build
                                                                       in Auckland 2013
economic strength. This approach will form the backbone                 of Māori Descent
of ATEED’s new Māori economic growth strategy being                     Other ethnicity
developed in 2018 in consultation with our partners.
Auckland has a youthful Māori population. There are
approximately 164,000 Aucklanders either identifying as
being of Māori descent or having Māori ethnicity, and more
than half are under the age of 25, and a third under the age
of 15.
About 40 per cent of Auckland’s schools offer some level
of Māori medium education, including bilingual and full
immersion options. Most young Māori are accessing Māori
                                                                          52.5%
                                                                            AGED 0–24 YEARS      0-14 years
                                                                                                 15-24 years
language and culture through Māori medium education
                                                                                                 Older
options inside mainstream schools. There are however a
strong number of families that choose a total immersion into
Māori culture within Kura Kaupapa Māori across Auckland.
In Auckland we are seeing a cohort of young people who are             Proportion of Māori
deeply connected to their culture and their communities.
                                                                       youth in Auckland 2013
Figure 1 and 2: Proportion of Māori descendants and
                                                                       0-14 years
proportion of Māori youth in Auckland.
                                                                       15-24 years
Source: Statistics New Zealand; Ministry of Education.                 Older
Auckland in depth – Unlocking economic potential of Māori youth                                                                    16

Our region’s Māori youth possess a pride of culture             creative potential into economic potential and then
and heritage, and embody the attributes visitors to             economic reality for the benefit of both Māori
Auckland want to engage with. Events such as ASB                and Auckland.
Polyfest – where thousands of young Aucklanders
                                                                Much of our region’s economic potential resides in the
proudly share their Māori culture alongside other
                                                                creative and service industries, including tourism and
Polynesian performances – demonstrate the potential
                                                                technology based industries where intuitive creativity
of cultural knowledge.
                                                                is essential to success. The future of work requires a
Anyone who has visited the annual ASB Polyfest in               labour market that is creative, connected and skilled
Manukau will see, feel and hear Māori and Pasifika              in the application of new knowledge. We see much
culture proudly celebrated in the world’s largest               alignment and synergy with the needs of the new
secondary school festival of its kind. The festival has         economy and the place of Māori in this.
been a constant on the Auckland secondary school
                                                                There are a number of examples where mātauranga
calendar for 42 years so many Māori and Pasifika
                                                                Māori is already proving its application to the
young people who were schooled in Auckland over the
                                                                business world. Māori knowledge and experienced
last four decades has had some personal experience
                                                                use of the bioactive properties of native natural
with their culture and traditions. The result is a
                                                                medicines such as honey from the native manuka
significant cohort of young Māori who have a pride in
                                                                ‘tea tree’ has attracted international attention, with
their expression of culture and mātauranga Māori.
                                                                ATEED’s trade growth programmes indicating there is
This youthful, creative and connected population                significant interest from the huge Chinese health food
is a strength for Auckland. ATEED’s role is to create           market, where the use of traditional herbal medicine
opportunities and programmes that convert this                  is ingrained.

Our region’s Māori
youth possess a
pride of culture and
heritage, and embody
the attributes visitors
to Auckland want
to engage with.
                                         INAKL International Student Network launch event 2015 at The Cloud. Courtesy of Gareth Cooke.
Auckland in depth – Unlocking economic potential of Māori youth                                                                                       17

There is an increasing practical use of Māori language                           competitive advantage that can help Auckland set
and design in consumer product branding, where                                   itself apart from other global cities. Once the right
companies use that unique global identity to provide                             strategies are in place to help Māori youth and Māori
label authenticity to New Zealand-made products.                                 businesses realise that potential, they can be at the
                                                                                 forefront of the next wave of product development
The most immediate opportunity for Auckland
                                                                                 and growth in Auckland’s tourism sector – at the same
potentially is tourism, a $3.34 billion1 annual industry
                                                                                 time benefitting from its future economic outcomes
in our region. Māori culture has long been identified
                                                                                 through good jobs, and more of them.
as one of the key reasons tourists choose to visit
New Zealand, alongside our beautiful scenery and                                 Auckland Council has formally recognised the need
renowned outdoor experiences. Auckland presently                                 to prioritise Māori youth and correcting disparate
does not have enough Māori tourism product to meet                               regional prosperity in its long-term planning. ATEED’s
market demand so there is a role for ATEED to play                               new opportunity-based approach will reflect what
in job matching and enterprise development and                                   the Māori community, our Māori partners and Council
support.                                                                         stakeholders have asked us to achieve – that is
                                                                                 positive transformation which looks past the surface
Auckland’s Māori culture and in particular rangatahi
                                                                                 statistics and focuses on turning creative potential
Māori holds a key to creating a distinctive and viable
                                                                                 into economic reality.
Source: Statistics New Zealand and Ministry of Education.
1
    Tourism contribution to Auckland GDP for the year ended March 2017, for more information please refer to Auckland’s sectors of focus (page 26).

Auckland Council has formally recognised
the need to prioritise Māori youth and
correcting disparate regional prosperity
in its long-term planning.

                                                 Māori welcome for convention delegates, Auckland Museum, Central Auckland. Courtesy of Todd Eyre.
18

BUSINESS
AND
ECONOMY
As New Zealand’s commercial hub,
the Auckland economy is diverse,
growing and globally connected.
• GDP
• Exports
• Confidence indices
• Growing infrastructure

aucklandnz.com/auckland-index

                                Ports of Auckland aerial. Courtesy of Alex Wallace and Ports of Auckland.
Business and Economy – GDP                                                                                                                   19

    GROSS DOMESTIC
    PRODUCT
         Gross Domestic Product provides an indication of the size and
         structure of an economy and a benchmark for measuring changes
                                                                                                                 Auckland’s economy
         to regional economies over time. It is an important indicator of the                                  contributed 38 per cent
         economic performance of a city or country.
         Auckland’s economy contributed 38 per cent of New Zealand’s total
                                                                                                                of New Zealand’s total
         economic output for the year ended March 2018, up from 36.8 per                                             economic output.
         cent in 2013, highlighting Auckland’s ever increasing role in the
         national economy. The growth in Auckland’s economy has boosted
         confidence and stimulated investment.
         For the year ended March 2018, Auckland’s real GDP1 was estimated
         to be $91.9 billion, a 2.2 per cent increase since March 2017.
         Despite a slow down in 2017, growth over the past 5 years has
         averaged 3.9 per cent per annum, a step above the rest of New
         Zealand at 2.7 per cent per annum. This has been primarily driven
         by above average population growth, a strong construction pipeline
         and a booming visitor economy.
         This has somewhat masked real growth in the economy, however,
         with GDP per capita growth in Auckland lagging at around 1 per
         cent in recent years, indicating a lack of growth in productivity. This
         has the potential to impact on the prosperity of many Aucklanders.
         Source: Statistics New Zealand and Infometrics Ltd.
         1
           Real GDP is the inflation-adjusted estimate presented in 2010 prices. All GDP figures in the Auckland
         Growth Monitor is presented in real GDP to allow for meaningful year-on-year GDP comparison.

         Annual real GDP growth rate (2008-2018)
                                              ANNUALLtd
         Source: Statistics New Zealand and Infometrics REAL GDP GROWTH RATE (2008
                                                         (quarterly).                                              -2018)
                                6.0%
MOVING ANNUAL GDP GROWTH RATE

                                4.0%

                                2.0%

                                0.0%

                                -2.0%

                                -4.0%
                                                       Q3
                                             Q3

                                                  Q1
                                     Q1

                                                                 Q3

                                                                                                            Q3

                                                                                                                                      Q3
                                                                                                                            Q3
                                                                                     Q3

                                                                                               Q3
                                                            Q1

                                                                                                                                                Q3
                                                                                                     Q1

                                                                                                                                 Q1

                                                                                                                                                     Q1
                                                                                                                    Q1
                                                                                Q1
                                                                           Q3

                                                                                          Q1

                                                                                                                                           Q1
                                                                      Q1
                                              09

                                                   09
                                  08

                                        08

                                                        10

                                                             10

                                                                                                   14

                                                                                                          14

                                                                                                                             16

                                                                                                                                  16

                                                                                                                                                 18
                                                                                                                   15

                                                                                                                        15
                                                                            12

                                                                                  12

                                                                                       13

                                                                                            13

                                                                                                                                       17

                                                                                                                                            17
                                                                  11

                                                                       11
                                20

                                        20

                                             20

                                                  20

                                                       20

                                                            20

                                                                 20

                                                                      20

                                                                           20

                                                                                 20

                                                                                      20

                                                                                           20

                                                                                                20

                                                                                                       20

                                                                                                              20

                                                                                                                      20

                                                                                                                            20

                                                                                                                                 20

                                                                                                                                      20

                                                                                                                                           20

                                                                                                                                                20

                                                             AUCKLAND           REST OF NEW ZEALAND                NEW ZEALAND
Business and Economy – Exports                                                                                                          20

           EXPORTS
                 Exports are another key indicator of economic
                 performance. While there is limited data around exports
                                                                                                     Additional investment in both
                 generated by Auckland firms, Auckland ports are a                                   Auckland International Airport
                 major departure point for goods, with 30 per cent of
                 New Zealand goods leaving via Auckland sea and air                                      and Ports of Auckland will
                 ports for the year ended December 2017. Auckland
                 freight on board (FOB) growth has largely tracked New                               generate greater international
                 Zealand’s export growth since 2016, despite a small
                 divergence in Q3 of 2017.
                                                                                                         trade capacity to support
                 Over the next 30 years, Ports of Auckland will increase                              Auckland’s growing economy.
                 container capacity and Auckland International Airport
                 will increase infrastructure to accommodate 40 million
                 passengers and 260,000 flights per annum by 2040.
                 This additional investment in both Auckland
                 International Airport and Ports of Auckland will
                 generate greater international trade capacity to support
                 Auckland’s growing economy and population.
                 New Zealand’s main export markets are Australia,
                 China and the USA, and Auckland exporters are heavily
                 dependent on a strong New Zealand supply chain to
                 drive exports, particularly in the food and beverage and
                 broader manufacturing sectors.
                 Source: Statistics New Zealand, Ports of Auckland and Auckland Airport.

                 Annual FOB export value growth (2008-2018)
                                                     ANNUAL FOB EXPORT VALUE GROWTH (2008
                 Source: Statistics New Zealand (quarterly).                                                         -2018)
                                 40%
ANNUAL FOB EXPORT VALUE GROWTH

                                 30%

                                 20%

                                 10%

                                  0%

                                 -10%

                                 -20%

                                 -30%

                                 -40%

                                 -50%
                                                       Q3
                                             Q3

                                                  Q1
                                      Q1

                                                                 Q3

                                                                                                            Q3

                                                                                                                                    Q3

                                                                                                                                                          )
                                                                                                                       Q3
                                                                                     Q3

                                                                                                 Q3
                                                            Q1

                                                                                                                                              Q3
                                                                                                       Q1

                                                                                                                               Q1
                                                                                                                 Q1
                                                                                Q1
                                                                           Q3

                                                                                           Q1

                                                                                                                                         Q1
                                                                      Q1

                                                                                                                                                       (P
                                              09

                                                   09
                                  08

                                        08

                                                        10

                                                             10

                                                                                                      14

                                                                                                           14

                                                                                                                              16

                                                                                                                                   16
                                                                                                                15

                                                                                                                      15
                                                                             12

                                                                                   12

                                                                                           13

                                                                                                13

                                                                                                                                        17

                                                                                                                                             17

                                                                                                                                                   Q1
                                                                  11

                                                                       11
                                 20

                                        20

                                             20

                                                  20

                                                       20

                                                             20

                                                                  20

                                                                       20

                                                                            20

                                                                                  20

                                                                                        20

                                                                                                20

                                                                                                     20

                                                                                                           20

                                                                                                                20

                                                                                                                     20

                                                                                                                           20

                                                                                                                                   20

                                                                                                                                        20

                                                                                                                                             20

                                                                                                                                                  18
                                                                                                                                              20

                                              EX. AUCKLAND PORTS           EX. REST OF NEW ZEALAND PORTS             EX. ALL NEW ZEALAND PORTS
Business and Economy – Confidence indices                                                                                                                    21

   CONFIDENCE INDICES
         Confidence indicators provide a perspective on consumer
         and business confidence, plans and expectation. They
                                                                                                         Global geopolitical
         are an important indicator in tracking the overall current                              uncertainty, the outcome
         and likely future performance of an economy.
         Since the recovery from the GFC began in 2011, business
                                                                                                    of the general election,
         confidence has increased, reaching a five-year average of                                 a stronger New Zealand
         25 per cent in 2016 vs. a previous five-year average of –29
         per cent. Global geopolitical uncertainty, the outcome                                  dollar and limited access
         of the general election, a stronger New Zealand dollar
         and limited access to talent were key drivers behind                                    to talent were key drivers
         business confidence falling through 2017. This trend has
         continued into the first quarter of 2018, with business                               behind business confidence
         confidence falling a further 14.8 per cent. In addition
         to the reasons above, this reflects some nervousness
                                                                                                        falling through 2017.
         around government policy and is likely to limit hiring and
         investment throughout 2018.
         Auckland’s consumer confidence has been fairly resilient
         in recent years, with major dips only seen during the
         GFC and the early stages of recovery. Confidence grew
         strongly between 2012 and 2015 and has remained
         largely stable until a slight dip in late 2017. Consumer
         confidence has picked up again in March 2018, reflecting
         some renewed optimism in the economy and resulting
         in an increase in retail and entertainment spending by
         Auckland households.
         Source: Westpac McDermott Miller, Regional Consumer Confidence Index (CCI) and New Zealand
         Institute of Economic Research (NZIER), Quarterly Survey of Business Operation (QSBO).

      Confidence indices (2008-2018)
      Source: Regional Consumer Confidence Index (CCI), Westpac McDermott Miller (quarterly).
                                                 CONFIDENCE
      Quarterly Survey of Business Operation (QSBO), New Zealand INDICES
                                                                 Institute of (2008           -2018)
                                                                              Economic Research (NZIER) (quarterly).
                            140                                                                                          80.0%
CONSUMER CONFIDENCE INDEX

                                                                                                                                   BUSINESS CONFIDENCE SCORE (%)

                                                                                                                         60.0%
                            120
                                                                                                                         40.0%
                            100
                                                                                                                         20.0%
                             80                                                                                          0.0%

                             60                                                                                          -20.0%

                                                                                                                         -40.0%
                             40
                                                                                                                         -60.0%
                             20
                                                                                                                         -80.0%

                              0                                                                                          -100.0%
                            20 Q3
                            20 Q3
                            20 Q1
                            20 Q1

                            20 Q3

                            20 Q3

                            20 Q3
                            20 Q3
                            20 Q3

                            20 Q3
                            20 Q1

                            20 Q3
                            20 Q1

                            20 Q1

                                 Q1
                            20 Q1
                            20 Q1
                            20 Q3

                            20 Q1

                            20 Q1
                            20 Q1
                              09
                              09
                              08
                              08

                              10
                              10

                              14
                              14

                              16
                              16

                              18
                              15
                              15
                              12
                              12
                              13
                              13

                              17
                              17
                              11
                              11
                       20

                                   CONSUMER CONFIDENCE INDEX (LHS)                        BUSINESS CONFIDENCE (RHS, %)
Business and Economy – Growing infrastructure                                                                                                   22

GROWING INFRASTRUCTURE
Infrastructure investment and construction activity is a key driver of
economic growth. With more than $28 billion of large construction
                                                                                                                         Investments will
projects underway in the first quarter of 2018, Auckland is in the midst                                               provide enhanced
of a construction boom. This is forecast to continue well into the next
decade with a strong pipeline of private opportunities and public                                                        social, transport
developments. This is also reflected in strong growth in our construction
and engineering sector (see page 25).                                                                                      and economic
Rider Levett Bucknall’s latest Crane Index reported 73 cranes in Auckland                                          infrastructure, which
(up one from previous year), accounting for almost 60 per cent of active
crane stock in New Zealand at the close of the 2017 calendar year. Current                                          will help Auckland’s
major infrastructure projects include the $700 million New Zealand
International Convention Centre being built in Auckland’s city centre,                                                economy function
$400 million of investment into Auckland International Airport, a $200
million large scale regeneration project in the Wynyard Quarter Innovation
                                                                                                                     effectively, well into
Precinct, the $425 million Commercial Bay redevelopment and the $3.4                                                      the 21st century.
billion, 7-year construction of The City Rail Link (CRL) – New Zealand’s
largest infrastructure project ever undertaken.
The recently released final proposal for Auckland Council’s 10-year
Budget by Mayor Phil Goff allocates $26.2 billion to address critical
issues of traffic congestion, housing affordability and environmental
protection. Housing New Zealand currently has around 100 state housing
redevelopments underway as part of The Auckland Housing Programme
(AHP) - a joint initiative with Homes. Land. Community. (HLC) that aims
to deliver 23,600 new residences over the next 10 years on state-owned
land across Auckland – 11,000 of which will be new social housing and the
remainder a split between KiwiBuild and affordable free-market homes.
Central government has committed $2 billion to KiwiBuild, an ambitious
programme that aims to build 100,000 affordable, quality homes for first
home buyers over the next decade, 50,000 of which will be in Auckland.
These investments will provide enhanced social, transport and economic
infrastructure, which will help Auckland’s economy function effectively,
well into the 21st century.
Source: Auckland Council and Rider Levett Bucknall, Crane Index.

Auckland Council capital expenditure
by public infrastructure        type (2019-2028)
           AUCKLAND COUNCIL CAPITAL EXPENDITURE BY PUBLIC
Source: The 10-year Budget 2019-2028, Auckland Council.
                                                            INFRASTRUCTURE TYPE (2019     -2048)
PUBLIC INFRASTRUCTURE BUDGET (NZ$)

                                     $3.0B

                                     $2.5B

                                     $2.0B                                                                                ROADS AND FOOTPATHS

                                                                                                                          PUBLIC TRANSPORT
                                     $1.5B
                                                                                                                          WATER SUPPLY
                                     $1.0B
                                                                                                                          WASTEWATER

                                     $0.5B                                                                                STORMWATER

                                                                                                                          COMMUNITY SERVICES
                                     $0.0B
                                              2019   2020    2021    2022   2023   2024   2025     2026   2027   2028

                                             ROADS AND FOOTPATHS    PUBLIC TRANSPORT      WATER SUPPLY
                                             WASTEWATER             STORMWATER            COMMUNITY SERVICES
AUCKLAND
                                                                                                    23

IN DEPTH
Auckland is one of the fastest growing
cities in the Asia-Pacific owing to its
diverse mix of industries and locations.
• Sectors of focus
• Visitor economy
• Areas of business and employment
• Unlocking economic potential
  of Māori youth

aucklandnz.com/auckland-index

                                  Start-up programming team. Courtesy of vgajic/Getty Images 507420432.
Auckland in depth – Sectors of focus                                                                                                                   24

AUCKLAND’S
SECTORS OF FOCUS
As a service and innovation-oriented economy,
Auckland has developed a core of specialist
                                                                                                  Auckland has developed
manufacturing industries and a talented, globally                                                      a core of specialist
focused service sector.
ATEED has identified the following nine sectors of
                                                                                                  manufacturing industries
focus1 as key players in the growth of quality jobs and                                            and a talented, globally
economic prosperity in Auckland:
•    Advanced material related                                                                     focused service sector.
•    Commercial services
•    Construction and engineering
•    Education
•    Food and beverage
•    Screen and creative
•    Technology
•    Tourism
•    Transport and logistics

             $47B                                                500K                                                    98K

        53 PER CENT OF                                       59 PER CENT OF                                   51 PER CENT OF
        AUCKLAND GDP                                         AUCKLAND JOBS                                 AUCKLAND BUSINESSES
For the year ended March 2017, Auckland’s            Auckland’s sectors of focus employed over            For the year ended March 2017, 51 per cent
sectors of focus contributed 53 per cent             500,000 people for the year ended March              of Auckland businesses (98,200) operated
of Auckland’s $90 billion annual real                2017, contributing 59 per cent of total              in one of Auckland’s nine focus sectors.
GDP2 ($47.3 billion). Sectors of focus also          regional employment. Around 118,000 jobs             In the past five years, 28,000 businesses
combine to account for 57 per cent of                were added in the past 5 years, sectors of           were added, of these new businesses,
regional real GDP growth for the past                focus contributed 90,000 jobs or 76 per              56 per cent of new businesses operated
five years.                                          cent of total growth.                                within these sectors.

Source: Infometrics Ltd and ATEED (year ended March 2017).

1
  Auckland’s sectors of focus comprise ANZSIC06 level 4 codes across multiple industry classes. Select ANZSIC06 codes are used to define multiple sec-
tors resulting in a small element of overlap. Individual sector totals should only be used for sector-vs-sector comparisons and specific sector reporting.
Total values that encapsulate all nine sectors are exclusive of duplicate ANZSIC06 code values and can, therefore, be safely used for aggregate compar-
ison. Data varies from 2017 figures to reflect revised Auckland sectors of focus definitions in May 2018.
2
  Real GDP = inflation-adjusted estimates presented in 2010 prices. Real GDP allows for meaningful year-on-year GDP comparison.
Auckland in depth – Sectors of focus driving economic growth                                                                                  25

SECTORS OF FOCUS DRIVING
ECONOMIC GROWTH
Auckland is a services dominated economy owing to the
city’s status as New Zealand’s commercial hub. A growing
                                                                                                  Auckland is a services
technology sector, with many technology firms providing                                            dominated economy
disruptive solutions for other industries, now plays a prominent
role in Auckland’s economy.                                                                           owing to the city’s
Auckland’s screen and creative sector has also seen a                                           status as New Zealand’s
resurgence in recent years, buoyed by investment in
infrastructure such as Kumeu Film Studios and increased                                                commercial hub.
demand for Auckland as a filming location. In fact, revenue
from film production and post-production in Auckland overtook
$1 billion for the first time in 2017, reaching $1.12 billion.
While services dominate, food and beverage still plays a key
role in the Auckland economy, employing nearly 30,000 people
and exporting a significant proportion of its output.
While these sectors underpin the Auckland economy, it has
been construction and tourism which were pivotal to strong
GDP growth in 2017, with growth of 13.9 per cent and 7.7 per
cent, respectively, between March 2016 and 2017. This was
driven by a strong pipeline of infrastructure and housing
projects and record numbers of visitors to Auckland.
With other industries such as international education,
manufacturing and retail also playing a significant role,
Auckland’s economy remains diverse – a characteristic
which offers resilience and opportunity.
Source: Infometrics Ltd and ATEED (year ended March 2017).

                                                             Wine bottles in bottling machine. Courtesy of Monty Rakusen/ Getty Images 119014829.
Auckland in depth – Sectors of focus                                                                                                                   26

ECONOMIC                                                                                                  Construction and
                                                                                                    tourism were pivotal to
CONTRIBUTION                                                                                          strong GDP growth in
OF AUCKLAND’S                                                                                      2017, with growth of 13.9
                                                                                                  per cent and 7.7 per cent
FOCUS SECTORS3                                                                                        respectively between
                                                                                                      March 2016 and 2017.

                             ADVANCED     COMMERCIAL CONSTRUCTION                    FOOD AND     SCREEN AND                                TRANSPORT
                             MATERIALS     SERVICES      AND           EDUCATION     BEVERAGE      CREATIVE     TECHNOLOGY      TOURISM        AND
                              RELATED                ENGINEERING                                                                             LOGISTICS

              2017 Real
                              $1.78B       $18.59B        $6.36B        $3.64B        $3.39B       $4.68B         $9.15B       $3.34B         $2.81B
                  GDP4
     1-year growth rate        5.6%          5.9%         13.9%          3.5%          0.7%          2.5%          3.8%          7.7%         4.2%

          5-year CAGR5         2.6%          4.2%          8.2%          1.3%          1.9%          6.2%          5.7%         4.4%          5.0%

                 2017
                               13,721       181,482       89,668        64,649        29,964        51,817        65,557       55,804        25,070
           employment
     1-year growth rate        1.3%          3.7%          8.9%          3.6%          1.4%          2.5%          3.0%         6.2%          2.6%

           5-year CAGR         0.7%          3.5%          6.6%          2.2%          2.7%          3.6%          3.2%          3.5%          2.7%

                  2017
                               1,056        49,173        25,800        3,360          2,877        14,865        10,602        7,558         3,893
        business count
     1-year growth rate       -2.8%          3.3%          8.3%          4.1%          2.8%          3.2%          3.0%          3.3%         2.6%

           5-year CAGR         0.3%          3.4%          5.6%          3.1%          3.9%          2.8%          2.8%          3.5%         2.8%

                   2017
                         $129,422         $102,439       $70,879       $56,337       $113,119      $90,382      $139,546       $59,823      $112,229
    labour productivity6
     1-year growth rate        4.2%          2.1%          4.6%         -0.1%         -0.7%         0.0%          0.8%           1.4%          1.5%

           5-year CAGR         1.9%          0.7%          1.5%         -0.9%         -0.7%          2.5%          2.4%         0.8%           2.3%

Source: Infometrics Ltd and ATEED (year ended March 2017).

3
  Auckland’s sectors of focus comprise ANZSIC06 level 4 codes across multiple industry classes. Select ANZSIC06 codes are used to define multiple
sectors resulting in a small element of overlap. Individual sector totals should only be used for sector-vs-sector comparisons and specific sector re-
porting. Total values that encapsulate all nine sectors are exclusive of duplicate ANZSIC06 code values and can, therefore, be safely used for aggregate
comparison. Data varies from 2017 figures to reflect revised Auckland sectors of focus definitions in May 2018.
4
  Real GDP = inflation-adjusted estimates presented in 2010 prices. Real GDP allows for meaningful year-on-year GDP comparison.
5
  Compound annual growth rate (CAGR) shows the mean annual rate of growth over multiple time periods.
6
  Labour productivity represents real GDP per employed person in each sector, and is a way of describing efficiency of each sector.
Auckland in depth – Visitor economy                                                                                      27

       VISITOR ECONOMY
       Auckland is New Zealand’s primary international
       gateway. With the country’s largest international airport,
                                                                                                  Auckland is New Zealand’s
       Auckland received a record 2.72 million international                                           primary international
       visitors for the year ended March 2018 and, on average,
       71 per cent of New Zealand’s total international visitor                                                    gateway.
       arrivals in each of the past five years (2013–2018).
       In the past five-year period between March 2013
       and 2018, visitor spend within the Auckland region
       increased from $5.4 billion to $8.4 billion. Visitor guest
       nights increased by 13.5 per cent, from 6.5 million to
       7.4 million. International visitor arrivals increased by
       more than 840,000 in the same period, with an average
       annual growth of 7.6 per cent and peaking at 12.5 per
       cent in December 2016. The four major sources of
       international visitors for Auckland are Australia, China,
       the USA, and the UK.
       Learn more about Auckland’s visitors at
       aucklandnz.com/Auckland-index/visitors
       Source: Statistics New Zealand, International Travel and Migration (quarterly).

       International visitor arrivals via Auckland Airport (2010-2018)
       Source: StatisticsInternational       visitor
                          New Zealand, International    arrivals:
                                                     Travel          Auckland
                                                            and Migration (quarterly).vs.   New Zealand air ports (2010-2018)
                                                   3.0M
AUCKLAND AIRPORT INT. VISITOR ARRIVALS BY ORIGIN

               Auckland
                2.5M
                        vs NZ ports
                                                   2.0M

                                                   1.5M

                                                   1.0M

                                                   0.5M

                                                    0M
                                                     20 Q4

                                                     20 Q4

                                                     20 Q4

                                                     20 Q4

                                                     20 Q4

                                                     20 Q4

                                                     20 Q4

                                                     20 Q4
                                                     20 Q2

                                                     20 Q2

                                                     20 Q2
                                                     20 Q3

                                                     20 Q2
                                                     20 Q3

                                                     20 Q3

                                                     20 Q2

                                                     20 Q2
                                                     20 Q3

                                                     20 Q2

                                                     20 Q2
                                                     20 Q3

                                                     20 Q3

                                                     20 Q3

                                                     20 Q3
                                                     20 Q1

                                                     20 Q1

                                                     20 Q1

                                                     20 Q1

                                                     20 Q1

                                                     20 Q1

                                                     20 Q1

                                                     20 Q1

                                                          Q1
                                                       10
                                                       10
                                                       10
                                                       10

                                                       14
                                                       14
                                                       14
                                                       14

                                                       16
                                                       16
                                                       16
                                                       16

                                                       18
                                                       12
                                                       12
                                                       12
                                                       12

                                                       15
                                                       15
                                                       15
                                                       15
                                                       13
                                                       13
                                                       13
                                                       13

                                                       17
                                                       17
                                                       17
                                                       17
                                                       11
                                                       11
                                                       11
                                                       11
                                                     20

                                                          AUSTRALIA   CHINA    JAPAN         UK    USA   REST OF THE WORLD
Auckland in depth – Visitor economy                                                                                                             28

DEVELOPING AUCKLAND’S
VISITOR ECONOMY
In addition to being New Zealand’s primary international gateway,
Auckland is now also a tourism destination in its own right, with
                                                                                                 The cruise industry has
a buoyant visitor economy, boosted by world-class major events                                       played an important
and unique experiences. Tourism is a key export and employment
industry for the region. In May 2018, the Destination AKL 2025                                  role in Auckland’s recent
strategy was launched to guide the development of Auckland’s
visitor economy. The strategy, which aims to deliver a more                                              tourism growth.
sustainable future for Auckland, was the outcome of a process
initiated by ATEED and guided by an industry leadership group.
The cruise industry has played an important role in Auckland’s
recent tourism growth. Cruise-related visitor spend in Auckland
increased from $116 million in the 2012/13 season7 to $524 million
in 2017/18 – a significant five-year increase of 352 per cent or $81.6
million additional visitor spend per annum.
In the past five cruise seasons, visitor arrivals increased by 70.6
per cent from 179,800 to 306,800 and is projected to continue to
grow by another 10 per cent in 2018/19. The development of our
cruise industry plays an integral role in fuelling the future growth
of Auckland’s visitor economy.
For more details visit www.aucklandnz.com/destinationakl.
Source: New Zealand Cruise Association and Statistics New Zealand.
7
 The New Zealand cruise season begins October 1st and ends September 30th.

                                                                             Cruise ships at Queens Wharf, Central Auckland. Courtesy of Todd Eyre.
GRE
                                                                                                                                                            GR

Auckland in depth – Areas of business and employment                                                                                                29

GEOGRAPHIC DISTRIBUTION OF
BUSINESS AND EMPLOYMENT                         Share
                                                  Shareofof
                                              Auckland’s
                                                Auckland’s
                                                                                                                                           GREAT BARRIER

                                                 5 year
                                                   5 year
                                              job growth
                                                job growth

                                       Share of Auckland’s 5-year
                                       job growth per district:
                                           Central
                                            Central(40.5%)
                                                     (40.5%)
           Share of
         Auckland’s                        South-Eastern
                                            South-Eastern(29.7%)
                                                           (29.7%)
            5 year
         job growth                        North
                                            North(21.1%)
                                                   (21.1%)
                                           West
                                            West(7.9%)
                                                  (7.9%)
                                           Islands
                                             Islands(0.7%)
                                                      (0.7%)

    Central (40.5%)
Auckland is a supercity governed by the largest
    South-Eastern
council in Oceania. (29.7%)
                    It comprises five major
geographic districts: central, northern, south-                                                                                 GREAT BARRIER
    North (21.1%)
eastern, western and island districts. Each district
comprises  varying numbers of local boards8.
    West (7.9%)
The city is home
    Islands       to around 34 per cent of New
             (0.7%)
Zealand’s businesses and 37 per cent of New
                                        Share of
Zealand’s labour force and employment.       Auckland
                                      Auckland’s
                                         5 year
employment experienced 3.0 per centjobcompound
                                          growth

annual growth between March 2012 and 2017. This
translates to a 5-year employment growth of 16 per
cent or 118,000 more jobs in Auckland.
                                    Central (40.5%)
                                               South-Eastern (29.7%)
The central district is Auckland’s core  commercial
                                     North  (21.1%)
hub where almost one-in-two jobs (46 Westper
                                           (7.9%)cent)
were located for the year ended MarchIslands2017.
                                              (0.7%)The
second largest employment district is the south-
east, also known as Auckland’s manufacturing
and transportation hub, employing 27 per cent
of Aucklanders. There is also a concentration of
commercial services and high-tech businesses in the                            The central district contributed the most towards
north and a new screen industry building momentum                              Auckland’s 5-year employment growth, accounting
in the west and north-west.                                                    for 40 per cent (47,800 jobs). The south-eastern
New Zealand’s most significant road, State Highway                             district contributed a further 30 per cent or 35,000
1 (SH 1), runs directly through Auckland’s three                               additional jobs over the same period, followed by the
largest employment districts: central, south-eastern                           northern and western districts, which contributed
and northern. This major transport corridor links                              21 per cent (24,800 jobs) and 8 per cent (9,400
Auckland’s central business district (CBD) and                                 jobs), respectively. While employment growth
Ports of Auckland with business clusters, industrial                           contribution from the islands remains restricted
hubs and other major infrastructure such as Port                               due to conservation land zoning and limited access,
of Onehunga, Auckland International Airport and                                they have become sought-after lifestyle and visitor
Auckland Domestic Airport.                                                     destinations.
Source: Infometrics Ltd, Auckland Council and ATEED (year ended March 2017).

8
 There are 21 local boards providing governance at the local level within Auckland Council. Local boards enable democratic decision making by, and on
behalf of, communities within the local board area. Local boards are charged with decision-making on local issues, activities and services, and provide
input into regional strategies, policies, plans and decisions. Local board is the smallest geographic level with robust employment and business data
available for the entire Auckland region.
Auckland in depth – Areas of business and employment – central district                                                                                                                         30

CENTRAL DISTRICT
The central district comprises five local boards                                                  Central district local boards
and sits on the narrowest part of the Auckland                                                         Waitematā                                   Albert-Eden                    Puketāpapa
isthmus. It links major hubs in other districts and                                                    Maungakiekie-Tāmaki                         Ōrākei
has direct access to both the Hauraki Gulf and
the Tasman Sea via the Waitemata and Manukau
Harbours. For the year ending March 2017, the
district was home to 72,771 businesses and
389,836 employees, equivalent to 38 per cent and
46 per cent of the Auckland total, respectively.
Auckland’s CBD and recently developed Wynyard
Quarter Innovation Precinct are located in the
Waitematā Local Board. In terms of local job
count, Waitematā is the single largest board in
the region. It represents the highest concentration                                                                                                                     GREAT BARRIER
of employment in the commercial services sector,
making it Auckland’s commercial hub.
Over the past five years, the central district as a
whole added 47,791 new jobs to the city, or almost
10,000 new jobs per annum.

                                                            Central District
                                                            Local Boards
                                                                  Waitematā
                                                                  Maungakiekie-Tāmaki
                                                                  Albert-Eden
                                                                  Ōrākei
                                                                  Puketāpapa

          LOCAL BOARDS           WAITEMATĀ                  MAUNGAKIEKIE-TĀMAKI                      ALBERT-EDEN                          ŌRĀKEI                          PUKETĀPAPA
        2017 job count             204,112                           100,320                            49,464                            22,976                              12,964
         1-year growth               3.3%                               2.2%                              3.2%                             3.4%                                5.0%
         5-year growth              14.9%                              12.5%                             12.3%                             15.0%                              15.6%

       2017 firm count              29,304                             10,725                           14,478                             13,191                              5,073
         1-year growth                3.1%                              2.8%                             4.0%                              3.0%                                7.0%
         5-year growth               15.7%                             11.8%                             19.8%                             15.5%                              24.0%
                                                                 Fletcher Building Ltd,
                           Fonterra Co-operative Group,                                                                           Oji Fibre Solutions NZ Ltd,
                                                            Restaurant Brands NZ Ltd, ISS      Auckland District Health                                               Harvey Furnishings Ltd,
                          Air New Zealand Ltd, Auckland                                                                          Spotless Facility Services NZ
                                                            Facility Services Ltd, Bunnings Board, Broadspectrum NZ Ltd,                                           Easy 2 C, Tanner Couch Calen-
                          Council, Spark NZ Ltd, Bank of                                                                         Ltd, McDonald’s Restaurants
                                                             Ltd, Waste Management NZ,       Vodafone NZ Ltd, Harcourts                                            dars Ltd, Waitaki Biosciences,
      Major employers     New Zealand, Westpac NZ Ltd,           Freightways Ltd, Toll      Group Ltd, Strategic Sourcing        NZ Ltd, Green Cross Health,        Kiwi Fish International Ltd,
                            The University of Auckland,                                                                            Waste Management NZ,
                                                                New Zealand, Fletcher        Consultancy Ltd, Tegel Foods                                           Auckland Regional Migrant
                          Datacom Systems Ltd, KiwiRail,                                                                             Compass Group Ltd,
                                                             Construction Company Ltd,           Ltd, BP Oil NZ Ltd.                                                          Services.
                          SKYCITY Entertainment Group.                                                                            Placemakers, Bidfood Ltd.
                                                                   AssureQuality Ltd.
                            Professional, scientific and
                                                            Wholesale trade (14.7%), Manu- Healthcare      and social assis-     Healthcare and social assis-
                            technical services (24.8%),                                         tance (15.8%), Professional,       tance (17.0%), Education        Retail trade (14.1%), Education
                              Financial and insurance       facturing (13.5%), Construction scientific
       Top 5 industries   services (9.6%), Administrative                                               and technical services
                                                            (12.1%), Professional, scientific (15.6%), Education  and training
                                                                                                                                     and training (11.1%),
                                                                                                                                  Accommodation     and food
                                                                                                                                                                   and training (12.3%), Wholesale
                                                                                                                                                                     trade (11.6%), Construction
                           and support services (8.2%),      and technical services (9.0%), (11.8%), Retail trade (10.3%),
        of employment        Accommodation and food           Administrative and support                                        services (9.7%), Professional,     (10.1%), Professional, scientific
                                                                                                 Accommodation    and  food    scientific and technical services    and technical services (8.9%).
                            services (7.8%), Education              services (8.6%).                 services (8.4%).            (9.5%), Retail trade (9.0%).
                                and training (7.0%).
                           Auckland CBD, Eden Terrace,          Royal Oak, Onehunga,            Epsom, Mt Eden, Mt Albert,        Ellerslie, Remuera, Orakei,
                           Grafton, Newmarket, Parnell,
             Suburbs in        Grey Lynn, Ponsonby,          Te Papapa, Oranga, Penrose,
                                                               Mt Wellington, Panmure,
                                                                                                  Balmoral, Morningside,
                                                                                                  Pt Chevalier, Greenlane,
                                                                                                                                    Mission Bay, St Heliers,
                                                                                                                                     St Johns, Stonefields,
                                                                                                                                                                      Hillsborough, Waikowhai,
                                                                                                                                                                         Mt Roskill, Lynfield,
                           Westmere, Western Springs,
            local board     Herne Bay, Freemans Bay,            Tamaki, Point England,             Owairaka, Kingsland,           Meadowbank, Glendowie,                 Three Kings, Wesley.
                                                                Glen Innes, Wai o Taiki.         Sandringham, Waterview.                  Kohimarama.
                                   St Marys Bay.

Source: Infometrics Ltd, Katalyst Business and ATEED (year ended March 2017).
Auckland in depth – Areas of business and employment – south-eastern district                                                                                                                      31

SOUTH-EASTERN DISTRICT
For the year ended March 2017, the south-eastern                                                      South-eastern district local boards
district was the second largest employment district.                                                       Howick                                 Māngere-Ōtāhuhu                      Manurewa
It comprises six local boards and is home to 46,524                                                        Ōtara-Papatoetoe                       Franklin                             Papakura
businesses and 227,753 employees, 24 and 27 per cent
of Auckland’s total, respectively. The district is a
transport hub, home to over 53 per cent of Auckland’s
transport industry jobs as well as major transport
infrastructure including the Southern Motorway,
Auckland International Airport, Auckland Domestic
Airport and Halfmoon Bay Marina. Due to the ease of
access to goods and services transport, the district is
also a well-established manufacturing hub, accounting
for 44 per cent of all manufacturing jobs in Auckland.
Between March 2012 and 2017, an additional 7,900                                                                                                                            GREAT BARRIER

businesses and 35,000 jobs were created in the district,
representing a 30 per cent and 27 per cent share of
Auckland’s five year growth, respectively. Manufacturing
and transportation combined experienced steady
growth in this period, contributing a combined 20
per cent share to total district job growth. The single
                                           South-Eastern
biggest driver of growth was construction.     TheLocal
                                           District    industry
                                                         Boards

experienced a 43 per cent increase in employmentHowick       and
contributed 18 per cent of total district job growth        in this
                                                Ōtara-Papatoetoe

five year period – reflecting the city’s construction       boom
                                                Māngere-Ōtāhuhu
                                                Franklin
and the workforce required to meet existingManurewa
                                                  and ongoing
building demand.                                Papakura

    LOCAL BOARDS            HOWICK                ŌTARA-PAPATOETOE                 MĀNGERE-ŌTĀHUHU                     FRANKLIN                     MANUREWA                     PAPAKURA
  2017 job count             60,842                       47,892                         47,413                          27,231                        25,415                      18,960
    1-year growth              7.1%                        5.0%                            3.7%                           3.5%                          5.3%                        4.7%
   5-year growth             22.4%                         19.2%                          13.6%                          17.7%                         18.3%                       15.0%

 2017 firm count             16,761                         6,153                         4,557                          9,930                          4,863                      4,260
    1-year growth             5.7%                         6.4%                            3.1%                           1.7%                          4.8%                        5.0%
   5-year growth             25.4%                         26.1%                          16.6%                          10.8%                         23.0%                        18.1%
                                                      Kmart New Zealand,
                     Farmers, Express Couriers     Downer Utilities Alliance, Progressive  Enterprises Ltd,                           Hall’s Group Ltd, Argenta      Independent Liquor NZ
                         Ltd, Fisher & Paykel                                  Mainfreight Ltd, Linfox Lo-   New Zealand Steel Ltd,
                                                     Downer New Zealand,                                                                 Ltd, New Zealand In-             Ltd, Integrated
                         Healthcare Corpora-                                  gistics NZ Ltd, LSG Sky Chefs New Zealand Steel Mining
                                                     Armourguard Security,                                                             vestment    Holdings  Ltd,      Maintenance Group,
                       tion Ltd, Carters, ETHC     Wesfarmers Industrial & NZ     Ltd, Te Roopu Taurima O Ltd, HEB Construction Ltd, Business Risk Assessment Flightline         Aviation Ltd,
                      Healthcare Services Ltd,                                 Manukau, DHL Express NZ       Balle Bros Food Ltd, NZ
 Major employers       Nirvana Health Group,        Safety NZ Ltd, Manukau               Ltd, DB            Hothouse Ltd, Asplundh,    Ltd, SG Equipment Ltd,        Monier Bricks and Roof-
                                                    Institute of Technology,                                                            ASV   Euro Car  Parts NZ     ing, Veolia  Water Solu-
                     Fisher & Paykel Appliances                                 Breweries Ltd, Auckland       Oceania Aviation Ltd,
                                                      Wilson Hellaby Ltd,                                   A.S. Wilcox and Sons Ltd, Ltd, Firstflex Aflex Cables, tions and Technologies NZ
                     Holdings Ltd, Steel & Tube                                   Meat Processors Ltd,
                                                  Cardinal Logistics Ltd, NZL Termperzone                                               Drill Force NZ  Ltd, Dux    Ltd, Stresscrete,  Murphy
                     Distribution, OfficeMax NZ                                               Ltd, DFS New    Counties Power Ltd.
                                                    Group Ltd, PMP NZ Ltd,                                                                   Industries Ltd.                Buses Ltd.
                     Ltd, United Industries Ltd                                Zealand Ltd, Fliway Group.
                                                      CHEP New Zealand.
                                                                                   Transport, postal and
                                                     Healthcare and social
                      Manufacturing (19.6%),                                       warehousing (30.0%),            Construction (14.5%),         Manufacturing (22.5%),     Manufacturing (21.4%),
                                                      assistance (19.8%),
                        Retail trade (10.8%),                                      Manufacturing (11.9%),          Manufacturing (13.1%),         Education and training      Construction (14.4%),
 Top 5 industries      Construction (10.4%),      Retail trade (10.5%), Manu-
                                                  facturing  (9.7%), Education    Wholesale trade (8.7%),         Agriculture, forestry and     (12.1%), Wholesale trade       Retail trade (11.6%),
                      Wholesale trade (10.2%),                                   Professional, scientific and   fishing (12.1%), Retail trade      (9.8%), Construction      Education and training
  of employment                                       and  training (9.5%),
                     Professional, scientific and Administrative                 technical services (6.4%),        (8.1%), Education and         (9.3%), Healthcare and      (7.7%), Healthcare and
                                                                   and support
                     technical services (8.9%).                                  Accommodation and food                training (7.8%).         social assistance (8.6%).   social assistance (7.1%).
                                                         services (7.5%).             services (6.4%).
                      Highbrook, Half Moon
                     Bay, East Tamaki, Botany                                                                   Ardmore, Waiuku, Karaka, Manurewa, Manurewa East, Papakura, Pahurehure,
       Suburbs in                               Otara, Middlemore,
                    Downs, Howick, Pakuranga, Papatoetoe, East Tamaki,
                                                                                 Otahuhu, Mangere Bridge,
                                                                                 Mangere, Favona, Mangere          Pukekohe, Awhitu,      Weymouth, Homai, Wiri,  Takinini, Rosehill, Drury,
                      Cockle Bay, Sunnyhills,                                                                    Manukau Heads, Clarks    Manukau, Wattle Downs,
      local board       Buckland’s Beach,            Manukau.                         East, Airport.               Beach, Glenbrook.          Clendon Park.               Red Hill.
                           Dannemora.

Source: Infometrics Ltd, Katalyst Business and ATEED. (year ended March 2017).
You can also read