Auckland International Airport Limited - Craigs Investment Partners Company Update 10 May 2011
←
→
Page content transcription
If your browser does not render page correctly, please read the page content below
Auckland
International
Airport
Limited
Craigs Investment Partners
Company Update
10 May 2011

Presentation Team
Simon Moutter
Chief Executive
Simon is responsible for the overall leadership, strategic direction and executive
management of the Company. Prior to joining us in 2008, Simon was chief
operating officer at Telecom New Zealand, managing most parts of the business at
one time or another. This was preceded by 13 years in the electricity and gas
industries.

Simon Robertson
Chief Financial Officer
Simon commenced as chief financial officer in August 2009. He is responsible for
managing our corporate strategy and financial affairs. Simon joined us in early
2005 and has held a number of senior financial and aeronautical roles in his time
with the Company. Simon is a Chartered Accountant experienced in senior
financial roles in the manufacturing, entertainment and marine sectors, with strong
financial, treasury and strategic expertise.
Evolution of our growth strategy
Our vision is to build a great New Zealand business
recognised as a world leader in creating value from
modern airports
Vision statement refined to reflect
our clear airport focus in line with
our core competencies.                                        CORE
                                                   Adding value to and enabling
Reflects today’s reality of our                 efficient movement of people and
                                                      goods between land and
interests in four airports.                            air side at our airports

Core competencies enable the                            ADJACENCIES
business to add value to the           Business activities closely related to, or leveraging off,
                                           our core airport business, such as investment
movement of people and goods at           property, accommodation, tourism, transport,
our airports and to further leverage                        advertising, etc

this through adjacent business
activities.

                                                                                                    3
Focus of our growth plan
To grow value in our airports for investors we will:
Further increase investment in air services
and market development to grow passenger
volumes faster than the market organic rate.
Expand and actively market the range of
products and services that benefit
passengers.
Strive for even more efficient passenger
processes.
Provide stimulus for property development
opportunities that create value in our land
holdings.
Leverage off revenue growth to deliver
increasing earnings per share to grow
dividends for shareholders.
4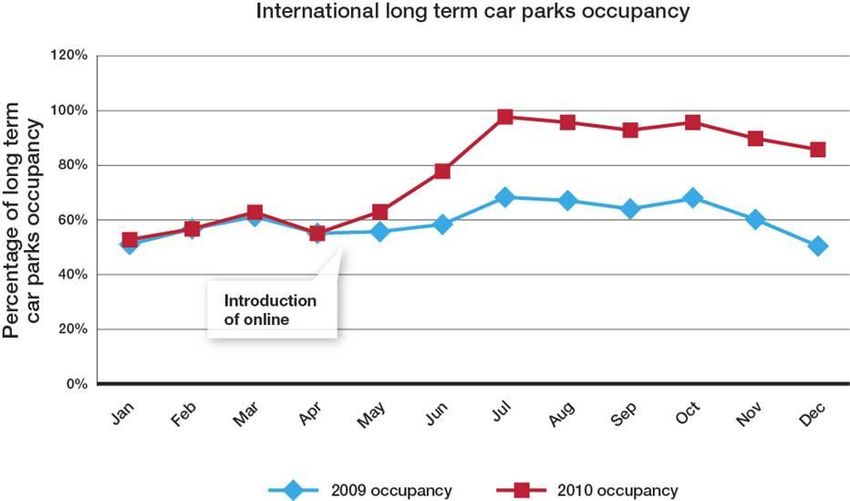
To deliver strong financial outcomes
                                                            6 months to 31   Growth over prior
                                                                 Dec 2010      corresponding
                                                                                   period (%)
 Revenue ($m)                                                      198.2                  8.7
 Earnings before interest, tax, depreciation, fair value
                                                                   151.0                  9.2
 adjustments and investment in associates (EBITDAFI) ($m)
 Underlying profit after tax ($m)                                    61.5                14.0
 Earnings per share (cps)                                             5.0                13.6
 Dividend cents per share (cps)                                       4.0                 6.7
 Total dividend paid ($m)                                            52.7                 7.9

 Our growth strategy, underpinned by a strong balance sheet, aims to
 deliver growing revenue and profit performance, to increase earnings per
 share and dividends per share for our shareholders.

                                                                                                 5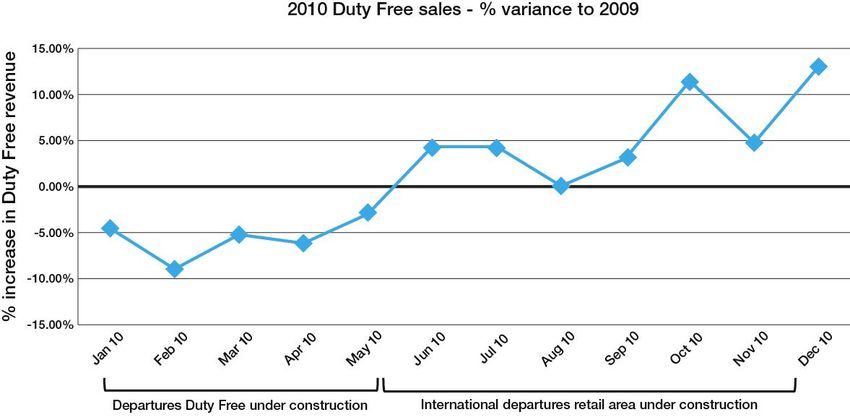
Changing shape of travel markets
Our Flight-path for Growth strategy                           % of international           6 months 6 months Growth on
launched in March 2009 had a significant                      arrivals by region           Dec 2010 Dec 2009    pcp
emphasis on Asia passenger growth.
                                                              New Zealand                    48.4%           47.8%           5.07%
“Rapidly developing markets are shifting
the industry’s centre of gravity to the East”                 Australia                      18.9%           19.6%          -0.09%
- Giovanni Bisignani, Director General of the International
Air Transport Association (“IATA”).                           Asia                           11.2%            9.7%          20.01%

Exposure to high growth markets is                            Europe                          8.6%            9.9%          -9.10%
essential and the link between air services
development and economic growth is clear.                     North America                   5.3%            5.7%          -2.84%

Asian passenger growth to NZ was 20% in                       Other                           7.5%            7.4%           5.76%
the six months to December 2010.
                                                              Source: Auckland Airport Monthly Traffic Update Report – December 2010,
                                                              compiled from information from Statistics New Zealand
China continues to be the highest growth
market with 30.1% growth in arrivals YTD
March 2011.

                                                                                                                                        6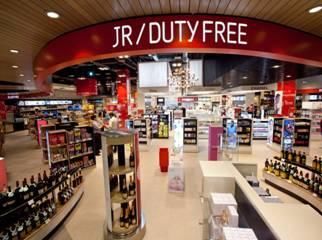
Our airports offer a low risk
exposure to high growth markets

  Source: Goldman Sachs Global Aviation Trends Report, 15 November 2010

                                                                          7
and we are proactively developing air
 services
Significant route development starting in 2011/2012
                                                                                       Annual
Airline                 Service        Airport            Route         Start Date   Capacity
China Airlines        New service     Auckland      Brisbane - Taipei     Jan-11       96,000
Emirates               Up-gauge       Auckland           Brisbane         Jan-11       72,000
Malaysia Airlines Increase frequency  Auckland       Kuala Lumpur        Mar-11        29,000
Jetstar               New service     Auckland          Singapore        Mar-11       220,000
China Southern        New service     Auckland         Guangzhou          Apr-11       68,000
Jetstar               New service     Auckland            Cairns          Apr-11       56,000
Thai Airways      Increase frequency  Auckland           Bangkok          July-11      60,000
China Southern    Increase frequency  Auckland         Guangzhou          Oct-11       90,000
Air NZ            Increase frequency  Auckland      Beijing, Shanghai     Dec-11       17,000
Continental           New service     Auckland           Houston           2012       138,000
Total new services from Auckland in the next 12 months                               846,000

Jetstar           Increase frequency    Cairns           Brisbane        Jan-11        55,000
Jetstar           Increase frequency    Cairns          Gold Coast       Jan-11        74,000
Jetstar           Increase frequency    Cairns            Sydney         Apr-11       129,000
Jetstar           Increase frequency    Cairns          Melbourne        Apr-11       129,000
Total new services from Cairns in the next 12 months                                 387,000

                                                                                           8
Impact of RWC 2011 on growing
international passenger numbers
A total of 85,000 international       Segment                                                         Visitor Arrivals

visitors are specifically expected    Supporters                                                                  74,800
for RWC 2011
                                      Visitors hosted by sponsors and suppliers                                    6,000
Visitors will generate more than
                                      Media                                                                        2,500
one arrival as some visitors fly in
and out multiple times for            Players, officials & VIP’s                                                   1,700

matches                                                                                                           85,000

Maximum of 43,000 visitors in NZ      Source: Preliminary Forecasts of International Visitor Activity in New Zealand during
                                      Rugby World Cup 2011 by Ministry of Economic Development dated March 2010
at any one time
Auckland peak demand is likely to     Auckland Airport natural market
                                      share (two way movements)
                                                                                                                120,000

occur on the weekends of 16 – 17      Rolling 12 month international                                          7,680,630
October (semi finals) and 22 – 23     passengers to Feb 2011

October (final)                       Growth attributable to RWC 2011                                               1.6%

                                                                                                                              9
Passenger update – March 2011
Total international passenger volumes
March 2011 Growth over prior
held firm post the Christchurch and Japan Financial Year to corresponding
earthquakes, increasing by 1.4% in the Date period (%)
Auckland Airport
month of March contributing to 4.8%
growth year to date. Significant growth International passengers 5,982,087 ↑ 4.8%
continued in China and India, and Jetstar Domestic passengers 4,621,047 ↑ 0.9%
Asia also commenced flights to Singapore China arrivals 102,447 ↑ 30.1%
in March 2011. Japan arrivals 54,462 ↑ 13.8%
Domestic passengers were up 0.9% year to India arrivals 23,105 ↑ 22.7%
date to March 2011 with decreased seat Queenstown Airport
capacity over March 2010 due to the International passengers 135,740 ↑ 49.1%
withdrawal of Pacific Blue. The current
Domestic passengers 598,618 ↑ 9.4%
domestic carriers (Air NZ and Jetstar) both
North Queensland Airports
experienced passenger volume growth.
Cairns international passengers 569,329 ↑ 25.5%
Queenstown Airport and Cairns Airport Cairns domestic passengers 2,419,388 ↑ 6.2%
both maintained strong growth in March
Mackay domestic passengers 781,870 ↑ 14.8%
2011 with year to date international
passenger growth of 49.1% in Queenstown
and 25.5% in Cairns.
10Outstanding retail performance
Major programme of retail expansion,
refurbishment and re-tenders combined
with new data driven retail capability
completed.
New tenants opened in the six months to
December 2010 include Icebreaker,
Moet, Apple, Swatch, MAC cosmetics,
and a Rugby World Cup store.
New tenants opened since January
include Zarbo, KFC and Silk Road.
Significant uplift in spend in the six
months to Dec 2010, with retail income
up 12.9% on prior year.
Growth has continued in Q3 to March
2011. Highly confident of surpassing
target retail revenue of $105m for FY11
(FY10: $95m).
11Car parking yield management
New online parking tool, Car park product offering at Auckland Airport
launched in May 2010, enables International Terminal Domestic Terminal Park & Ride
dynamic management of Proximate short-term and
long-term parking options
Multi-level car park with
direct connectivity into
Opened December 2008
parking product and price. terminal
2,928 public parking bays, 2,345 public bays 650 parking bays
Covered and uncovered Covered and uncovered Prominent location, 24/7
Yield and revenue in long term parking parking shuttle with GPS, high
security
car parks outstripping In addition, there are 2,330 staff car parks across domestic and international terminals
passenger growth. which can be leveraged for customer parking at peak times.
Long term car parking volume
increased 24.8% for the period
July 10 to Dec 10 compared to
passenger growth (excluding
transits) of 4.5%.
Car park revenue growth of
7.6% in the six months to Dec
2010, and we have seen this
growth continue in Q3 FY2011.
12Property development opportunities
Over 1,500 hectares of freehold land with
over 440 hectares potentially available for
commercial development.
Comprehensive land use plan published with
broader appeal to non-traditional airport
tenants.
Property kick-start strategy succeeded and
now well positioned to gain premium tenants
as market improves.
All current property development projects
are on time, budget and scope.
Novotel 4+ star hotel, outside the international terminal, open for business on 27 May
2011 – bookings already taken with sold out periods over RWC.
New $12.4 million, 4,965sqm warehouse and 1,780sqm office facility signed with Toll
Global Forwarding to be completed by April 2012.
Aspirational target is to grow property segment revenues from $30m FY09 base to
rent roll of $50-60m in FY14.
13Accelerating property success
Project Construction Value Auckland Airport Expected Completion
$m Construction Cost
$m
Aviation Security Office 5.9 5.9 Completed - July 2010
Mercedes Parts Warehouse 3.0 3.0 Completed – Feb 2011
Novotel Hotel 65.0 6.5 May 2011
DSV Air and Sea 3.8 3.8 May 2011
Aviation Travel and Training 3.5 3.5 Jun 2011
Formule 1 Hotel 15.5 15.5 Aug 2011
NZ Food Innovation Centre 7.9 7.9 Aug 2011
Quad 5: 4-level Office Building 14.3 14.3 Jan 2012
Toll warehouse and office 10.0 10.0 April 2012
Total 128.9 70.4
14Changing capital allocation
Capital Expenditure
Existing international aeronautical 160
infrastructure can accommodate significant 140
growth in aircraft and passenger movements 34.6
120
without further major improvements.
100
NZ$ million
34.2 31.0
2010 decision to further defer construction of 80
42.2
Northern Runway eases cost pressures on 60
108.3 65.0
customers and provides for a more optimal 40 75.3 74.4
42.0
delivery of future infrastructure needs. 20 45.4
20.0
12.3
-
Auckland Airport is currently strategically 2006 2007 2008 2009 2010 Planned 2011
focussing on investments in high value Non Aeronautical Capex Aeronautical Capex
property and retail development, with less
investment in aeronautical activities.
75% of the $85 million capital investments
planned for FY2011 are profit-oriented with
minimal maintenance capex required.
15Strong Balance Sheet
Debt maturity as at 31 March 2011
US Private Placement (USPP) US$150
400 million issuance confirmed in
350 December 2010 – first funding
Debt Maturity ($ million)
300 occurred in February 2011 and next
250 will occur in July 2011 to repay
200 maturing fixed bonds.
150
100 Long tenors of 10 and 12 years under
50 the USPP has extended Auckland
- Airport’s average debt maturity to
Less than 1 1-2 years 2-3 years 3-4 years 4-5 years Greater than 4.34 years (as at 31 March 2011.
year 5 years
Bonds Bank Facility - CBA Bank Facility - Syndicate Commercial paper USPP Interest expense reduced due to
higher exposure to low floating
• Debt is based on contractual maturities at par excluding mark to interest rates while managing interest
market valuations. rate risk (Average interest rate 6.66%
• Commercial Paper maturities are less than three months but are
supported by committed bank facilities that mature in March 2013.
in March 2011 compared to 6.89% in
• The above graph shows debt maturities after the repayment of $125 March 2010).
million Bank Facility in February 2011 and $75 million Bonds in July
2011 which have been refinanced with USPP debt issuance which has Strong S&P credit rating maintained
maturities of February 2021 ($64.8m), July 2021 ($65.6m) and (long term A-, short term A-2).
February 2023 ($64.8m).
16Earthquake impacts manageable
Significant impact on Christchurch and Japan, but impact on Auckland Airport, Queenstown
Airport and Cairns Airport is likely to be short and relatively modest.
Impact of Japan on Cairns likely to slow the very strong growth momentum experienced this
financial year.
Any adverse impact on New Zealand tourism market will be mitigated by a market response to
shift travel itineraries and by Auckland Airport’s diverse passenger base and multiple connectivity
options for travel itineraries. Business and Visit Friends & Relatives (“VFR”) travel unlikely to be
significantly impacted.
In the month of March 2011, New Zealand inbound tourist arrivals were down 11.4%, Christchurch
Airport’s international passenger numbers were down 22.5% but Auckland Airport’s international
passengers were up 1.4%, versus prior calendar period.
International Visitors by Reason 2010 International Visitors by Region 2010
Other
Europe
19.6%
Other 17.3%
11.3%
Visit
Friends/Relatives
33.7%
Business
10.9%
Australia
29.5%
Asia
20.9%
Holiday/Vacation
44.1%
North America
12.7%
Source: Statistics New Zealand. Data relates to international visitors arriving at Auckland Airport for Source: Statistics New Zealand data supplied by Auckland Airport. Data relates to international
the year ended 30 June 2010. visitors arriving at Auckland Airport for the year ended 30 June 2010.
17Supportive airport regulation in NZ
Dual-till regime with information disclosure requirements
• Aeronautical till: subject to limited competition and therefore regulated
• Non-aeronautical till: subject to open market competitive forces
New Zealand Commerce Commission monitors regulatory regime:
• Dual-till pricing environment
• Consultation on aeronautical charges at least every five years
• Consultation on capex decisions exceeding 20% of aeronautical asset base
• Annual information disclosure relative to the aeronautical asset base
Commerce Commission final determinations on disclosure and input methodologies issued
on 23 December 2010.
Majority of decisions in line with original draft determinations:
• Non-land assets as included in 2009 disclosures plus annual increase at CPI
• Land assets in the initial RAB established using Market Value Alternative Use ("MVAU")
• Future development land, assets under construction and land conversion costs
excluded from RAB
• Still information disclosure regime, dual till, and pricing not regulated
Auckland Airport is appealing the Commerce Commission’s final determination on input
methodologies for airport information disclosure regulation.
18Auckland Airport Master Plan –
Moving to a highly efficient future
Auckland Airport strives to balance supply with demand to optimise the
efficiency of existing infrastructure and deliver additional capacity when
needed.
Master plan moves to a dual-runway, integrated terminal design combining
domestic and international terminal facilities for high efficiency.
Master plan direction creates:
o Ability for lower airline cost structures
o Greater aircraft utilisation with swing gate facilities between domestic
and international
o Improved passenger experience in a new domestic terminal
o Improved use of technology and optimisation of processes and
facilities through Lean Six Sigma
o Greater retail, property and car parking opportunities with more
intensive passenger use in one location
1920
The case for investment
Low risk exposure to Asia–Pacific growth
story.
Ownership position in four airports all with
considerable upside potential.
Growth strategies succeeding in growing
passenger volumes, aero revenues, retail
yields and property rents and plenty more
to come
Strong Balance Sheet with diversified
sources of funding.
First half results stronger than expected
and long-term prospects for our airports
and the markets they serve are
strengthening.

                                               21
You can also read