August 2020 Update - Annual Compendium of Scottish Energy Statistics 2020 - The Scottish Government
←
→
Page content transcription
If your browser does not render page correctly, please read the page content below
Annual Compendium
                                                                  of Scottish Energy
                                                                  Statistics 2020

              August 2020
                   Update

Authors: Paul Matthews and Iain Scherr
Contact: energystatistics@gov.scot

                                         Published : 12/08/2020
Contents

“WHOLE SYSTEM” VIEW OF ENERGY

         RENEWABLE AND LOW CARBON SOLUTIONS

                 LOCAL ENERGY SYSTEMS

                          ENERGY EFFICIENCY

                                  CONSUMER ENGAGEMENT

                                              SYSTEM SECURITY AND FLEXIBILITY

                                                       OIL AND GAS

Page 2                                                                 Annual Compendium of Scottish Energy Statistics 2020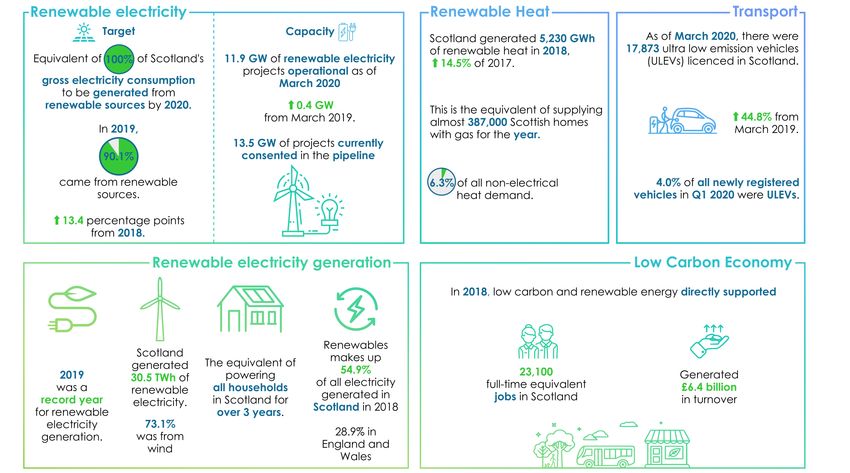
Introduction - Scottish Energy Statistics
 The Annual Compendium of Scottish Energy Statistics (ACSES) provides an overview of energy statistics for Scotland. It has been
 designed in line with the targets and priorities in the Scottish Energy Strategy. In 2019 ACSES replaced the Energy In Scotland
 publication.

 All statistics presented in the report are from published sources, including publications by the UK Department for Business, Energy
 & Industrial Strategy (BEIS), National Grid and the Scottish Government.

 The data in this publication is subject to revision. As such, further resources on Scottish energy statistics are available, and are
 updated on a quarterly basis with the latest figures. They can be found here and include:
 •       The Energy Statistics Hub is a new online interactive tool which is a ‘one-stop shop’ for all Scottish energy
         data. The Hub will be updated when new or revised data is available, so will always show the latest picture of
         Scottish energy statistics. Each page in the Hub has an interactive chart, commentary and data, with options to
         download charts and data. On each page in this publication, this icon in the top right corner is a clickable link
         to the relevant page in the Hub.
 •       Quarterly bulletins with Scottish specific figures from BEIS’s Energy Trends publications
 •       Renewable planning data provides data on renewable electricity projects in Scotland that are operational and in the
         pipeline

 If you would like to be updated about forthcoming statistical publications, please register your interest on the Scottish
 Government ScotStat website here.

Page 3                                                                                               Annual Compendium of Scottish Energy Statistics 2020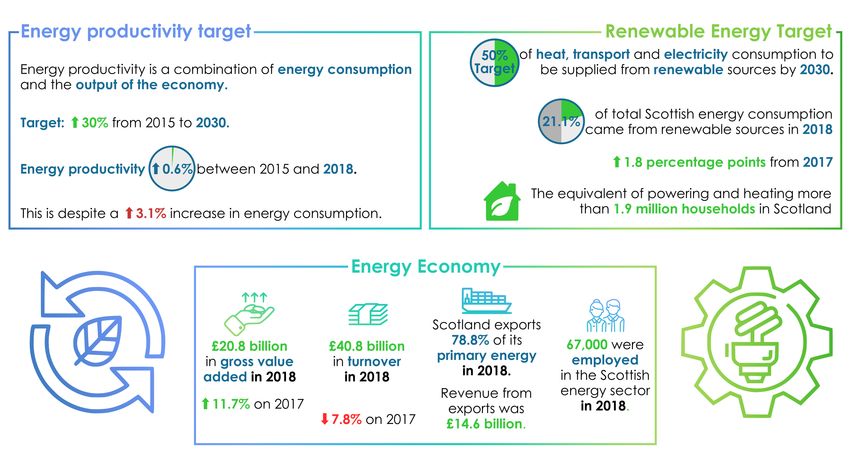
Introduction - Scottish Energy Strategy
In December 2017, the Scottish Government published the
Scottish Energy Strategy which sets out the Scottish
Government’s vision for the future energy system in
Scotland. It is guided by three core principles:

The Strategy is built around six energy priorities:

                   RENEWABLE AND
                                                              LOCAL ENERGY SYSTEMS                          ENERGY EFFICIENCY
               LOW CARBON SOLUTIONS

 Using Scotland’s renewable energy                                                        Improving the use and management of
                                                  Development of integrated local
 potential to meet heat, transport and                                                    energy in Scotland’s homes, buildings,
                                                  energy systems and networks within
 electricity needs in order to achieve                                                    industrial processes and manufacturing.
                                                  communities in Scotland.
 emissions reductions targets.

               CONSUMER ENGAGEMENT                                SYSTEM SECURITY                               OIL AND GAS
                  AND PROTECTION                                  AND FLEXIBILITY                          INDUSTRY STRENGTHS

  Protecting consumers from excessive or         Scotland’s capacity, connections,        Supporting investment, innovation and
  avoidable costs and promoting the              flexibility and resilience to maintain   diversification across the oil and gas
  benefits of smarter domestic energy            secure and reliable supplies of energy   sector to advance key priorities.
  applications and systems.                      to all homes and businesses.

This document summarises the key statistics in each of these areas in order to track
Scotland’s progress.
Page 4                                                                                       Annual Compendium of Scottish Energy Statistics 2020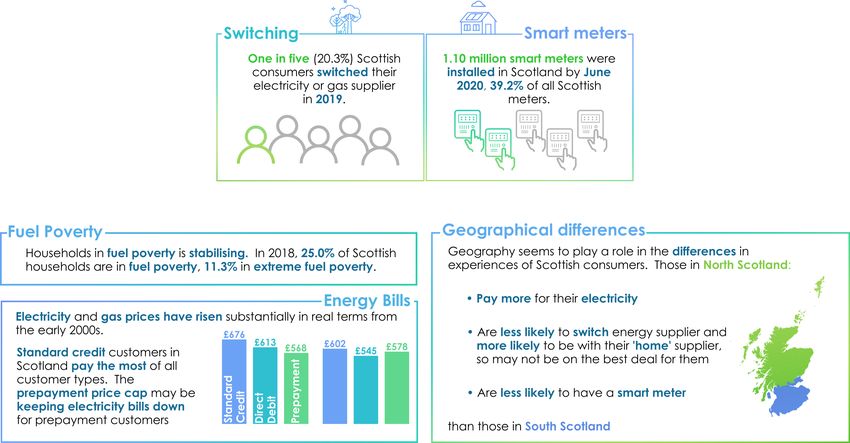
Whole system overview

Page 5                  Annual Compendium of Scottish Energy Statistics 2020
Renewables and low carbon overview

Page 6                               Annual Compendium of Scottish Energy Statistics 2020
Local energy systems overview

Page 7                          Annual Compendium of Scottish Energy Statistics 2020
Energy efficiency overview

Page 8                       Annual Compendium of Scottish Energy Statistics 2020
Consumer engagement overview

Page 9                         Annual Compendium of Scottish Energy Statistics 2020
Security of supply overview

Page 10                       Annual Compendium of Scottish Energy Statistics 2020
Oil and gas overview

Page 11                Annual Compendium of Scottish Energy Statistics 2020
Energy in real life

Page 12               Annual Compendium of Scottish Energy Statistics 2020
“Whole system”
view of energy
What does the “whole system” view of the Scottish                                                           Energy Consumption by Sector
energy system mean?
  One of the core principles of the Energy Strategy is that it advocates a “whole-
  system” view of energy in Scotland. This means that the focus of the Scottish
  Government’s energy policy covers heat and transport, alongside electricity
  and energy efficiency and the interactions between these sectors. It also
                                                    considers the interaction of
                                                    energy with the broader
                                                    economy and society.

                                                   A whole-system view means
                                                   that we should be considering
                                                   all sectors including domestic
                                                   and non-domestic (i.e.
                                                   industrial and commercial)
                                                   sectors. A breakdown of
                                                   electricity and heat consumption by sector shows that three-fifths of is
                                                   accounted for by the industrial and commercial sectors and two-fifths
                                                   consumed domestically.

Page 14                                                                                      Annual Compendium of Scottish Energy Statistics 2020
How do we measure Scotland’s ‘whole system’ energy
performance?
In order to measure the performance of Scotland’s energy system as a whole, the Energy Strategy identifies two whole-system
targets to be achieved by 2030:
Renewable energy:
THE EQUIVALENT OF 50% This is the amount of renewable energy generated in
OF THE ENERGY FOR Scotland as a percentage of Scottish gross energy
SCOTLAND’S HEAT, consumption. This includes renewable energy used for
TRANSPORT AND electricity, heat and transport. It is also one of
ELECTRICITY Scotland’s 81 indicators in the National Performance
Framework.
CONSUMPTION TO BE
SUPPLIED FROM
RENEWABLE SOURCES
Energy productivity:
This puts the emphasis on curbing energy consumption
while still growing the Scottish economy.
AN INCREASE BY 30% IN THE PRODUCTIVITY OF ENERGY
USE ACROSS THE SCOTTISH ECONOMY
The keys to meeting these targets will be to continue to grow Scotland’s renewable capacity and to reduce energy
consumption.
The following section tracks progress towards these targets .
Page 15 Annual Compendium of Scottish Energy Statistics 2020How is Scotland performing in terms of renewable
Renewable Energy Target
energy?
Scotland’s renewable energy target is calculated by the sum
of renewable electricity and heat generation and estimated
biofuel use in transport in Scotland, divided by Scotland’s gross
electricity consumption, non-electrical heat demand and
energy used for transport. Therefore, progress towards the
target will come from increasing renewable generation and
reducing energy consumption.
Provisional figures for 2018 indicate that 21.1% of total Scottish
energy consumption came from renewable sources; the
highest level to date. It increased from 19.3% in 2017.
Renewable energy generated increased by more than 2,500
GWh between 2017 and 2018. This includes over 1,500
GWh extra renewable electricity generated thanks to an
additional 0.7 GW installed capacity between 2017 and 2018,
mainly from onshore and offshore wind. Renewable electricity
contributes about four-fifths of all Scotland’s renewable
energy, followed by renewable heat and biofuels in transport.
The total amount of renewable energy generated in
2018 (33,652 GWh) is the equivalent of powering and heating
more than 1.93 million households in Scotland, assuming
average electricity and gas usage for households in Scotland.
Page 16 Annual Compendium of Scottish Energy Statistics 2020How is Scotland performing in terms of energy
Energy Productivity
productivity?
The 2030 energy productivity target is a measure of
the combination of energy consumption and the output of the
economy. It is measured by the gross value added* (GVA)
achieved in the economy from the input of one gigawatt hour of
energy. Higher energy productivity means you get more
economic activity for each unit of energy used, in other words,
squeezing more value added out of every unit of energy
consumed across the economy.
The target is a 30% increase in energy productivity by 2030 from a
baseline of 2015. This mirrors the improvement in energy
productivity between 2005 and 2015 (energy productivity
increased by 30.4% in this period, from £0.741m GVA per
GWh consumed to £0.967m). This was driven by reducing energy
consumption (down by 16.7%) and increased GVA (up by 8.6%).
Provisional figures for 2018 estimate that energy productivity in
Scotland is £0.972m GVA per GWh, 0.6% above the 2015
baseline. The reason for the slower progress from 2015 is
that energy consumption increased by 3.1% between 2015
and 2018. Energy productivity still increased because
Scottish GVA rose by 3.7% in this period. Compared to 2017,
energy productivity improved by 1.9% in 2018, mainly due to
growth in GVA.
*GVA used is adjusted based on chained volume measures.
Page 17 Annual Compendium of Scottish Energy Statistics 2020How can we represent all of Scotland’s energy system? Energy Balance We can represent Scotland’s entire energy system as an energy balance, represented as a Sankey diagram. This provides a global picture of energy in Scotland, showing the flow from inputs (indigenous production and imports), to transformation to outputs (exports, losses and consumption). The widths of the bands are proportional to the size of the flow they represent. It shows Scotland indigenously produces a vast amount of energy, and the majority of Scotland’s energy is eventually exported. An interactive version of the energy balance can be found in the Energy Statistics Hub Page 18 Annual Compendium of Scottish Energy Statistics 2020
What does Scotland’s energy balance tell us?                                                                              Energy Balance

 In 2018, Scotland’s total input to the energy system, or primary energy, was 1,243 TWh, rising for the fourth successive year.
 Indigenous production makes up 77.9% of this and 22.1% from imports. The vast majority (93.9%) of primary energy is from oil and
 gas, 1,167 TWh, up 4.6% on 2017.

 In terms of outputs, 78.8% of all primary energy was exported in 2018, 8.2% was lost in
 transformation and 13.1% is accounted for by end use consumption in Scotland.

Page 19                                                                                     Annual Compendium of Scottish Energy Statistics 2020
How important is energy to Scotland’s economy?                                                                                 Energy Economy

 Scotland’s energy (including renewables) sector was identified in Scotland’s Economic Strategy as one of the growth sectors in
 which Scotland can build on existing comparative advantage and increase productivity and growth. The sector is defined using
 the Standard Industrialisation Classification (SIC) 2007 codes which can be found here. Due to the sector definitions, the figures
 are not directly comparable with those on the low carbon and renewable sector or the oil and gas sector later in this document.
 Gross value added (GVA) for the Energy growth sector totalled £20.8
 billion in 2018, up 11.1% on 2017 to its highest level since 2013. This increase is
 driven by a 32.6% rise in GVA associated with extraction of oil and gas.
 Total turnover in the Scottish energy sector was £40.8 billion in 2018, down
 7.8% in nominal terms on 2017. This is largely attributable to some companies
 adopting new accounting standards in Annual Business Survey returns in 2018,
 therefore care should be taken when making comparisons over time to 2018.
 Total exports from the Energy growth sector stood at £14.6 billion in 2018,
 accounting for 17.2% of Scotland’s total exports. Exports from this
 sector increased by 5.4% over the latest year.

                                                                                       Employment in the energy sector stood at 67,000 in
                                                                                       2018, down from 69,000 in 2017. Scotland
                                                                                       accounted for 20.2% of employment in Energy
                                                                                       across Great Britain as a whole. Employment in the
                                                                                       energy sector is highly concentrated in the North-
                                                                                       East with 38.8% of all jobs in Aberdeen City and
                                                                                       13.4% in Aberdeenshire.

Page 20                                                                                            Annual Compendium of Scottish Energy Statistics 2020
Renewable and Low Carbon Solutions “We will continue to champion and explore the potential of Scotland’s huge renewable energy resource, and its ability to meet our local and national heat, transport and electricity needs – helping to achieve our ambitious emissions reduction targets”
What are low carbon solutions?

 Low carbon solutions come from the need to limit Scotland’s
 emissions given the increasing threat of climate change. By
 adopting low carbon means to generate power rather than
 relying on fossil fuels (i.e. coil, oil and gas), we can produce
 power with fewer greenhouse gas emissions. This will be critical
 for Scotland’s target of net-zero emissions by 2045 as outlined in
 the Climate Change (Emissions Reduction Targets) (Scotland)
 Act 2019.

 Low carbon solutions include renewables which are naturally
 occurring and inexhaustible, for example, wind, hydro, solar,
 tidal, biomass, energy from waste and geothermal. Low
 carbon solutions may also include nuclear electricity generation
 and electricity and green hydrogen solutions for heating and
 transport.

 In this section, we look at how Scotland has performed in terms
 of utilising low carbon and renewable sources across electricity,
 heat and transport, and what this means for emissions and
 Scotland’s economy.

Page 22                                                               Annual Compendium of Scottish Energy Statistics 2020
How is Scotland performing in terms of renewable
                                                                                                             Renewable Electricity Target
electricity?
The Scottish Government has a target to generate the
equivalent of 100% of Scotland’s own electricity demand
from renewable sources by 2020. This does not mean that
Scotland will be fully dependent on renewables generation,
but rather that renewables will form the key part of a wider,
balanced electricity mix.

In 2019, the equivalent of 90.1% of gross electricity
consumption* was from renewable sources, rising
from 76.7% in 2018. Much of this increase is due to wind; in
the last year there was an almost 1.0 GW increase in
wind capacity, which contributed to
approximately 3 TWh increase in electricity generation via
wind.

Scotland's ability to meet the 100% target by 2020 will
depend on how much renewable electricity generation
increases and gross consumption decreases in the next
year. As of March 2020, Scotland has 11.9 GW of
installed capacity operational with 13.5 GW in
the pipeline. How quickly these projects become
operational, how favourable the climate is for renewable
electricity generation and the extent to which gross
consumption falls in the next year could determine if the target is reached.
 * Gross electricity consumption refers to total electricity generation minus net exports

Page 23                                                                                     Annual Compendium of Scottish Energy Statistics 2020
How much renewable electricity does Scotland
Renewable Electricity Generation
generate?
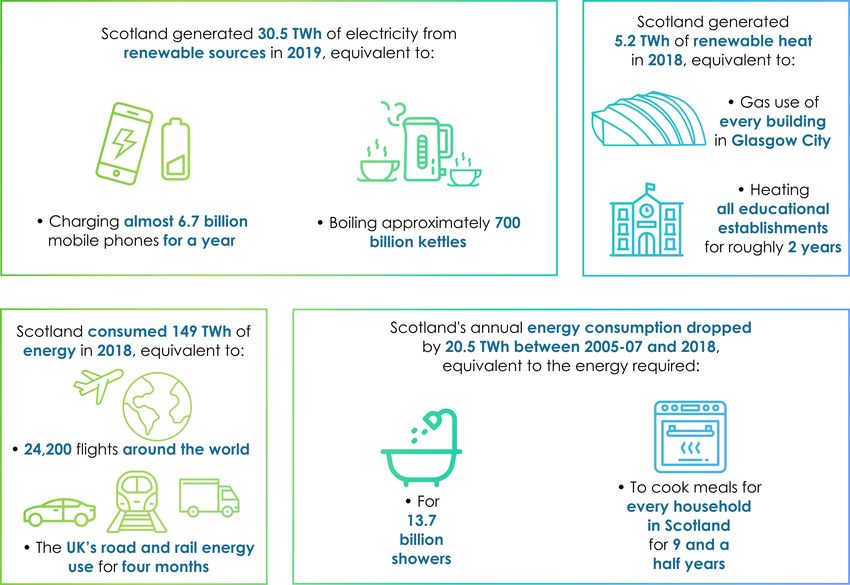
2019 was a record year for renewable electricity
generation in Scotland with 30.5 TWh generated, 13.6%
up on 2018. This is the equivalent of powering all households
in Scotland for over three years, or charging almost 6.7 billion
mobile phones for a year.
Scotland made up over a quarter (25.3%) of the UK’s
renewable electricity generation in 2019.
Scotland hit a new record high for quarterly renewable
electricity generation in Q1 2020, with 11.6 TWh generated
between January and March 2020. This is up 28% on the
same period last year, and is equivalent to about half of
Scotland's total electricity consumption. Increases in rainfall
and wind speed contributed to this - compared to Q1
2019, onshore wind generation is up 25%, hydro generation
is up 38% and offshore wind generation increased by 54%
The majority of Scotland’s renewable electricity generation
continues to come from wind (22.3 TWh in 2019). Offshore
wind grew substantially in 2019; 3.2 TWh was generated last
year via offshore wind, up from 1.4 TWh in 2018. This is due to
the Beatrice wind farm off the Caithness coast becoming
fully operational in May 2019.
Page 24 Annual Compendium of Scottish Energy Statistics 2020How much does renewable and low carbon electricity
Electricity Generation
generation make up of all of Scotland’s electricity generation?
The electricity generation mix in Scotland has significantly changed in recent
years driven by privatisation and subsidy schemes introduced to encourage
the development of low carbon and renewable technologies.
This has meant that the vast majority of the electricity that Scotland generates
is from low carbon sources, 83.1% in 2018, compared to 15.7% generated from
fossil fuels. However, electricity generation from fossil fuels increased in the
most recent year, up from 10.3% in 2017. Generation from natural gas reached
its highest point since 2011. Gas electricity generation may be making up for
a drop in nuclear electricity
generation (36.8% to 2017 to
28.2% in 2018) stemming from
long-term outages at Hunterston
B towards the end of 2018. As
such, nuclear generation is at its
lowest level since 2007.
The sources of electricity generation in Scotland have changed rapidly
since 2010 when approximately half of Scotland’s generation came from each
of low carbon sources and fossil fuels. The growth of renewables drove the increase
in low carbon generation, rising from 19.2% of all generation
in 2010 to 54.9% in 2018. National and international incentives, including
the Renewables Obligation and the EU Renewable Energy Directive, contributed
towards the increase.
Page 25 Annual Compendium of Scottish Energy Statistics 2020What comprises Scotland’s electricity generation? Electricity Generation Looking at the individual technologies for electricity generation in Scotland, wind (40.2%) contributes more than any other source to Scotland’s domestic generation, followed by nuclear (28.2%). By contrast, England and Wales use a significantly smaller proportion of low carbon (47.6%) and renewable (28.9%) sources for electricity generation than Scotland. Fossil fuels comprise half (49.6%) of England and Wales’ electricity generation, with gas making up most of this (43.7% of all generation). Page 26 Annual Compendium of Scottish Energy Statistics 2020
What is Scotland’s future for renewable electricity generation?                       Renewable Electricity Capacity

Scotland had 11.9 GW of installed renewable electricity
generation capacity operational in March 2020. This has steadily
risen over time, however, has levelled off since June 2019. Most of
Scotland’s operational capacity comes from onshore wind (8.4
GW), with offshore wind capacity growing rapidly (1.0 GW).

As of March 2020, 289 renewable electricity projects with a
capacity of 13.5 GW are in the pipeline. 1.3 GW of these are under
construction, most of which are offshore wind farms off the Moray
Firth. 7.7 GW are awaiting construction and 4.5 GW in planning.

Were all capacity in the pipeline to be delivered it would more than
double the level currently deployed, and could generate an
estimated 31.9 TWh of renewable electricity. It is worth noting,
however, that there are a number of factors that mean that
projects consented in the pipeline may not progress to
commissioning.

Page 27                                                                Annual Compendium of Scottish Energy Statistics 2020
What forms of renewable electricity does Scotland
                                                                                                                                     Renewable Electricity Sources
generate?
 Most renewable electricity generated in Scotland is from onshore wind. In 2019, Scotland generated over 19,000 GWh via onshore
 wind, 62.7% of Scotland's renewable electricity. This is the equivalent of powering all of Scotland's homes for approximately two
 years. Onshore wind capacity is 8.4 GW as of March 2020. Growth has been rapid; between 2009 and 2019, capacity and
 generation of onshore wind in Scotland more than quadrupled, with approximately 3,500 sites operational. It directly supported
 approximately 2,900 full-time equivalent jobs in Scotland and generated £2.08 billion in turnover in 2018. Onshore wind will
 continue to play a major role with 8.4 GW of projects in development in Scotland.
 Offshore wind is rapidly growing in Scotland - capacity saw a five-fold increase from 0.2 GW in June 2018 to 1.0 GW in March
 2020 with the Beatrice wind farm in the Moray Firth becoming operational in 2019. This led to 3,2 TWh of electricity generated via
 offshore wind in 2019, up from 1.4 TWh in 2018. Offshore wind is likely to play more of a role in the future; eleven offshore wind
 projects totalling 4.2 GW are in development. Five of these (totalling 1.0 GW) are currently under construction. Electricity
 generation via offshore wind may have generated £0.26 billion in turnover in 2018, but has directly supported
 approximately 1,700 full-time equivalent jobs in Scotland.

                                                                                                                              Pipeline
                       Capacity                 Generation                    Turnover                 Employees             capacity                    Sites

Onshore                     8,357                     19,143                      £2.08                                           8,401
                             MW                                                                              2,900                                         3,471
                                                       GWh                         bn                                              MW
  Wind

Offshore                     981                       3,183                      £0.26                                           4,174
                                                                                                             1,700                                            8
                             MW                        GWh                         bn                                              MW
  Wind
 Generation figures relate to 2019, turnover and employees figures are 2018, current and pipeline capacity figures
 are from March 2020.

Page 28                                                                                                              Annual Compendium of Scottish Energy Statistics 2020
What forms of renewable electricity does Scotland
Renewable Electricity Sources
generate?
Pipeline
Capacity Generation Turnover Employees Sites
capacity
1,650 5,362 £0.36 32
Hydro 700 747
MW GWh bn MW
Scotland has a long established base of hydro capacity; in 2000, installed capacity was 1,320 MW. By March 2020, this grew by
25% to 1,650 MW, the growth coming from small scale installations of less than 5 MW. The number of sites generating electricity
via hydro rose from 163 in 2003 to 747 in 2018. In 2019, Scotland generated almost 5.4 TWh via hydro, the equivalent of powering
more than half of Scotland’s homes for a year. This is up by 7.4% on 2018, possibly as a result of greater rainfall in
2019. Scotland accounts for 90.3% of all hydro generation in the UK.
While solar photovoltaics (PV) capacity in Scotland increased rapidly in the first half of this decade (2 MW in 2010 to 326
MW in 2016), progress has slowed in recent years, rising slightly to 365 MW by March 2020. This is likely to be due to the closure of
the Renewables Obligation accreditation to all solar in March 2017. As of 2018, there were over 58,000 solar PV installations in
Scotland. Solar PV generated 347 GWh of electricity in 2019, enough to power almost 89,000 Scottish homes for a year. There is
a further 382 MW of solar projects in the pipeline as of March 2020.
Pipeline
Capacity Generation Turnover Employees Sites
capacity
Solar 365 347 £0.07 382
300 58,163
PV MW GWh bn MW
Generation figures relate to 2019, turnover and employees figures are 2018, current and pipeline capacity figures
are from March 2020.
Page 29 Annual Compendium of Scottish Energy Statistics 2020What forms of renewable electricity does Scotland
Renewable Electricity Sources
generate?
Pipeline
Capacity Generation capacity Sites
Bioenergy / 2,472
516 MW 197 MW 186
energy from GWh
waste
Bioenergy and energy from waste accounts for 8.1% of all renewable electricity generated in Scotland in 2019 (2,472
GWh). There is almost 200 MW of bioenergy projects in the pipeline, the vast majority of which are energy from waste projects.
Current capacity of wave and tidal in Scotland is relatively small (22 MW in March 2020), but Scotland is leading the way in the
UK in this area - in 2018, 16 out of the 19 wave and tidal sites in the UK were in Scotland. It is also a developing technology;
projects totalling 350 MW are in the pipeline, including Brims Tidal Array in the Orkney Islands with 200 MW capacity alone.
Pipeline
Capacity Generation capacity Sites
Wave/ 16
22 MW 14 GWh 350 MW
Tidal
Generation figures relate to 2019, current and pipeline capacity figures are from March 2020.
Page 30 Annual Compendium of Scottish Energy Statistics 2020What about the size of renewable electricity installations? Renewable electricity capacity Half of the renewable capacity in Scotland comes from large installations of over 50 MW (6.2 GW in total). However, a total of 1.2 GW comes from small- scale installations of less than 5 MW. These projects are important as they are likely to contribute to the development of smart, decentralised and local energy markets in Scotland. This is made up of 433 MW of onshore wind, 338 MW of solar PV, 315 MW of hydro and 133 MW of bioenergy and waste. Page 31 Annual Compendium of Scottish Energy Statistics 2020
How does Scotland’s electricity generation impact grid
                                                                                                                             Grid Emissions
emissions?
The shift towards low carbon electricity generation had a profound impact on emissions. Each kilowatt hour of electricity
generated in Scotland in 2018 added an estimated 44.6 grams of carbon dioxide into the atmosphere (gCO2e/kWh), a sizeable
drop from 320.1 gCO2e/kWh in 2010. This was driven by both the increase in low carbon renewable generation and the closure of
Scotland's last coal power stations Cockenzie and Longannet in the last decade.
For the second year running, grid intensity is below the 50 gCO2e/kWh ambition for 2020 outlined in the Climate Change Plan. It is
also substantially lower than grid intensity in the UK as a whole (200.7 gCO2e/kWh). This is due to the greater low carbon electricity
generation in Scotland compared to the rest of the UK.
However, grid intensity in 2018 almost doubled from 24.0 gCO2e/kWh in 2017. This is due to a rise in gas used to generate
electricity in 2018, compensating for a fall in nuclear generation due to long-term outages at Hunterston B.

Page 32                                                                                        Annual Compendium of Scottish Energy Statistics 2020
How is Scotland performing in terms of renewable heat? Renewable Heat Target
Scotland generated 5,230 GWh of renewable heat across
approximately 25,550 sites in 2018, a record year for
renewable heat. This is the equivalent of supplying
almost 387,000 Scottish homes with gas for the year.
The 2009 Renewable Heat Action Plan set a target of
delivering 11% of Scotland’s non-electrical heat demand
from renewable sources by 2020. In 2018, the equivalent
of 6.3% of non-electrical heat demand was met from
renewable sources, up from 5.5% in 2017. The majority of
the rise this year is due to newly operational biomass and
energy from waste sites as well as an increased heat
output from over half of the existing biomass sites.
As in 2017, the majority of both capacity and output of
renewable heat in 2018 came from biomass primary
combustion and biomass combined heat and power
(CHP). Together, these technologies account for 1.66 GW
of capacity and 3,845 GWh of output. Energy from waste
makes up 19.6% of output and heat pumps 6.5%.
Almost half (46.8%, 2,450 GWh) of renewable heat output
comes from 100 large installations of over 1 MW. There are
seven installations that generated more than 100 GWh in
2018; together these sites provided 30% (1,571 GWh) of the
total renewable heat output in Scotland in 2018.
Page 33 Annual Compendium of Scottish Energy Statistics 2020How many people in Scotland have electric vehicles? ULEVs
The Scottish Government has announced its intention to
phase out the need for new petrol and diesel cars and vans
by 2032, and has supported adoption of ultra-low emission
vehicles (ULEVs). This term refers to electric, plug-in hybrid,
hydrogen fuel-cell vehicles and all vehicles with tail-pipe
emissions below 75 g/km of CO2.
As of March 2020, there were 17,873 ULEVs licenced in
Scotland, more than half of which are plug-in hybrid vehicles.
Even though ULEVs only make up 0.6% of all vehicles licenced
in Scotland, growth has been rapid; compared to twelve
months prior, ULEVs licenced rose by 44.8%.
The growth of ULEVs can be further illustrated by looking at
the proportion of ULEVs registered for the first time. This
increased from 0.2% of all newly registered vehicles in the first
quarter of 2014 to 4.0% in Q1 2020.
In 2019, there were 1,226 public EV charge points on the
ChargePlace Scotland network (CPS), up from 702 in 2017.
There were almost 647,000 separate charging events using
the CPS network in 2019, with 7.68 GWh provided.
Page 34 Annual Compendium of Scottish Energy Statistics 2020How does the low carbon and renewable energy sector
Low Carbon Economy
benefit the Scottish economy?
In 2018, the low carbon and renewable energy (LCRE)* sector directly supported 23,100 full-time equivalent jobs in Scotland. This
represents around 10% of employment in the UK LCRE sector. Most of this is made up of staff employed in energy efficiency (12,100
full-time equivalent staff) and low carbon electricity (6,800).
In 2018, the Scottish low carbon
and renewable energy economy
directly generated £6.4 billion. The
renewable energy part of the
LCRE sector is particularly
important in Scotland where it
accounts for more than half of
Scotland’s low-carbon turnover. In
contrast, renewable energy
accounts for around 35% of LCRE
turnover in the UK as a whole.
There has been strong growth in
exports by low-carbon businesses
in Scotland; rising from £225.5
million in 2015 to £377.5 million in
2018.
* The ‘renewable’ sector includes renewable electricity, heat and energy from waste and biomass. The ‘low
carbon’ sector includes nuclear electricity, energy efficient products, low carbon financial and advisory services,
low emissions vehicles, infrastructure, fuel cells and energy storage
Page 35 Annual Compendium of Scottish Energy Statistics 2020Local Energy Systems “We will empower our communities, supporting the development of innovative and integrated local energy systems and networks”
What are local energy systems?
Scotland has a history of developing local energy systems, especially in rural communities and the islands. An advantage of this
is that it moves away from centralised generation, which can be problematic for more remote locations. It also has benefits for
the communities themselves in terms of skills and financial benefits.
The Scottish Government has a number of initiatives designed to encourage businesses and communities to invest in local and
small scale renewables, for example, the Community and Renewable Energy Scheme (CARES), Resource Efficient Scotland and
the Home Energy Scotland Loan.
This section looks at Scotland’s progress to date on three specific initiatives:
• Community and locally owned renewables: this refers to installed electrical and heat
capacity owned by community groups, local authorities, housing associations and other
Scottish public bodies, charities, further and higher education establishments, local
businesses and Scottish farms and estates.
• Combined heat and power (CHP): schemes that capture heat from the electricity
generation process that would otherwise have been wasted and use the heat for
productive purposes
• District and communal heating: refers to a distribution system of insulated pipes that takes
heat from a central source and delivers it to a number of domestic or non-domestic
buildings
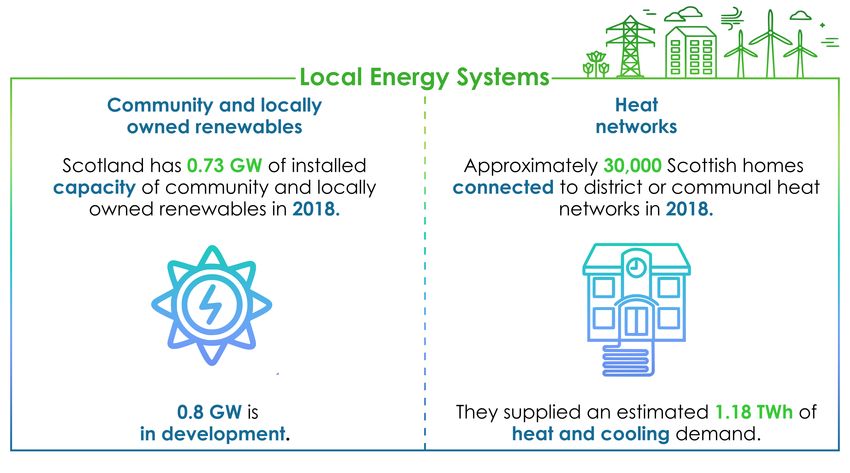
Page 37 Annual Compendium of Scottish Energy Statistics 2020How is Scotland performing in terms of community and
Community and Locally Owned Renewables
locally-owned renewables?
Targets were set for community and locally-owned renewables with the aim of having 1 GW of capacity by 2020 and 2 GW by
2030.
As of June 2019, 731 MW of community and locally owned capacity is operational. This is a small increase on 2018, and has more
than tripled from June 2012 when capacity was 204 MW.
The majority of operational community and locally-owned renewable capacity in
Scotland in June 2019 was from wind turbines (325 MW), followed by biomass (193
MW). These two technologies account for approximately 70% of overall operational
capacity in June 2019.
The 731 MW of total operational capacity is split between 428 MW (58.5%) of
electrical capacity and 256 MW (36.1%) of thermal (heat) capacity.
Projects totalling more than 794 MW are in development, including 43 MW under
construction and a further 225 MW consented but not built. If all consented projects
were operational (and there is no guarantee they will), capacity would be just shy
of the 2020 target.
Page 38 Annual Compendium of Scottish Energy Statistics 2020How is Scotland performing in terms of combined heat
Combined heat and power
and power?
In 2018, Scotland had 178 separate combined heat and power
schemes in domestic and non-domestic buildings, steadily rising
from 70 in 2005. In total, Scotland’s combined heat and power
schemes generated 6,155 GWh of heat in 2018 which would
have been wasted otherwise, a small decrease on last year.
While the number of CHP schemes in Scotland have increased,
the amount of heat generated has dropped by almost 2,300
GWh from its peak in 2005. This mirrors the UK wide trend of the
cessation of larger industrial based schemes that generate high
amounts of heat and the growth of smaller non-industrial
schemes.
Page 39 Annual Compendium of Scottish Energy Statistics 2020How is Scotland performing in terms of district and
District Heat Networks
communal heat networks?
The Heat Policy Statement published in 2015 set out two ambitions relating to district and communal heating in Scotland:
• To achieve 1.5 TWh of Scotland’s heat demand to be delivered by district or communal heating by 2020
• To have 40,000 homes connected by 2020.
Estimates suggest that there were almost 30,000 homes connected to district or communal heating networks in Scotland at the
end of 2018 meaning that Scotland is approximately three quarters of the way towards reaching 40,000 homes connected to
heat networks. In terms of new connections, the data up to end of December 2018 included 35 additional networks compared to
December 2017. Together these ‘new’ networks
supplied approximately 1,250 more homes than
2017.
An estimated 1.18 TWh of heat and cooling
demand is supplied via heat networks,
equivalent to 79% of the 1.5 TWh ambition.
It is worth noting that these data are
experimental statistics, and will continue to
improve in quality in time. There are issues with
some networks not providing supply figures and
others giving figures which appear to be
unreasonable. While efforts have been made to
correct these figures, the data should be
treated as broad estimates at this stage.
Page 40 Annual Compendium of Scottish Energy Statistics 2020Energy Efficiency “We will continue to take direct and supporting actions to improve the use and management of energy in Scotland’s homes, buildings, industrial processes and manufacturing”
What do we mean by energy efficiency?
Energy use underpins activity across all sectors in Scotland - business, domestic and public. It is also responsible for the major
share of Scotland’s greenhouse gas emissions, which contribute to climate change. By maximising the output from Scotland’s
energy inputs, energy efficiency offers a way to curb energy consumption without limiting growth and hence to reduce
emissions whilst still growing the Scottish economy.
The following section looks at two key metrics for energy efficiency:
• Demand reduction, and this is in terms of electricity, heat and transport,
and across the domestic and non-domestic sectors.
• Specific energy efficiency measures designed to retain heat in buildings,
for example insulation and boiler improvements.
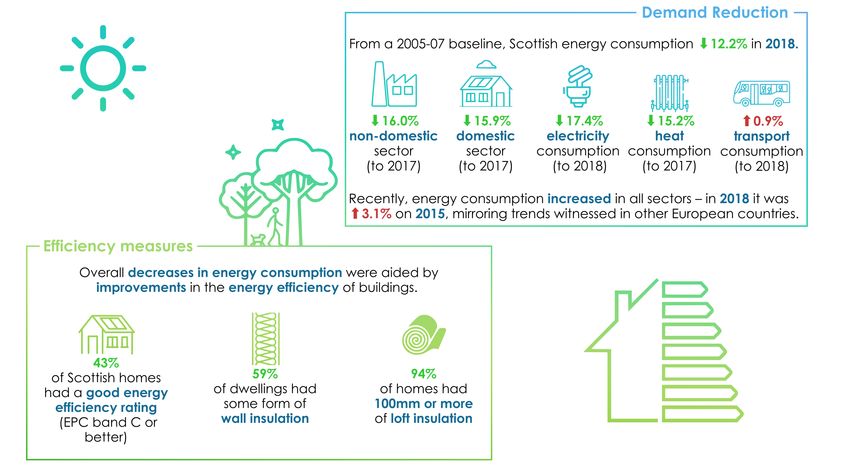
Page 42 Annual Compendium of Scottish Energy Statistics 2020How much energy does Scotland consume and how has
Energy Consumption Target
it changed?
The previous energy consumption target published in
the Conserve and Save: Energy Efficiency Action Plan in
October 2010 was to reduce Scottish final energy
consumption by 12% by 2020 from a 2005 to 2007 baseline
(169,588 GWh). Scotland met the target in 2013, seven years
early, and reached a record low of energy consumption
in 2015, 14.8% below the 2005-07 baseline. Energy efficiency,
the impact of the economic cycles, prevalent energy price
rises and weather patterns have all played a role in reducing
overall energy consumption by over 25,000
GWh from 2005 to 2015.
However, in recent years, 2017 in particular, Scotland’s energy
consumption increased – in 2018 up by 3.1% on 2015. This
mirrors trends witnessed across Europe, where energy
consumption increased between 2016 and 2017 in most
countries. In 2018, total final energy consumption
was 12.2% lower than the 2005-07 baseline. Scotland remains
within the target to reduce consumption by 12% by 2020.
This section takes a closer look at consumption patterns over
time in different sectors.
Page 43 Annual Compendium of Scottish Energy Statistics 2020How has Scotland’s energy consumption changed by
Energy Consumption
sector?
It is possible to break down the reduction
of Scotland’s total energy consumption
by sector, although the most recent data
for this refers to 2017 when consumption
was 12.1% lower than the 2005-07
baseline.
• Energy consumption in industry makes
up approximately a third of all Scottish
consumption (49.1 TWh). This is a 21.8%
reduction from the 2005-07 baseline,
but is a rise of 4.9% on 2016.
• Energy consumption in the domestic
sector is next largest at 44.7 TWh. This is
a decrease of 15.9% from 2005-07,
which may reflect improvements in
energy efficiency in the domestic
building stock in this time.
• Consumption in the commercial
sector rose by 8.2% from the baseline
to 16.4 TWh in 2017. Energy
consumption in transport also rose in
this period, up 1.1%.
Page 44 Annual Compendium of Scottish Energy Statistics 2020How has Scotland’s electricity consumption changed? Electricity Consumption Electricity consumption declined steadily in Scotland compared to the 2005-07 baseline, down by 17.4%. The difference in electricity used in 2005-07 and 2017 (5,103 GWh) the equivalent of more than half of the electricity used by Scottish households in 2017. This drop in electricity consumption is more pronounced in the domestic sector (20.4%) than the non-domestic sector (15.3%). In recent years, electricity consumption in Scotland has stabilised, registering a small increase of 0.2% from 2017 to 2018. This increase is concentrated in the non- domestic sector, where consumption increased by 2.6%, whereas it decreased by 3.2% in the domestic sector. Average electricity consumption per household in Scotland is 3,910 kWh, down by 26.2% on 2005-07. Average electricity consumption by household is significantly higher in the islands, because households are predominantly off the gas grid and therefore more likely to use electricity to heat their homes. Page 45 Annual Compendium of Scottish Energy Statistics 2020
How has Scotland’s heat consumption changed?                                     Heat Consumption

                                               Reducing heat demand is a key priority
                                               identified in the Scottish Government Heat
                                               Policy Statement published in 2015.

                                               Non-electrical heat demand follows a similar
                                               pattern to electricity; consumption
                                               steadily declined, dropping by 15.6% from 2005
                                               -07 to 2017. This decline may be a result of
                                               improved energy efficiency, improvements in
                                               the building stock, rising gas prices and rising
                                               temperatures.

                                               There is an aim published in the Climate
                                               Change Plan to reduce domestic heat
                                               demand by 15% and non-domestic heat
                                               demand by 20% between 2015 and 2032.
                                               However, non-electrical heat demand
                                               increased from 2015, up by 4.8%, more so in
                                               the non-domestic (6.7% increase) than the
                                               domestic sector (2.3% increase). This may be
                                               explained by lower gas and oil prices and
                                               unseasonal weather conditions.

Page 46                                                Annual Compendium of Scottish Energy Statistics 2020
How has Scotland’s gas consumption changed? Gas Consumption For gas specifically, consumption dropped by 20.4% overall from 2005-07 to 2018. The saving in gas consumption between 2005 and 2018 is the equivalent of almost half of the annual gas use in Scottish homes. Reduction in gas demand compared to 2005 is greater in the non- domestic sector (23.3% reduction) than the domestic sector (18.3% reduction). The average gas consumption per household dropped by 30.2% from 2005-07 to 2018. In this period, the number of households increased by 8.9%, which illustrates the role that energy efficiency measures and improvements in the building stock made in reducing gas demand. Despite the longer term decrease in gas consumption, it has stabilised in recent years. In 2018, gas use is 2.4% greater than its lowest point in 2016. Falling gas prices may have played a role in this. Average domestic gas consumption per household in 2018 is 13,522 kWh, down by 30.2% on 2005-07, and down by 1.5% on 2017. Average gas consumption by household differs by local authority, ranging from 10,803 kWh in the Western Isles to 18,074 kWh in East Renfrewshire. Page 47 Annual Compendium of Scottish Energy Statistics 2020
How has Scotland’s consumption in the transport sector
                                                                       Transport Energy Consumption
changed?

 While consumption in all other sectors
 declined since the 2005-07 baseline, it
 has increased slightly in
 the transport sector, up by 0.9% to 38,851
 GWh in 2018.

 The composition of Scottish transport
 energy consumption has changed over
 time:
 •   Consumption of fuel for personal road
     transport (buses, cars, motorcycles)
     has decreased by 6.2%. Conversely
     freight has increased by 15.6%.
 •   Consumption from diesel cars
     has increased by 64.7%, whereas
     consumption
     from petrol vehicles dropped by 34.4%
 •   Energy consumption from buses
     decreased by 23.8% including a 14.2%
     drop on 2017. Fuel consumption in rail
     rose by 6.4% from the baseline.

Page 48                                                  Annual Compendium of Scottish Energy Statistics 2020
How energy efficient are dwellings in Scotland? Domestic EPCs
Energy efficiency levels in the Scottish housing stock are monitored
using the Standard Assessment Procedure (SAP) and expressed as an
Energy Efficiency Rating (EER). These ratings are banded from A to G,
where A is a very efficient dwelling and G denotes a low energy
efficiency dwelling.
The Scottish Government’s Energy Efficient Scotland: Routemap sets
an ambition for 'every Scottish home to achieve at least a band C in
its Energy Performance Certificate (EPC) by 2040 (where technically
feasible and cost effective).
The methodology to assess of the energy performance of a dwelling
changed:
• SAP 2012 based on RdSAP (v9.93): This is based on the latest
methodology introduced in November 2017 and only data for
2018 is available. Under this measure, more than four in ten (43%)
Scottish homes were rated at least EPC band C.
• SAP 2012 based on RdSAP (v9.92): This allows for comparisons over
a longer period. Under this measure 44% of Scottish homes were
rated as EPC band C or better in 2018, similar to the previous year.
However, it is up from 35% in 2014.
By way of comparison, 34% of dwellings in England have an EPC
rating of C or better according to the 2018 English Housing
Survey (RdSAP changed to version 9.93 halfway through data
collection).
Page 49 Annual Compendium of Scottish Energy Statistics 2020What impact does wall insulation have on energy
Wall Insulation
efficiency?
In 2018, almost six out of every ten dwellings (59%) had some
form of wall insulation. This comes close to meeting the aim in
Scottish Government’s Climate Change Plan that 60% of walls
will be insulated by 2020. The proportion of dwelling with wall
insulation is similar to 2017, but the longer term trend shows an
increase (42% in 2007). Levels of wall insulation remain higher in
the social sector at 70% compared with 55% in the private
sector.
There is a big difference between cavity and solid wall
dwellings, however; 73% of cavity wall dwellings have cavity
wall insulation whereas just 19% of solid wall dwellings have
solid wall insulation in 2018. Both types of insulation have seen
longer term improvements but are unchanged on last year.
Between the CERT and ECO schemes, there were around
387,000 wall insulation measures installed by the end of 2018 -
approximately 318,000 cavity wall insulation measures and
69,000 solid wall measures.
We can look at the impact of wall insulation in terms of energy
consumption and cost savings using BEIS’ impact of
measures analysis. It looks at savings between the years 2016
and 2018 where wall insulation has been installed in
2017. Cavity wall insulation saved Scottish homes an average
of 1,300 kWh or 9.3% of energy consumption and solid wall
insulation saved 1,900 kWh or 12.1% of energy consumption.
Page 50 Annual Compendium of Scottish Energy Statistics 2020What impact does loft insulation have on energy
Loft Insulation
efficiency?
Loft insulation improved rapidly over the last
few years. In 2018, 94% of Scottish homes were
insulated to 100mm or more. This is unchanged
from 2017, but up from 73% in 2007. This can
largely be attributed to the installation of top-
up insulation in the early 2010s.
More than three-fifths (62%) of dwellings have
loft insulation of 200mm or more in 2018, a
substantial rise from 18% in 2007. This is still short
of the aim in Scottish Government’s Climate
Change Plan that 70% of lofts in the residential
sector will have at least 200 mm of insulation
by 2020.
30% of lofts were insulated to a high standard
of insulation (300 mm or more), outlining scope
for improvement to the highest level. This
proportion has remained about this level since
2015, following year on year increases
from 5% in 2010.
By 2018, government schemes (CERT and ECO) delivered around 480,000 loft
insulation measures in Scotland.
The impact of loft insulation in terms of energy saving is not as great as wall insulation;
the average saving in 2017 for Scottish homes was 200 kWh, or 1.7% of energy
consumption.
Page 51 Annual Compendium of Scottish Energy Statistics 2020What impact do boilers have on energy efficiency? Boilers Boilers in Scottish homes have been improving rapidly as well. In 2018, more than seven in ten (73%) dwellings had a condensing boiler and more than six in ten (62%) had a boiler that met the minimum efficiencies specified by the current Building Standards. The proportion of homes with these boiler types increased on 2017 (67% and 57% respectively). Average savings for installation of condensing boilers in Scottish homes are 1,000 kWh or 7.4% of energy consumption. It is worth noting that all of these energy efficiency savings do not take into consideration the “rebound effect”. This is where savings achieved through energy efficiency may be minimised by resulting changes in behaviour. For example, as a consequence of getting a new boiler, people may use it more often, and may increase their heat demand. Page 52 Annual Compendium of Scottish Energy Statistics 2020
Consumer Engagement
         and Protection
“We will work hard to protect consumers from excessive or
    avoidable costs, and promote the benefits of smarter
               domestic energy applications and systems”
What is consumer engagement and protection? Consumer engagement and protection is about placing the emphasis on the Scottish consumer and ensuring that they have a fair deal. To this end, it is important that consumers are informed, engaged and empowered, and that all consumers have equal access to make changes to the way they consume energy if they so desire. This will be increasingly important as the energy sector continues to evolve. To this end, in May 2019, Scottish Government issued its Energy Consumer Action Plan, which sets out a commitment to ensure consumers are at the heart of Scotland's energy transition. This section focuses on the following areas: • Energy prices and fuel poverty • Consumer choice and switching • Monitoring energy usage and smart metering Page 54 Annual Compendium of Scottish Energy Statistics 2020
How do Scottish consumers pay their energy bills?                                                        Energy Bill Payment Methods

The way in which customers pay their energy bills may be able to tell us
something about engagement and vulnerability of
customers. The majority of customers in Scotland pay by direct debit for
electricity and gas, and this has gradually risen from 44% in September
2005 to 64% in March 2020 for standard electricity, and
from 47% to 65% for gas. Customers paying by credit, that is paying on
receipt of their bill, has declined in the same period,
from 36% to 18% for electricity and 44% to 19% for gas.

                                                    Prepayment requires the
                                                    customer to make an
                                                    advance payment
                                                    before the fuel can be
                                                    used. Prepayment
                                                    customers tend to be
                                                    more likely to be in
                                                    vulnerable
                                                    circumstances than
                                                    customers who pay for their energy through other means. The proportion of
                                                    Scottish prepayment customers for electricity stabilised at
                                                    approximately 20% since 2005, suggesting that prepayment customers do
                                                    not tend to move to other payment methods. For gas it rose
                                                    from 9% in September 2005 to 16% in March 2020. The overall trend for gas
                                                    indicates that credit customers have been moving to direct debit and
                                                    prepayment.

Page 55                                                                                  Annual Compendium of Scottish Energy Statistics 2020
How have electricity prices for Scottish consumers
Electricity Bill Prices
changed?
Electricity prices have risen substantially in real teams for all
Scottish consumers compared to the early 2000s, with direct
debit customer prices increasing by over 75% from its lowest
point in 2003. This is even though electricity demand decreased
substantially from this point to the present day.
Prices had stabilised, however, in 2019 they increased each year
for the last three years for direct debit (up 20.3% in real terms
from 2016) and standard credit consumers (up 18.6% from 2016).
Prices for prepayment customers remained steady in this period;
this may be a result of Ofgem’s prepayment price cap that
came into force in April 2017. As such, prepayment customers
now pay on average the lowest electricity bills in
Scotland, 16.1% lower (based on 2010 prices) less than standard
credit customers who pay the most.
There are substantial differences in electricity prices between
North and South Scotland* – overall, North Scotland residents are
paying on average 6.0% a year more than South
Scotland residents, and pay the highest electricity bills of all
regions in the UK. This is likely to be a result of greater costs
distributing electricity to remote parts of Northern
Scotland. Electricity bills for South Scotland residents tend to be similar to the UK as a whole.
*North and South Scotland refer to the Public Electricity Suppliers (PES) regions. South Scotland includes the central belt
Page 56 Annual Compendium of Scottish Energy Statistics 2020How have gas prices for Scottish consumers changed? Gas Bill Prices
Like with electricity, average domestic gas
prices increased in real terms compared to
their lowest point in 2001; direct
debit and standard credit customers’ bills
almost doubled, and prepayment customers
increased by 78.4%. The cost of gas rose at a
faster rate than electricity. Scottish gas
prices peaked in 2014, and by 2019 dropped by
approximately 20% on this peak.
Direct debit customers have the lowest bills
in 2019 and standard credit the highest, 10.4%
more. Even though standard credit customers
have the highest bills, they dropped by 2.4%
from 2018 and 2019. In the same period,
prepayment customers increased by 7.9%.
Differences between bills in North and South
Scotland are negligible, and both regions are
marginally lower than the British total.
Page 57 Annual Compendium of Scottish Energy Statistics 2020How many households in Scotland are in fuel poverty? Fuel Poverty In July 2019 the Fuel Poverty (Targets, Definition and Strategy) (Scotland) Act received Royal Assent. This Act contains a new definition of fuel poverty: a household is in fuel poverty if, in order to maintain a satisfactory heating regime, total fuel costs necessary for the home are more than 10% of the household’s adjusted net income (after housing costs), and if after deducting fuel costs, benefits received for a care need or disability and childcare costs, the household’s remaining adjusted net income is insufficient to maintain an acceptable standard of living. Extreme fuel poverty follows the same definition except that a household would have to spend more than 20% of its adjusted net income (after housing costs) on total fuel costs and maintain a satisfactory heating regime. In 2018, 25.0% of households were estimated to be in fuel poverty, a similar level to 2017. The 2018 fuel poverty rate is likely to reflect changes in fuel prices, income and energy efficiency. 11.3% were living in extreme fuel poverty in 2018. The rate of extreme fuel poverty has been decreasing since 2013 (16.0%) and is the lowest rate recorded by the survey since 2012. Households who have gas as their primary fuel type are significantly less likely to be in fuel poverty. Just 23% of gas households are in fuel poverty, whereas 43% of households that use electric heating are fuel poor. Energy efficiency of homes is closely linked with fuel poverty; just 19% of households with an EPC band of B or C are fuel poor, compared to 29% at band D, 31% at band E and 35% at bands F or G. The Energy Efficient Scotland Routemap sets the aim for all homes with households in fuel poverty to reach EPC C by 2030 and EPC B by 2040 (where technically feasible and cost effective). A third (34%) of fuel poor households currently have at least EPC band C. Page 58 Annual Compendium of Scottish Energy Statistics 2020
Are Scottish consumers switching energy suppliers?                                        Energy Supplier Switching

In the last ten years, the number of electricity and gas suppliers
in the Scottish market increased substantially, meaning that
consumers have greater choice of supplier. However,
the largest six suppliers – Scottish Power, SSE, British Gas, E.ON,
npower and EDF – still collectively dominate the market. They
supply electricity and gas to 80.1% in North
Scotland and 74.6% in South Scotland. Based on market shares,
Ofgem classify other suppliers into medium and small – South
Scotland have a higher share of both than North Scotland.

However, switching of energy suppliers is growing in Scotland.
Between January and December 2019, switching rate for
electricity and gas in Scotland was 20.3%, a steady increase
from 14.0% in the twelve months ending May 2017. The
switching rate is now on par with Britain as a whole (20.5%),
whereas back in May 2017, switching was 2.7 percentage points
higher in GB. Switching is consistently higher in South
Scotland (21.2% in the twelve months ending December 2019)
than North Scotland (18.1%).

Even though the proportion of Scottish consumers switching is
matching GB levels, there remains a third (33%) of consumers in
Scotland who have never switched electricity or gas supplier
according to Ofgem's 2019 Consumer Engagement Survey. This
is higher than 27% in Britain as a whole.

Page 59                                                               Annual Compendium of Scottish Energy Statistics 2020
How much do Scottish consumers monitor their energy
Smart Meter Installations
use?
Scottish consumers have been increasingly monitoring their energy usage in
the last ten years. According to the Scottish House Condition Survey, the
proportion that say they closely monitor their energy usage has increased from
44% in 2008 to 58% in 2018.
The UK Government required supply companies to offer smart meters to their
customers to enable them to monitor their energy usage. Data from Electralink
suggests that as of June 2020, 1.1 million smart meters were installed in
Scotland, representing 39.2% of all meters in Scotland. This is up
from 9.7% in November 2016. Smart meter installations slowed since March 2020
as a result of the covid-19 lockdown, but showed signs of picking up in June as
a result of easing of lockdown restrictions.
Greater progress has been made in the smart meter rollout in South Scotland
compared to North Scotland – 43.3% of all South Scotland meters have been
installed compared to 28.3% in North Scotland. This may be a consequence of
the fact that North Scotland is more sparsely populated than South Scotland,
meaning that installing a large number of meters in North Scotland is more
challenging.
There is evidence to suggest that having a smart meter can make
consumers more aware of their energy use and make energy saving changes
as a consequence. According to Ofgem’s Consumer Engagement Survey, of Scottish
consumers that have a smart meter, almost six in ten (58%) say they monitor their energy
use more closely and they encourage others in the household to use less energy.
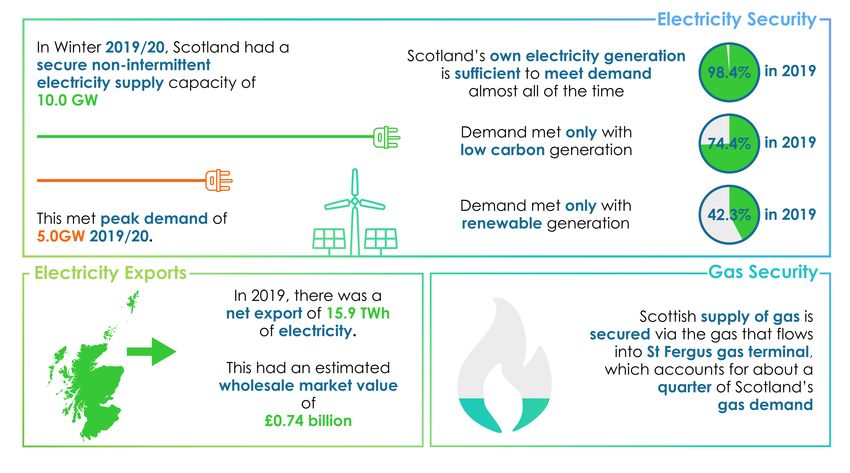
Page 60 Annual Compendium of Scottish Energy Statistics 2020System Security and Flexibility “Scotland should have the capacity, the connections, the flexibility and resilience necessary to maintain secure and reliable supplies of energy to all of our homes and businesses as our energy transition takes place”
You can also read