Austin Engineering Limited - FY18 Results Presentation 28 August 2018
←
→
Page content transcription
If your browser does not render page correctly, please read the page content below
Austin Engineering Limited
         FY18 Results Presentation
                        28 August 2018
Highlights
Underlying net profit after tax of $5.4 million, the outcome of extensive restructuring
✔
of the business and focused implementation of the turnaround strategy
Return to Profit
EBITDA up 62% on 30% lift in margins
Normalised EBITDA guidance of $25 million - $28 million for FY19
Refinance of the Australian debt facilities completed in November 2017
✔
Balance Sheet
continues to strengthen Further debt reductions planned in South America
Appointment of a Global Manager of Market Development and Innovation and
Global Manager Operations to the executive management team
✔
Board and Management
team appointments Appointment to the Board of CEO, Peter Forsyth as Managing Director and
Sybrandt van Dyk, a former CEO and Managing Director of Macmahon Holdings, as
Non- Executive Director
Product innovation as a result of Austin’s engineering and research and
Product innovation and development teams continue to provide clients with reduced operating costs
continuous ✔ Production Efficiency Group (PEG) global team established during 2H18 with key
improvement operations staff from each business unit. First collaboration workshop held in Perth
in July 2018
✔
Commodity cycle Commodity markets strengthened during the year, underpinning confidence in the
consolidating future and supporting investment in capital equipment
Closure of unprofitable sites, including Hunter Valley (NSW) workshop, Lurin (Peru)
✔
Rationalisation of loss workshop and Karratha (WA) site service branch
making businesses
Crane hire business in Chile identified as non-core and being marketed for sale.
Page 2 www.austineng.com.au
Contents

                                                                   Page

         1   Overview of FY18                                       4

         2   Strategy and Market Analysis                          17

         3   Outlook                                               20

             Appendices:
         4   - Competitive Advantage                               25
             - Operations
             - Products and Services

Page 3                                      www.austineng.com.au
1. Overview of FY18
Financial performance
Normalised results FY18 Revenue and profitability
($'m) FY18 2H18 1H18 FY17 Var %
Revenue 293.4 138.7 154.7 234.3 25% Revenue increased by 25.2% compared to FY17
Gross profit 73.4 36.1 37.3 71.1 3% − Strong growth in the Americas with revenue up 37.4%
Gross margin 25.0% 26.0% 24.1% 30.3% (18)%
EBITDA 23.2 11.0 12.2 14.3 62% Gross margins contracted from 30.3% to 25.0%
EBITDA margin 7.9% 7.9% 7.9% 6.1% 30% − A change in the geographical and product mix
Depreciation and amortisation (10.8) (5.4) (5.4) (11.2) (4)% − USA margin compressed due to constrained supply and
EBIT 12.4 5.6 6.8 3.1 300% increased prices for steel following the imposition of tariffs
EBIT margin 4.2% 4.0% 4.4% 1.3% 219% on key suppliers
Net interest expense (4.7) (2.3) (2.4) (5.2) (10)%
PBT 7.7 3.3 4.4 (2.1) ↑ EBITDA of $23.2 million, up 62%
Tax (2.3) (1.0) (1.3) 0.6 ↑ − Margins improved as a result of business improvement
NPAT 5.4 2.3 3.1 (1.5) ↑ activities and streamlining a number of business units,
particularly in South America
EPS (cents) 0.93 0.40 0.53 (0.27) ↑
Results reflect continuing and discontinued operations
− Improved recovery of fixed costs on increased revenue
base
Interest expense declined by 10% as debt continues to
be repaid and facilities refinanced in November 2017 on
more favourable terms.
Page 5 www.austineng.com.au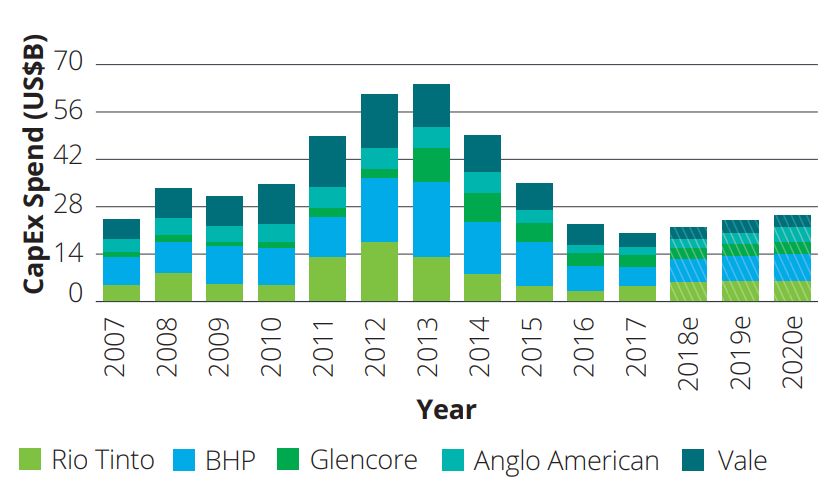
Financial performance
Statutory results FY18 Statutory earnings including impairments and
($'m) FY18 2H18 1H18 FY17 Var % one-off costs
Revenue 293.4 138.7 154.7 234.3 25% Impairment:
Gross profit 73.4 36.1 37.3 71.1 3% Impairment charges of $17.7 million reflect
Gross margin 25.0% 26.0% 24.1% 30.3% (18)% − $12.0 million impairment to Chilean crane and
Indirect costs (50.2) (25.1) (25.1) (56.8) (12)% lifting assets
Impairment (17.7) (17.7) - (19.8) (11)% − $4.7 million impairment to Australian Site Services
One-off costs (6.0) (3.9) (2.1) (2.2) 173% customer relationship intangible assets
EBITDA (0.5) (10.6) 10.1 (7.7) (94)% − $1.0 million to Aust Bore goodwill on acquisition
Depreciation and amortisation (10.8) (5.4) (5.4) (11.2) (4)%
EBIT (11.3) (16.0) 4.7 (18.9) (40)%
One-off costs:
Net interest expense (5.6) (2.3) (3.3) (6.1) (8)%
Staff restructuring costs in Hunter Valley, Peru and
PBT (16.9) (18.3) 1.4 (25.0) (32)%
Chile
Tax 5.0 2.4 2.6 (2.6)
Legal and consulting costs associated with refinancing
NPAT (11.9) (15.9) 4.0 (27.6) (57)%
Australian and USA debt facilities
EPS (cents) (2.06) (2.75) 0.69 (4.94) (58)%
Results reflect continuing and discontinued operations Interest expense includes refinancing costs of $0.9
million in 1H18, including termination fees payable to
previous financiers.
Page 6 www.austineng.com.au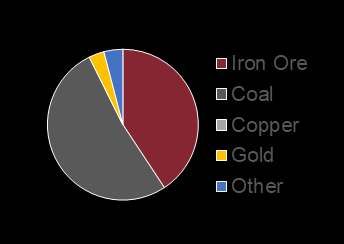
FY18 by region
Australia Australia ($'m) FY18 2H18 1H18 FY17 Var %
Brisbane
Perth Revenue 124.0 59.8 64.2 111.9 11%
Mackay
EBITDA (normalised) 7.9 3.6 4.3 9.5 (17)%
Hunter Valley
EBITDA margin 6.4% 6.0% 6.7% 8.5% (25)%
Operations
Perth operations contributed the highest normalised EBITDA in the Group
― Earnings from this business unit decreased relative to FY17 when a major
replacement cycle was delivered
Mackay operations doubled their revenue contribution in FY18 and lifted earnings
for the year as a result of improved demand for QLD coal
Aust Bore machining business delivered improved earnings from the prior year
Hunter Valley operations were closed on 30 June 2018 following an in-depth
review that concluded performance had not reached a sustainable level and it
would not make a sufficient positive contribution to Group results
Site services
Site services are now predominantly focussed on the Pilbara, WA region,
supporting Austin’s new product clients
Due to the competitive market environment in site services, Austin closed the
Hunter Valley, NSW business and the Karratha, WA branch during the year.
Page 7 www.austineng.com.au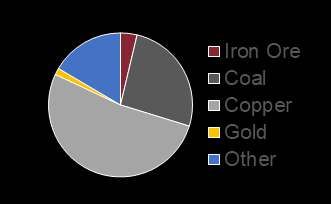
FY18 by region
Americas Americas ($'m) FY18 2H18 1H18 FY17 Var %
USA Revenue 154.4 72.0 82.4 112.3 37%
Colombia EBITDA (normalised) 11.0 5.6 5.4 1.7 ↑
Chile
Peru EBITDA margin 7.1% 7.8% 6.6% 1.5% ↑
USA
USA delivered the highest EBITDA contribution in the region in FY18, supported
by an order for the manufacture and supply of 76 bodies to the Bingham Canyon
copper mine in the first half
Earnings were maintained in the second half as a result of improved workshop
efficiencies and procurement outcomes
Colombia
Colombia maintained a positive earnings contribution on the previous period
Chile
Improvement in the copper market and cost efficiency savings resulted in this
business returning a positive EBITDA compared to a loss last year
Crane hire business, that is reported as a discontinued operation, contributed
$2.8 million in earnings for the year, however depreciation and amortisation
charges are $3.4 million
Peru
Peru business has refocused on the delivery of Austin’s core products, rather
than on-site service contracts
A reduction in indirect costs resulted in this operation breaking even for FY18.
Page 8 www.austineng.com.auFY18 by region
Asia ($'m) FY18 2H18 1H18 FY17 Var % Iron Ore
Asia Coal
Indonesia Revenue 22.4 11.3 11.1 17.4 29% Copper
EBITDA (normalised) 4.3 1.8 2.5 3.1 39% Gold
EBITDA margin 19.2% 15.9% 22.5% 17.8% 8% Other
Indonesia
Results from Indonesia have continued to be strong in FY18
Reduction of EBITDA in 2H18 due to a temporary adjustment in product mix
Capacity exists within this workshop to deliver improved EBITDA returns with
increased throughput
― Senior member of the Austin team appointed as the business development
lead in Asia and Africa to build sales capability.
Page 9 www.austineng.com.auFY18 Normalised EBITDA Bridge
$m
Australia Americas Asia
Page 10 www.austineng.com.auDiversified revenue
1 Revenue by region - % of total Comment
FY18 FY17
• Strong revenue growth in the Americas lifted this
region’s share to 53% largely due to strong performance
7%
7%
from the USA
40% Australia • Australia revenues increased by 11% as a result of
45%
Americas improved sales on the east coast of Australia
53%
Asia 48% ― Perth revenues lower relative to strong FY17
• Revenues in Asia grew in line with the Group
2 Revenue by commodity - % of total Comment
FY18 FY17
• Coal and copper contribution increased from 49% to
67%
5%
10%
18% Iron Ore
16%
― marked increase in new product sales in NSW
31%
Coal 4% and QLD coal
Copper ― increased copper revenue from the Americas
28% 19%
Gold
39% • Iron ore contribution fell from 31% to 18% due to
Other
30% Austin’s predominant exposure to iron ore through west
coast Australia that experienced a large replacement
cycle with a major client in FY17.
Page 11 www.austineng.com.auDiversified revenue
3 Revenue by customer type - % of total Comment
FY18 FY17
• Revenue from miners grew by 12% from FY17 however
reduced as a proportion of FY18 total revenue
4%
12%
Miners 8% • Work from mining contractors and OEMs has increased
6%
Mining
6% by 40% from FY17 as a result of improved client
8% contractors engagement and increased new product deliveries from
OEM's OEM partners
74%
Other 82%
4 Revenue by product and service - % of total Comment
FY18 FY17
• Truck body revenue increased from FY17, driven largely
Bodies
by the large order from Bingham Canyon in the USA
6%
13% Buckets 8% • Revenue from maintenance and repairs decreased as a
6%
Maintenance 41% direct result of restructuring activities in Peru, Chile,
45%
and repairs Hunter Valley (NSW) and Karratha (WA)
Crane rental
32% 41% • The increase in Other is from sales of water tanks,
Other predominantly in the USA, and mining infrastructure
4%
4% products in Indonesia.
Page 12 www.austineng.com.auWorking Capital
30 Jun 2018 31 Dec 2017 30 Jun 2017
Commentary
100.0 $m
Tight management of working capital has been
a key focus over the past two years.
80.0
60.0 Net working capital in FY18 has increased by
$8.3 million to $29.5 million due to:
40.0
Receivables (+11%) - growth in revenue (+25%)
20.0
Group Inventory (+17%) - increased to $37.1 million as
a result of growth of revenue and also work in progress
-
not able to be recognised as completed at year end
(20.0)
Group Payables (+4%) - supporting growth in
operations through improved procurement pricing,
(40.0)
together with reduced terms on USA steel supply.
(60.0)
(80.0)
30 Jun 18 31 Dec 17 30 Jun 17
Receivables 50.4 47.1 45.3
Inventory 37.1 25.5 31.6
Payables (58.0) (47.3) (55.7)
Net working capital 29.5 25.3 21.2
Page 13 www.austineng.com.auCash Flow
Cash flow ($'m) FY18 FY17 Var % $m
Historical cash flow from operating activities
5
Cash flows from operating
activities -
NPAT (11.9) (27.6) (57)%
Add: depreciation and amortisation 10.8 11.2 (4)%
(11)% (5)
Add: impairment 17.7 19.8
Movement in working capital (7.2) (14.4) (50)%
Other movements (8.2) (3.8) 116% (10)
Cash from/(used in) operations 1.2 (14.8) ↑
(15)
Cash flows from investing activities
Operating cash flow for the period was positive for the
Proceeds from sale of property, plant
and equipment 3.2 9.4 (66)% first time in two years, at $1.2 million, after:
Purchase of of property, plant and − investment in working capital ($7.2 million), and
equipment (3.2) (6.8) (53)%
− adjusting for other movements in NPAT
Cash used in investing activities - 2.6 (100)% ($8.2 million, mainly related to movements in
deferred and current taxation)
Cash flows from financing activities FY18 capital expenditure consisted of small
Proceeds from issues of shares - 8.0 (100)% replacement items funded from proceeds from the
disposal of surplus equipment, mainly in South America
Net inflow / (repayment) of borrowings 0.4 (4.6) (109)%
Cash provided by financing 0.4 3.4 (88)% Austin has two major capital projects (~$2.2 million)
underway for 1H19 to update key equipment
Net cash flows 1.6 (8.8) ↑ − Perth: new robotic welding machine
− USA: brake press.
Page 14 www.austineng.com.auBalance Sheet
Gearing Summary ($’m) 30 Jun 2018 30 Jun 2017 Commentary
Total Assets 223.8 231.5 • Net cash position of $5.6 million
Total Shareholders Funds 104.2 112.2 • Balance sheet restructured to support growth opportunities and
increase returns to shareholders
Facilities related to continuing and discontinued operations
• Net debt unchanged, gearing up slightly
Net Debt 45.9 45.6
Net Debt to Net Debt plus Equity 30.6% 28.9% ― Gearing reduced to 23% and net debt falls to $31 million after
adjusting for financial liabilities secured against assets within
discontinued operations
Facilities related to continuing operations only
• LIM and other non‐bank loans in Australia were repaid in November
Net Debt 31.0 45.6 2017 with longer term facilities
Net Debt to Net Debt plus Equity 22.9% 28.9%
Net Debt ($’m) and Gearing Net debt ($’m) 30 Jun 2018 30 Jun 2017
Senior debt (FY18 - term / FY17 - LIM) 12.5 20.1
$m
100 Australian working capital 10.0 7.3
90 40.0%
80 USA working capital 8.5 -
70
30.0% South American facilities – ongoing 5.3 5.8
60
50 South American facilities - discontinued 15.2 16.3
20.0%
40 Utilised facilities 51.5 49.5
30
20 10.0% Less cash (5.6) (3.9)
10 Net debt 45.9 45.6
0 0.0%
FY14 FY15 FY16 FY17 FY18 Unutilised facilities 15.1 5.2
Net Debt Discontinued operations
Gearing Continuing gearing
Page 15 www.austineng.com.auSafety and People
FY18 Safety statistics People
25 2,500
(per million hours worked)
20 2,000
Frequency rate
15
1,500
10
1,000
5
500
-
TRIFR LTIFR
-
30-Jun-16 30-Jun-17 31-Dec-17 30-Jun-18
Headcount
• Total Reportable Incident Frequency Rate (TRIFR) and • Headcount fell to 2,105 at 30 June 2018 from 2,173
Lost Time Injury Frequency Rate (LTIFR) both increased at 30 June 2017
― Standardised reporting of safety statistics implemented ― Rationalisations in Peru and Chile
across the business during the year resulted in an increase
• Headcount includes both permanent and flexible
in reportable incidents
staff, plus those on labour hire arrangements
• OH&S Global standards issued together with implementation
• The average tenure of qualified engineering staff is
of internal and external safety audit cycles
16 years across Austin’s Perth and USA teams,
• ICAM training programs delivered to the majority of business reflecting the depth of experience in product
operations to improve incident investigation and root cause innovation and customised solutions.
analysis
• Safety improvements set as a KPI for all Senior Leaders and
Business Unit Managers with commitment from all employees.
Page 16 www.austineng.com.au2. Strategy and Market Analysis
Strategic Priorities
Actions during FY18
To be the market leader supplying customised truck bodies
and buckets globally
Business operations re-oriented to provide clients with engineered solutions 40% increase in new product revenue from FY17
combined with high quality and efficient manufacturing capability
Client account management framework formally
Continued engagement plus strengthening of existing and new relationships with established from global to regional support
large global mining clients and contractors
Continued alignment with OEMs
Develop new and existing relationships with original equipment manufacturers
(OEMs), utilising the integrated sales function to provide better customer coverage
and foster relationships
Grow and diversify the business through identified
opportunities unique to Austin Engineering Team structured to provide dedicated
sales and manufacturing support to improve client
Leverage Austin’s product intellectual property (IP) to expand existing markets and service delivery
enter new markets
Utilisation of sub-contract manufacturing services
Innovation Team focused on research and development and new products continuing with full oversight of Austin’s quality processes,
to reduce client operating costs per tonne enabled Austin to grow its revenue base without
Grow approved sub-contractor base to provide additional revenue through flexible requiring additional capital
manufacturing capacity and production facilities where Austin does not currently have Fabrication work completed and in the pipeline for
an existing footprint non-Austin products
Pursue work in alligned industries utilising existing manufacturing capability
Maintain cost competitiveness Establishment of the Production Efficiency Group
(PEG), a global knowledge sharing group tasked with
Best practice operational performance and continuous improvement to manufacturing cost reduction strategies and manufacturing process
processes consistency
Remain at the cutting edge of engineering design, with fast, cost efficient techniques Analysis of growth capital expenditure projects,
used to manufacture high quality products expected to deliver cost savings
Continuous evaluation of global supply chain for savings through group wide supply Improved purchasing and terms globally with
agreements strategic steel suppliers
Page 18 www.austineng.com.auMarket Analysis
The Americas Australia Asia
• History of success with the • New designed JEC-LD truck • Batam is a world-class facility,
strong Westech product brand body has created new business meeting Austin’s global standards
opportunities
• Existing customer base, • Growth in local Indonesia market
particularly in USA, has loyalty to • Strong commodity prices have creating additional opportunities
Westech product due to its long created a supportive
term proven success environment • Optimal client outcomes are
achieved through large batch
• Alliances and contracts with key • Alliances with clients orders that incur reduced freight
customers costs
• Creation of new opportunities in
• Austin’s innovation and new the underground market • Opportunities to leverage facility
water tank design has opened and operational effectiveness, to
further opportunities • Long-term existing relationships diversify offering from Batam
with clients and continued facility into non-traditional
• Oil sands and copper markets product enhancements have built products
have improved strong loyalty and trust.
• Opportunities in Africa for new
• South American market has in products and site support allow
recent years had a bias to product to be manufactured in
allocating capital to repairing Batam.
equipment over new product.
Page 19 www.austineng.com.au3. Outlook
Industry Outlook
  1 Copper (USD/lb)                                                                                                    Commentary

                                                                                                                      • The copper price continued to rise in FY18, a trend
                                                                                                                        that began in 2016 following 5 years of declines, and
                                                                                                                        reflects strong industrial production and growing       27%
                                                                                                                        demand for energy infrastructure and technology
                                                                                                                                                                                 Copper
                                                                                                                      • Recent USA/China relations have impacted current prices
                                                                                                                      • Major producers are expected to unveil a range of
                                                                                                                        new mines and expansions over the next 2 years
                                                                                                                      • Rising industrial production and growing use of copper,
                                                                                                                        particularly from emerging fields in renewable energy and
                                                                                                                        electric cars, is expected to push prices up in 2019 and 2020

  2 Coal (USD/mt)                                                                                                      Commentary

                                                                                                                      • Thermal coal prices have been supported by strong
                                                                                                                        demand from Asia and constrained supply, rising
                                                                                                                        30% over the past year                                        37%

                                                                                                                      • The outlook to 2020 is for the spot price to fall from Coal
                                                                                                                        an average of US$99/tonne in 2018 to US$74/tonne for
                                                                                                                        thermal coal and from US$193/tonne to US$148/tonne for
                                                                                                                        metallurgical coal
                                                                                                                      • World trade is forecast to grow 10% by 2020 for metallurgical
                                                                                                                        coal and remain steady for thermal coal
                                                                                                                      • Improvements in pricing lead to increased capex requirements
                                                                                                                        from miners and mining contractors, resulting in more new
                                                                                                                        product sales into the east coast of Australia and on-going
                                                                                                                        enquiries for FY19 and beyond.
Sources: TradingEconomics.com, Office of Chief Economist – Resources and Energy Quarterly June 2018, uk.reuters.com

Page 21                                                                                          www.austineng.com.au
Industry Outlook
3 Iron Ore (USD/mt) Commentary
• Iron ore price in USD was volatile, range trading over 18%
the financial year US$60 – US$80
• The outlook to 2020 is for a gradual decline to around
US$51 as a result of moderating demand and growing Iron ore
supply, particularly from Brazil
• Austin’s highest exposure to iron ore is on west coast Australia.
In recent months, two new mines in the Pilbara region have
been announced by large global miners. This is a strong market
for Austin and for global revenue due to the quality of our
products in this application
4 Gold (USD/oz) Commentary
5%
• Since the end of the financial year, prices have
decreased mainly as a result of a strengthened USD
• World gold mine production is expected to reach a
peak of 4,631 tonnes in 2019, declining slightly in 2020 Gold
to 4,530 tonnes.
Sources: TradingEconomics.com, Office of Chief Economist – Resources and Energy Quarterly June 2018
Page 22 www.austineng.com.auIndustry Outlook
5 Top 5 Global Mining Companies CapEx Spend Commentary
• Capital expenditure by the world’s five largest mining companies
has yet to reach the levels experienced at the commencement of
the last major mining cycle
• Spending increases are forecast to rise, in contrast to the last 4
years as large miners have sought to extract maximum benefit
from spending in the 2011-2014 period
• Austin’s engineering enhancements during this period have lead
to a marked improvement in productivity for those clients that
have reinvested in their bodies and buckets.
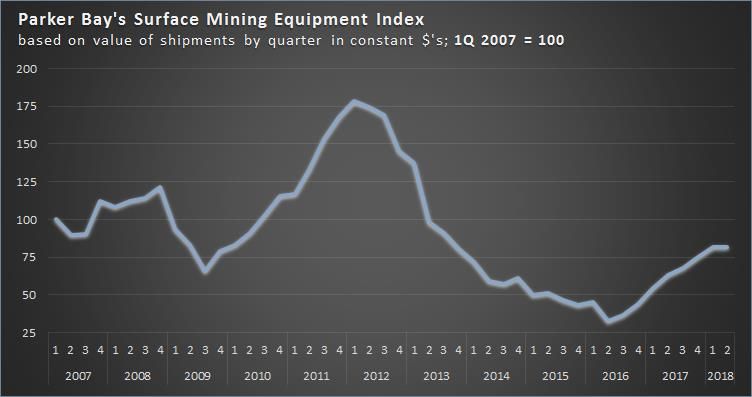
6 Parker Bay Surface Mining Equipment Index Commentary
• The Parker Bay Company’s Surface Mining Equipment Index
reflects the value of new equipment deliveries each quarter
• New equipment deliveries have consistently increased since 30
June 2016, however remain significantly below highs in 2012
• Austin grew its sales to original equipment manufacturers
(OEM’s) by 100% in FY18 from FY17. New equipment deliveries
are a key target market for Austin’s growth
• All OEM’s globally experiencing longer lead times for all new
mining equipment.
Sources: Deloitte – Mining capital projects: Are you ready for the next CapEx investment cycle?, The Parker Bay Company
Page 23 www.austineng.com.auFY19 Guidance FY19 Normalised EBITDA of $25 million to $28 million Based on the current order book, committed work, and tender opportunities Around 45% of projected revenue relates to firm orders and other committed work. This is similar to last year, however client tender book and pipeline opportunities are much stronger The new client account management strategy implemented during 2H18 provides greater confidence to conversion of the current tenders and pipeline opportunities into orders Manufacturing efficiencies and cost savings expected to be realised through the Production Efficiency Group, underpin the outlook for earnings growth FY19 guidance excludes contribution from the Chile crane hire business Whilst orders may be delayed or amended depending on client requirements, the strong pipeline and management initiatives gives greater confidence for improved results in FY2019. Page 24 www.austineng.com.au
4. Appendix:
- Competitive advantage
- Operations
- Products and services
Competitive advantage
Market leading position Visibility over orders
Large global producer of custom truck High visibility over orders for the next six
bodies and buckets months
Strategically located across four Recurring revenue from repairs and
continents including Australia, Asia and maintenance contracts
the Americas, with scope to use
subcontractors in other regions
Diversified revenue base
Long term relationships with key
Attractive fundamentals
customers across Austin’s various
Improving conditions in commodity geographies/products/commodities
markets Key contracts with leading miners,
Product sales have improved as the contractors and OEMs
investment cycle has turned Creating additional manufacturing
Quality product design for specific opportunities outside of our core business
purpose
Strategic focus Products
Business repositioned as an engineering Customised range of mining products and
solutions provider supported by product Manufacturing excellence services tailored to specific site
manufacturing IP and engineering excellence built up conditions, that continue to deliver
Focus in global miners with long-term over more than 30 years of experience increased productivity and lower
partnerships as a “preferred” supplier Fabrication workshops fitted out for safe operating costs
Creating future product advantages for all and efficient manufacturing Improved product designs are equally
products on surface and underground suitable for installation onto new and
existing equipment
Page 26 www.austineng.com.auOperations
Located on the east and west coast, providing an array of manufacturing, repair and
support services
Perth is the largest workshop in Australia
Mackay is focussed on body/bucket repairs and maintenance
Australia Hunter Valley operations closed during the year, with new product supplied to the
Brisbane
Perth NSW region through approved sub-contractor arrangements
Mackay
Hunter Valley Austin Site Services supports customers with on and off-site repair and maintenance
services across Australia
Aust Bore offer specialised machining services, overhaul of track frames and other
mining equipment, as well as mobile line-boring services
The corporate office is located in Brisbane
The USA facility provides manufacturing and engineering services to customers in
USA, Central America and Europe. This facility is home to the Westech brand
Americas
USA Colombia is situated in Barranquilla, one of the main coal mining hubs of the country
Colombia
Chile
Chile has two workshops strategically located close to customers in Antofagasta and
Peru Calama
Peru workshop is located in Arequipa close to the key copper mining region
Located close to the port facilities in Batam, Indonesia, on one of the world’s busiest
shipping routes only 20 kilometres away from Singapore
Asia
Indonesia
This fully equipped modern workshop manufactures both Austin products (including
bodies, buckets and water tanks) and non-Austin products (including large modular
structures and underground mining chutes).
Page 27 www.austineng.com.auProducts and services
Austin Engineering
Products Services
Leading designer and manufacturer of customised A complete service provider, offering on and off-site
dump truck bodies, buckets and ancillary products repair and maintenance and heavy equipment lifting to
used in the mining industry customers including miners, mining contractors and
Core competitive strength in engineering knowledge, original equipment manufacturers
experience and IP to design customised products that Workshop based repair and maintenance services for
provide compelling productivity gains for clients mobile equipment and attachments, along with onsite
The ability to manufacture these products at its asset management of equipment and fixed plant
operations located in key mining regions around the
world, or to use approved sub-contractors
Page 28 www.austineng.com.auDisclaimer This presentation has been prepared by Austin Engineering Limited (ABN 60 078 480 136) (“Austin” or the “Company”). The information in this presentation should be read in conjunction with Austin’s continuous disclosure announcements. The information is of a general nature and has been prepared by Austin in good faith and with due care but no representation, warranty or assurance, express or implied is given or made as to the fairness, accuracy, adequacy, completeness or reliability of any statements, estimates or opinions, conclusions or other information contained in this presentation. You should also be aware that any forward looking statements in this presentation are subject to inherent risks and uncertainties. Those risks and uncertainties include factors and risks specific to the businesses of Austin as well as general economic conditions and conditions in the financial markets. Actual events or results may differ materially from the events or results expressed or implied in any forward looking statement and such deviations are both normal and to be expected. No relevant party makes any representation or warranty (either express or implied) as to the accuracy or likelihood of fulfilment of any forward-looking statement, or any events or results expressed or implied in any forward-looking statement, and you are cautioned not to place undue reliance on these statements. The forward-looking statements in this presentation reflect views held only as at the date of this presentation. Subject to any continuing obligations under applicable law or any relevant ASX listing rules, Austin also disclaims any obligation or undertaking to provide any updates or revisions to any forward-looking statements in this presentation to reflect any change in expectations in relations to any forward-looking statements or any change in events, conditions, circumstances, expectations or assumptions on which any such statement is based. Nothing in this presentation shall under any circumstance create an implication that there has been no change in the affairs of Austin since the date of this presentation. The information in this presentation does not constitute financial product advice (nor investment, tax, accounting or legal advice). Investors must not act on the basis of any matter contained in this presentation, but investors must rely on their own independent assessment, investigations and analysis of Austin. Investors should obtain their own professional, legal, tax, business and/or financial advisors before making any investment decision based on their investment objectives. Due care and attention should be undertaken when considering and analysing the financial performance of Austin. All amounts are presented in Australian dollars unless otherwise stated. This presentation includes certain terms or measures which are not reported under International Financial Reporting Standards (IFRS) including, but not limited to, ‘underlying’ and ‘normalised’. These measures are used internally by management to assess the performance of the business and make decisions about the allocation of resources. These non-IFRS measures have not been subject to audit or review. Refer to Austin’s published financial results to ASX for financial information presented in according with IFRS standards. Each recipient of this presentation or any entity or person receiving this document represents, warrants and confirms that it accepts the above conditions. This presentation and the information contained in it does not constitute a prospectus or product disclosure statement, disclosure document or other offer document relating to Austin under Australian law or any other law. This presentation is not, and does not, constitute an offer, invitation or recommendation to subscribe for, or purchase, securities in Austin. Page 29 www.austineng.com.au
You can also read


