AUSTIN STRATEGIC HOUSING BLUEPRINT - www.austintexas.gov/housingplan
←
→
Page content transcription
If your browser does not render page correctly, please read the page content below
NEIGHBORHOOD HOUSING
                                                  AND COMMUNITY DEVELOPMENT

AUSTIN
STRATEGIC
HOUSING BLUEPRINT

www.austintexas.gov/housingplan
        03 www.austintexas.gov/housingblueprint
AUSTIN STRATEGIC
          HOUSING BLUEPRINT
By adopting the Austin Strategic Housing Blueprint, City Council demonstrates its commitment to
implementation of the Blueprint. However, every action item listed in this Blueprint will require
separate and specific implementation. Adoption of the Blueprint does not begin the implementation
of any item. Approval of the Blueprint does not legally obligate the City to implement any particular
action item.
Table of Contents
Executive Summary............................................................................................................................................ 02

Purpose ............................................................................................................................................................. 03

Affordability Definitions .................................................................................................................................... 04

Community and Stakeholder Engagement Summary ...................................................................................... 05

What is the Need? ............................................................................................................................................ 06

        Growth in Low-to Moderate-Paying Jobs . .............................................................................................. 07

        Future Housing Demand ......................................................................................................................... 08

        Equity, Integration, and Diversity............................................................................................................. 11

        Regional Housing Need ........................................................................................................................... 12

        Crucial Partnerships: Public Housing Authorities.................................................................................... 13

        Past Efforts to Increase the Supply of Affordable Housing ..................................................................... 13

Affordable Housing Goals ................................................................................................................................. 14

Key Actions to Support Community Values ...................................................................................................... 19

        Prevent Households from Being Priced Out of Austin . .......................................................................... 20

        Foster Equitable, Integrated, and Diverse Communities ........................................................................ 23

        Invest In Housing for Those Most In Need . ........................................................................................... 25

        Create New and Affordable Housing Choices for All Austinites in All Parts of Austin . ......................... 29

        Help Austinites Reduce their Household Costs . .................................................................................... 36

Appendix A: Methodology of 10-Year Estimates . ............................................................................................ 40

Appendix B: Implementation Matrix ................................................................................................................ 42

Appendix C: NHCD 2016-2017 Department Goals .......................................................................................... 46

Appendix D: Glossary of Commonly Used Terms ............................................................................................. 47

Appendix E: Community Outreach ..................................(Available at www.austintexas.gov/housingblueprint)
A
  COMPREHENSIVE
  APPROACH
  to Address Austin’s Most Pressing Affordability Challenges

Executive Summary
From 1970 to 1990, Austin was one of the most affordable cities in the country.1 However, Austin has rapidly become
less affordable in the last few years for many residents, including Austinites who embody the city’s character and who
provide critical services in the community. The city’s growing economy and vibrant cultural assets continue to attract
businesses and families, creating a steady population increase. Subsidies alone cannot close the growing affordable
housing gaps or provide households with more affordable housing and transportation choices. While Austin’s afford-
ability issues are complex, implementing the Austin Strategic Housing Blueprint can help the community address these
issues in a more cost effective and efficient manner. By utilizing a multifaceted set of coordinated strategies, the City of
Austin can work with partners to effectively address these challenges and reach our community’s affordability goals.

In the broad community outreach undertaken to develop the Austin Strategic Housing Blueprint – including 30 public
meetings, a statistically valid survey, and outreach to underrepresented groups – Austinites noted that affordability is
not just defined by the price of housing, but also by where one lives and if one has access to daily needs and oppor-
tunities. This document is informed by the March 31, 2017 Mayor’s Task Force on Institutional Racism and Systemic
Inequalities which states: “We believe that policies implemented by the City of Austin over time, combined with proce-
dures created and carried out by other local institutions, caused people of color, particularly Blacks, to be segregated
into the eastern parts of the city and limited their access to many things necessary for upward mobility.”

By aligning with the City’s Imagine Austin Comprehensive Plan and CodeNEXT revision of the Land Development Code,
the Strategic Housing Blueprint recommends approaches to address these interconnected issues comprehensively.

The Blueprint includes goals for affordable housing in every City Council district to ensure that there is affordable hous-
ing throughout the city. It also includes goals for the construction of 60,000 housing units affordable to households at
80% median family income (MFI) and below, and another 75,000 units for households earning greater than 80% MFI
broken into specific goals for households at different income levels. In addition, the Blueprint includes five community
values with key recommended actions the City could take to support them:

 • Prevent Households from Being Priced out of Austin: Support legislation to allow flat dollar-amount Homestead
 Exemptions, create a preservation property tax exemption for properties to minimize displacement of low-income
 renters, expand the use of shared-equity ownership and mechanisms to preserve and create ownership options for
 households at 80-120% MFI, and invest in preservation strategies to combat gentrification.

 • Foster Equitable, Integrated and Diverse Communities: Promote strategic investments and create protec tions for
 low-income renters by developing a strike fund to preserve multi-family buildings to retain affordable housing units,
 implement Austin’s Fair Housing Action Plan, bolster enforcement of Fair Housing requirements, and undertake stra-
 tegic land banking for affordable housing.

  1
      Elvin Wyly, Norman Glickman, & Michael Lahr, “A Top List of Things to Know About American Cities,“ HUD Journal of Policy Development and Research, 1998.

      02 www.austintexas.gov/housingblueprint
• Invest in Housing for Those Most in Need: Pursue future General Obligation Bonds and local fund appropriations for
     affordable housing, leverage low-income housing tax credits, challenge the private sector to fund affordable workforce
     housing, maximize the use of public properties for affordable housing, and expand housing for people with disabilities.

     • Create New and Affordable Housing Choices throughout Austin: Use the affordable housing goals in this plan to
     guide policy, implement consistent density bonus programs, streamline City codes and permitting processes, better
     utilize land for affordable housing, revise the S.M.A.R.T. Housing Program, relax regulations on affordable housing prod-
     ucts (including cooperatives and Accessory Dwelling Units), and create a Multifamily Property Tax Exemption Program.
     • Help Austinites Reduce Household Costs: Connect housing with transportation choices, increase efforts to help
     households to reduce utility costs through weatherization of current residences, and ensure that future housing devel-
     opments are close to healthy grocery stores, health care services, and social support agencies.
It is important to note that there are other issues that impact affordability - such as utilities, taxes, transportation, and
healthcare costs- that are outside of the scope of this plan, and rely on the actions of other governmental, non-profit, and
private entities. The Austin Strategic Housing Blueprint provides a roadmap for Austin to maximize the most impactful op-
portunities, sustainably achieve affordability goals and ensure Austin remains a great city for people with different needs,
values, and incomes. Austin’s greatest assets are its diversity and its people, and that is why implementing the Housing
Plan to address affordability is so important for all Austinites.

Purpose
The purpose of the Austin Strategic Housing Blueprint is to align resources, ensure a unified strategic direction, and facili-
tate community partnerships to achieve a shared vision of housing affordability. The Blueprint recommends new funding
mechanisms, regulatory changes through CodeNEXT, and other creative approaches the City of Austin and community
partners should utilize to achieve both market rate and affordable housing goals.

The City of Austin’s most recent Comprehensive Housing Market study identified a gap of 48,000 housing units afford-
able to households earning at or below $25,000 annually, or approximately 30% of the median family income (MFI). It is
estimated that the cost to close that gap today with construction of new units would be $6.48 billion.2 By 2025, the cost
to close the gap is estimated to grow to $11.18 billion.3 Given the magnitude of the challenge, subsidies alone are not a
realistic solution. As such, this Blueprint proposes a combination of new funding mechanisms, regulatory changes through
CodeNEXT, and other creative approaches to address specific housing issues the City of Austin and its residents face.

     TABLE 1:
      INCOME CATEGORY*                                                               1-PERSON              2-PERSON               3-PERSON                  4-PERSON
      Extremely low income (at or below 30% of MFI)                                  $16,350               $18,700                $21,050                   $24,300
      Monthly rent affordable to this household                                      $409                  $468                   $526                      $608
      Very low income (at or below 50% of MFI)                                       $27,250               $31,150                $35,050                   $38,900
      Monthly rent affordable to this household                                      $681                  $779                   $876                      $973
      Low income (at or below 80% of MFI)                                            $43,600               $49,800                $56,050                   $62,250
      Monthly rent affordable to this household                                      $1,090                $1,245                 $1,401                    $1,556
      Middle income (at or below 120% of MFI)                                        $65,350               $74,700                $84,000                   $93,360
      Monthly rent affordable to this household                                      $1,634                $1,868                 $2,100                    $2,334
      SOURCE: US Department of Housing and Urban Development Income Limits 2016
      *Annual incomes listed for each income category
      MFI = Median Family Income for Austin-Round Rock Metropolitan Statistical Area (MSA)
      NOTE: The average household size in Austin is 2.3 persons

2
    Calculation: $135,000 (estimated construction cost) x 48,000 units = $6.48 billion.
3
    Calculation: $164,430 (estimated construction costs in 2015 dollars) x 68,000 units (continued rate of increase from 2008 through 2014) = $11.18 billion.

    03 www.austintexas.gov/housingblueprint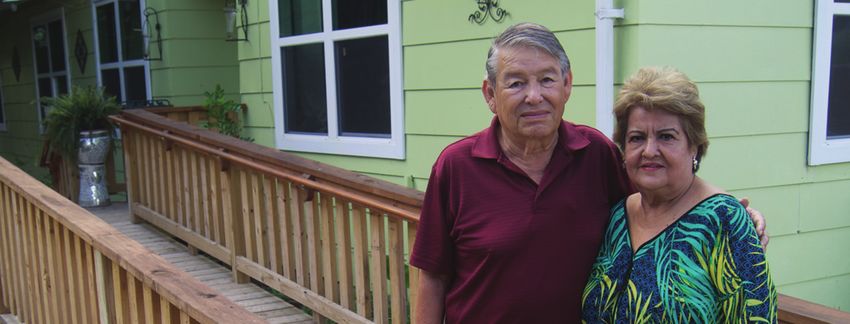
Affordability Definitions
The U.S. Department of Housing and Urban Development defines affordable housing as: “Housing in which the oc-
cupant(s) is/are paying no more than 30% of his or her income for gross housing costs, including utilities.” According
to Imagine Austin, the City of Austin’s comprehensive plan, household affordability includes not only housing costs,
but also utilities and transportation costs. Income-restricted affordable housing refers to housing for which renters or
buyers must meet specific income guidelines to be able to live in the unit. This guideline is generally defined in terms
of a percent of median family income (MFI). Market-rate housing generally refers to housing that is rented or owned
by people who pay market rates to rent the property or paid market value when they bought the property. There is no
subsidy for this type of housing, so there is no guarantee that the prices will remain stable over time. Table 1 (preceding
page) shows the different income categories that will be discussed throughout the Plan, as well as the monthly rents
that are considered affordable for households at these income levels.
COMMUNITY & STAKEHOLDER ENGAGEMENT
14 VIEWS
11,000 1,572 433 30
BOARDS & SURVEY MEETING COMMUNITY
COMMISSIONS ON WEBSITE RESPONSES ATTENDEES MEETINGS
PRESENTATIONS
AUSTIN STRATEGIC HOUSING BLUEPRINT
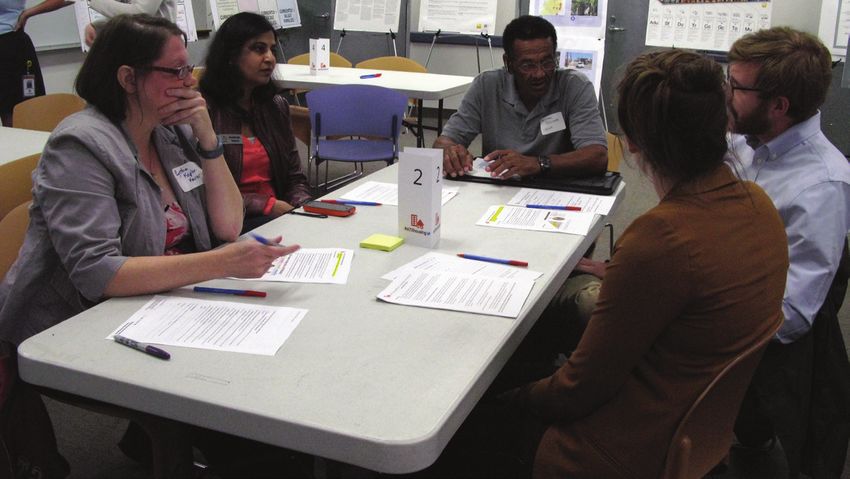
Stakeholder engagement was one of the core components in the creation of the Strategic Housing Blueprint. Neighborhood
Housing and Community Development Department (NHCD) staff actively solicited input from residents, community lead-
ers, local housing advocates, and board and commission members for this Blueprint. Citizens had multiple opportunities to
provide input through a variety of methods. NHCD staff hosted 13 Community Conversation meetings (See Outreach Flyer
in Appendix E-VIII), with at least one in each council district, as well as additional stakeholder meetings and presentations
at multiple board and commission meetings in spring 2016. This outreach provided an opportunity for more than 400
stakeholders to discuss the difficult choices the city faces regarding household affordability. In these dialogues, citizens were
asked to discuss various funding mechanisms, potential regulations, and other creative approaches the City could utilize to
increase housing choices for a range of incomes. The activity was designed to foster constructive communication between
community members about issues relating to affordability. Input gathered from this process informed the Blueprint (See
Appendix E-III).
Additionally, a Housing Conversation Kit (See Appendix E-VII) was created so that individuals could host their own conversa-
tion with their neighborhood association, civic group, non-profit, or faith-based organizations to discuss their perspectives
on housing.
A majority of meeting participants agreed that affordable housing should be distributed as evenly
as possible throughout the city to reduce any concentration, and that this housing should also be
connected to transit and schools. Another commonly expressed view throughout the engagement process was that
the City should focus affordable housing policy on both income-restricted units and on non-subsidized market rate
construction.
04 www.austintexas.gov/housingblueprint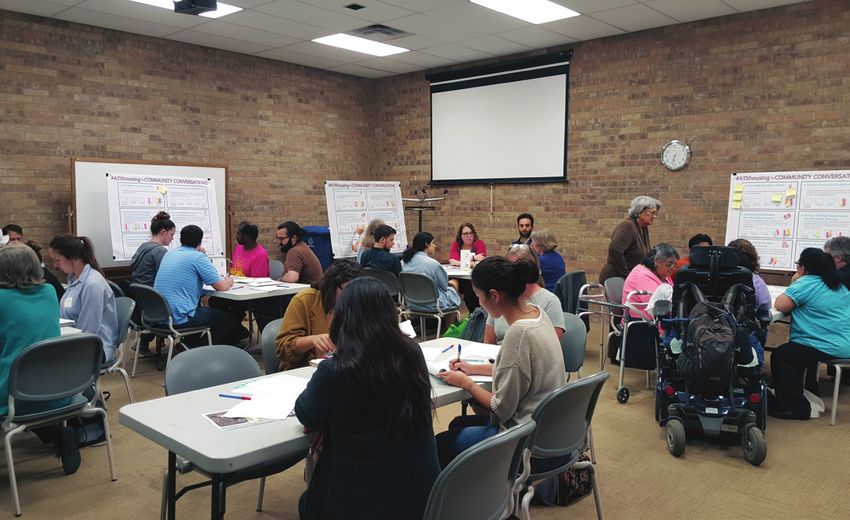
COMMUNITY ENGAGEMENT

In addition to the outreach meetings and conversation kits, NHCD partnered with Austin Energy’s Data
Analytics and Business Intelligence unit to design and distribute surveys soliciting citizen input on af-
fordable housing during April 2016. The surveys were released in four separate methods: email in En-
glish, email in Spanish, online in English, and online in Spanish (See Appendix E-1). The email campaign
was sent to approximately 400 citizens in each of the 10 council districts totaling about 4,000 citizens
reached. The English email-based survey can be traced back to individual respondents within the Austin
area and received more than 400 completed responses, making it a statistically valid sample. The data
captured in this survey are representative of Austinites in demographic terms, with a slightly higher re-
sponse rate of Caucasians, but the attitudes towards affordable housing can be generalized to represent
the city as a whole (See Appendix E-IV).

   www.austintexas.gov/housingblueprint                                                               05
The data indicates that a majority of the respondents are in agreement that people who work in Aus-
tin should be able to afford to live in Austin. However, they are not all in agreement on the specifics of
affordable housing, including how to pay for it and where it should be located. In terms of council dis-
trict differences, it appears that District 4 is statistically more in favor of funding and legislation to sup-
port affordability in Austin. Districts 1 and 10 often showed less support for the need of funding and
legislation to build affordable housing in Austin. Overall, citizens appear to understand the need for affordable
housing in Austin.

A draft of this Blueprint was presented to the Housing and Community Development Council Committee on June
6, 2016, followed by further stakeholder engagement during the summer and fall of 2016. Requests for public
feedback on the draft Blueprint were emailed to all stakeholders involved in the spring engagement process as well
as non-profit, housing advocacy, and neighborhood group networks.

Stakeholders had the opportunity to email their comments and suggestions on the draft Blueprint directly to NHCD,
contribute to the discussion of the Blueprint on the SpeakUP! Austin online platform, and provide comments at all
22 public library locations, where physical copies of the draft Blueprint were available for public review. Outreach
was advertised through the City of Austin social media platforms, CityView community access telvision, and Span-
ish-language media.

Two additional community-wide meetings were held as well as eight targeted meetings for low-
income and minority communities in Council Districts 1, 2, and 3 (See Appendix E-VI). A total of
119 individuals attended the meetings and 18 formal comment letters were submitted from individuals
and organizations. The Feedback Log in Appendix E-VI includes staff responses to more than 400 stakeholder
comments on the draft Blueprint.

What is the Need?
Austin’s comprehensive plan, Imagine Austin, summarizes both the positives and negatives of the rapid population
and economic growth the city has experienced in recent decades. While the economy has grown and diversified;
downtown has been revitalized; transportation options have expanded; and new cultural and artistic opportuni-
ties have been created. Unfortunately, negative impacts like traffic congestion and “Central Austin housing that is
increasingly unaffordable” have also affected quality of life in the city.4

As economic prosperity and Austin’s frequent listing as one of the best places to live make it an
increasingly attractive community, population increases have resulted in rising property values. Longstanding resi-
dents in many neighborhoods are finding it difficult to remain in their homes or places of business. This process of
gentrification5 - where more affluent people move into older, often disinvested areas, has increased property val-
ues and resulted in the displacement of lower-income residents. This phenomenon is occurring not just in Austin,
but in cities throughout America. The issue has exacerbated urban affordable housing shortages to such an extent
that the federal government published a toolkit of housing development strategies in September 2016 to address
the growing lack of affordable housing units in cities. The toolkit recognizes the role that gentrification plays in a
city’s struggle to provide adequate numbers of affordable housing units, and the way it can interact with regulatory
barriers that limit development of new housing:

      When new housing development is limited region-wide, and particularly precluded in
      neighborhoods with political capital to implement even stricter local barriers, any new
      development tends to be disproportionately concentrated in low-income communities of col-
      or, causing displacement and concerns of gentrification in those neighborhoods, raising
      market rents ... while failing to reduce housing cost growth region-wide. As rents rise
      region-wide in response to insufficient housing supply, this displacement is exacerbated.6

4 Imagine Austin 2016 https://www.austintexas.gov/sites/default/files/files/Planning/ImagineAustin/webiacpreduced.pdf
5 Imagine Austin 2016 https://www.austintexas.gov/sites/default/files/files/Planning/ImagineAustin/webiacpreduced.pdf
6 White House, Housing Development Toolkit, Sept. 2016. http://www.whitehouse.gov/files/images/Housing_Development_Toolkit%20f.2.pdf

 06 www.austintexas.gov/housingblueprint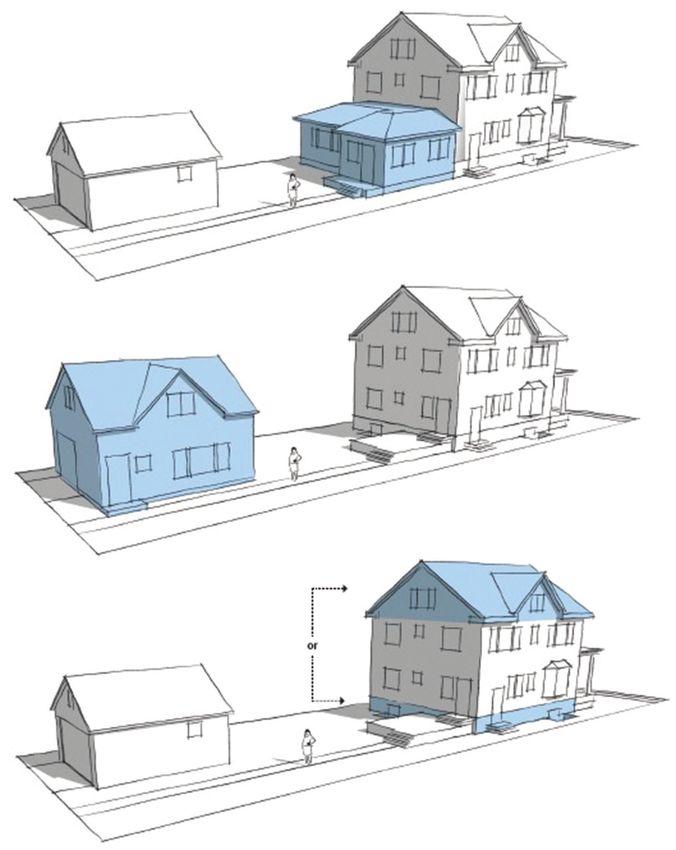
The increased competition (driven by sustained population growth) for the city’s limited supply of
    housing, coupled with fewer federal and state funds dedicated to subsidized housing and widening income in-
    equalities, has created an affordable housing shortage in Austin. This was evidenced in the City of Austin’s most
    recent Comprehensive Housing Market Analysis, which estimated a 16.5%7 decrease in the number of rental units
    affordable to households earning $25,000 per year when compared with 2012 inventory.

TABLE 2:

 THE CITY OF AUSTIN’S 2014 COMPREHESIVE HOUSING MARKET
 ANALYSIS IDENTIFIED THE FOLLOWING AS TOP HOUSING NEEDS:
  •        A shortage of 48,000 deeply affordable rental units (primarily those renting for less than $500/month)
           for renters earning less than $25,000 per year.

  •        Geographically limited housing opportunities:
           – Affordable rentals are scarce west of I-35
           – Homes to buy for $250,000 or less are concentrated in northeast, far south and southeast Austin.

  •        Rising housing costs in a handful of redeveloping neighborhoods, which could cause long-time resi-
           dents to seek more affordable housing elsewhere.

  •        A growing need for affordable housing near transit and services-to enable seniors to age in place, to
           provide a wider array of housing choices for persons with disabilities and to mitigate the financial im-
           pact of rising transportation costs.

    In addition, wages have not kept pace with rising housings costs (see Figure 1 next page), increasing the likelihood
    of displacement of low- and middle-income households without significant intervention. Austinites want to be able
    to afford to stay in Austin; they are concerned that they will no longer be able to afford to live in the city, and that
    they would be unable to afford a home in today’s market.

    Growth in Low- to Moderate-Paying Jobs
    The strongest employment growth during the past decade has mostly occurred in low- to moderate-
    paying jobs. Of the 100,000 new jobs in the Austin Metropolitan Statistical Area (MSA), 36,000 are
    in the education and health services sectors, which pay about $40,000 per year on average. Anoth-
    er 26,000 jobs are in the low paying leisure and hospitality sectors, paying less than $20,000 per year on
    average. Workers in these and other low- and moderate-paying professions, such as the service industry,
    retail, and health attendants, struggle to find homes to rent or buy in Austin. Austin is expected to
    continue adding disproportionately more low- to moderate-paying jobs.8

    7 City of Austin, Comprehensive Housing Market Analysis, 2014. 2012 Gap = 40,924; 2014 Gap (estimate) = 47,698; difference of 6,774 units or 16.5%.
    8 Economic Modeling Specialists International (EMSI) Analyst Data, 2013.

             www.austintexas.gov/housingblueprint                                                                                                         07
FIGURE 1:
AUSTIN MEDIAN HOME PRICES AND RENTS VERSUS MEDIAN INCOME
$300,000
Median Home Price and Income (dollars) $1,400
$250,000 $1,200
$1,000
Median Rents (dollars)
$200,000
$800
$150,000
$600
$100,000
$400
$50,000 $200
$0 $0
2006 2007 2008 2009 2010 2011 2012 2013 2014 2015 2016
Aus n Median Rent Aus n Median Home Price Aus n Median Income
SOURCE: Na onal Associa on of Homebuilders (NAHB), Aus n Opportunity Index, and Aus n Investor Interests Data (2006-2016)
Future Housing Demand
The City of Austin’s population is currently projected to increase at an annual rate of approximately 2%; however,
the region is expected to grow at an even faster annual rate of 3.4%.9 Since more than 50% of the people who
work in Austin live outside the city limits10 and many of them would like to live in Austin but cannot afford to do
so,11 it is estimated that there is a need for the construction of a minimum of 135,000 additional housing units in
the City of Austin over the next decade. (see Figure 6 for more detail about methodology). More than 135,000
housing units—both market-rate and below market-rate—may be needed to reduce Austin’s overall share of
housing cost-burdened households. At the same time, the demographics in our community are changing, with
an increased percentage of young people, retirees, and single people.12 These households generally have fewer
people, spurring an increased demand for smaller housing options. Arthur C. Nelson, urban planning professor at
the University of Arizona, estimates that “half of all new housing demand will be for attached homes and the other
half for small lot homes. Demand for large-lot homes will decline below 2011 levels.”13
9 U.S. Census Data; City of Austin Demographer, www.austintexas.gov/demographics
10 U.S. Census Bureau, OnTheMap Application and LEHD Origin-Destination Employment Statistics, beginning of quarter employment, 2nd Quarter of 2002-2014. City of Austin Demographer.
11 City of Austin, Comprehensive Housing Market Analysis, 2014.
12 Fregonese & Associates, Austin Balanced Housing Model, 2016.
13 Arthur C. Nelson, “The Mass Market for Suburban Low-Density Development is Over,” The Urban Lawyer, 2012.
08 www.austintexas.gov/housingblueprintSixteen percent of Austin’s households earn under $25,000 (roughly 30% of MFI) per year, 19% earn be-
tween $25,000 and $39,000 per year (roughly 31% to 60% MFI), 12% earn between $39,000 and
$52,000 per year (roughly 61% to 80% MFI), 27% earn between $52,000 and $78,000 per year (roughly
81% to 120% MFI), and 27% earn $78,000 per year or more (roughly 120% MFI and above). While 35% of the city’s
households earn 60% MFI or below, only 15% of the city’s housing stock is affordable to them, forcing those house-
holds to compete with higher income households for a limited supply of housing that is affordable to these lower
income households (see Figure 2). This lack of affordable supply also results in lower income households having to
rent more expensive housing units.
FIGURE 2:
COMPARING RENTAL HOUSEHOLD INCOMES WITH OCCUPIED UNITS
AFFORDABLE AT EACH INCOME LEVEL
50,000
LOW INCOME HOUSEHOLDS ARE STRETCHING
FINANCIALLY TO RENT MORE EXPENSIVE UNITS
45,000
40,000
Number of Households
35,000
30,000
25,000
20,000
15,000
10,000
5,000
$0
>$15k $15kFIGURE 3:
CITY OF AUSTIN’S CURRENT VERSUS FUTURE HOUSING MIX
600,000
5,399
500,000
Number of Housing Units
246,688
400,000
300,000
7,223 40,762
133,940
200,000
101,477
12,995
100,000 46,265
135,521
72,249
$0
Occupied Housing Supply 2014 Future Total Units 2040
Std. Large Lot Single Family Small Lot Single Family Townhome
Mul family Mobile home/Other
SOURCE: Aus n Balanced Housing Model, Fregonese & Associates, 2016
When considering Austin’s future housing demand, as seen in Figure 3, it is clear that much of new housing de-
mand will be for multifamily or attached units. However, there are also large increases in demand for small-lot,
single family and missing middle housing types, which include bungalow courts, side by side duplexes, stacked
duplexes, triplex, fourplex, live/work and small multiplexes. In the Austin Area, households earning below $35,000
annually, and especially those earning below $15,000, are housing cost-burdened, which means they spend more
than 30% of their incomes on housing costs. This impacts many Austinites in the broader community, including
households living at or below the poverty level, seniors, persons with disabilities, and low wage workers such as
childcare providers, nurses, aides, healthcare attendants, bus drivers, retail salespeople, cashiers, cooks, custodi-
ans, and artists.
10 www.austintexas.gov/housingblueprintFIGURE 4:
INCOME NEEDED TO AFFORD HOUSING IN AUSTIN METRO &
MEDIAN SALARIES FOR SELECTED PROFESSIONS
$80,000
$70,000
$60,000
$50,000
$40,000
$30,000
$20,000
$10,000
$0
t. t. me n er taff ver n er ok nt r er
Ap Ap Ho pe
rso shi it S Dri dia ork Co ista hte ach
1 BD 2BD an es Ca a us usto W o d ss re fig l Te
a a ed
i al W lB C re tF
o eA Fi o
ord ord il S oo Ca v cho
Aff Aff aM eta Sch ild Fas tra yS
o o r d R Ch nis ar
et et ffo mi nt
om om oA Ad me
Inc Inc m et Ele
o
Inc
SOURCE: Paycheck to Paycheck, Na onal Housing Conference, 2016
Equity, Integration, and Diversity
The Austin Strategic Housing Blueprint affirms the work generated by Austin Mayor’s Task Force on Institutional
Racism and Systemic Inequalities. In its March 31, 2017 report, the Task Force noted that “Austin must acknowl-
edge the damage being caused by our community’s continued acceptance of residential racial and ethnic segre-
gation. The solution must begin with our community embracing integration and diversity as a core value.” 14 The
Austin Strategic Housing Blueprint is intended to set the community on a path to achieve an equitable housing
environment where integration, diversity, and inclusion are championed.
In February 2015, the Martin Prosperity Institute named the Austin metro area the most economically segregated
area in the United States, stating that “[i]t is not so much the size of the gap between the rich and poor that drives
segregation as the ability of the super-wealthy to isolate and wall themselves off from the less well-to-do.”15 An
adequate supply of housing affordable to people working all types of jobs and integrated throughout the City is
necessary to maintain a culturally rich, diverse, and livable city. Without this, people who work here are being
forced to move out of the city, resulting in negative impacts not only for individuals and families, but also for the
region as it increases traffic congestion, expands environmental degradation, and fragments communities. As
such, housing affordability must be a cornerstone of the City’s commitment to greater equity and fairness for each
individual and community that calls Austin home. Housing should be embraced as crucial infrastructure, and this
should be planned for as other infrastructure investments require long range planning and investment strategies.
Without sufficient housing for a range of incomes, Austin risks becoming a city accessible only to the affluent.
Studies have found that the odds of rising to another income level are notably low in cities with concentrated
poverty, extensive traffic, and weak public transit systems, which make it difficult to get to a job.16 Therefore, poli-
cymakers have an opportunity to address inequality while also addressing affordability by expanding their efforts
to include access to transportation and the costs of utilities, taxes, and health care.
14 https://cityofaustin.github.io/institutional-racism/IRSI_Task_Force_Final_Report-Updated-4-7-17.pdf, p. 26.
15 Richard Florida and Charlotte Mellander, Segregated City (Toronto: Martin Prosperity Institute), 2015, www.martinprosperity.org/media/Segregated%20City.pdf]
16 David Leonhardt, “In Climbing Income Ladder, Location Matters,“ New York Times, July 22, 2013. www.nytimes.com/2013/07/22/business/in-climbing-income-ladder-location-matters.html
www.austintexas.gov/housingblueprint 11Regional Housing Need
While housing in the City of Austin is becoming more expensive, surrounding areas face their own set of problems.
As lower income households find themselves unable to afford to live in Austin, they are relocating to surrounding
communities or unincorporated areas of Travis, Williamson, and Hays counties. While housing costs may be lower
in areas outside Austin, other costs, like transportation, can be higher due to increased distances traveled and a
lack of infrastructure for nearby services and amenities.
The Austin metro region encompasses part or all of Bastrop, Caldwell, Hays, Travis, and Williamson Counties. Pop-
ulation projections for these five counties show sustained growth across the area, with especially high rates of
growth projected for Travis and Williamson Counties over the next several decades.
FIGURE 5:
POPULATION GROWTH FORECAST BY COUNTY (2010-2050)
1,600,000
1,400,000
1,200,000
1,000,000
800,000
600,000
400,000
200,000
2010 2015 2020 2025 2030 2035 2040 2045 2050
Bastrop County Caldwell County Hays County Travis County Williamson County
SOURCE: Capital Area Council of Governments, 2016, h p://www.capcog.org/data-maps-and-reports/central-texas-regional-data/
In order to accommodate this growth, municipalities across the region will need to increase supply of housing for
residents across income categories. This Housing Blueprint focuses on what Austin can do to retain its current res-
idents and prepare for future growth; however, it is important to recognize the regional context in which Austin’s
growth is occurring. Furthermore, to effectively accommodate the projected population growth, the City of Austin
will need to work collaboratively with other municipalities and counties in the region in a variety of areas, including
transportation, economic, and water resources planning.
12 www.austintexas.gov/housingblueprintCrucial Partnerships: Public Housing Authorities
Austin is served by two public housing authorities: the Housing Authority of the City of Austin (HACA) and the
Housing Authority of Travis County (HATC). HACA maintains 18 public housing properties totaling 1,838 affordable
units for low-income households. As of Fiscal Year 2015-2016, more than 8,000 families were on the waiting list to
move into one of these public housing units. HACA administers several rental voucher programs, including Veteran
Affairs Supportive Housing (VASH), Homeless Program Grant, Family Unification, Mainstream, and Non-Elderly
with Disabilities. Its largest program is the Housing Choice Voucher program with over 5,350 rental vouchers sup-
porting an estimated 14,500 people. Its second largest rental assistance program is VASH, serving 464 transitioning
homeless veterans. As of Fiscal Year 2015-2016, there were over 2,000 families on the waiting list for a Housing
Choice Voucher. HACA also receives funding through the City of Austin for a Tenant Based Rental Assistance vouch-
er program, which assisted 101 households during Fiscal Year 2015-2016.
Through its subsidiary, Austin Affordable Housing Corporation (AAHC), HACA also owns and operates 2,436 ad-
ditional high-quality affordable housing units at 12 apartment communities across Austin. HACA is also currently
developing an additional 3 communities with 702 affordable units. All AAHC projects accept and actively welcome
residents who use Housing Choice or other rental assistance vouchers.
HATC serves Travis County and parts of Austin. The authority manages five housing properties totaling 154 af-
fordable units. HATC also administers eight housing services programs. The largest program is the Housing Choice
Voucher program, with 568 vouchers and approximately 800 households on the waiting list to receive a voucher.
HATC also receives funding through a Shelter Plus Care grant to provide 95 units for homeless families or individuals
in the area. The Strategic Housing Finance Corporation (SHFC), a separate entity from the HATC, has developed
nearly 2,000 affordable units.
Public housing authorities must create five-year comprehensive plans, as well as annual plans
according to U.S. Department of Housing and Urban Development guidelines. These comprehensive
plans encompass policies, programs, and strategies to help the housing authorities meet their
communities’ housing needs and goals. HACA’s 2016 Annual Plan and 2015-2019 Five-Year Plan
and HATC’s 2016-2017 Annual Plan provide the most recent discussions of the authorities’ policies,
accomplishments, and goals.
It is important to continue the sustainable partnerships between the City of Austin, HACA, AAHC, HATC, and SHFC
in planning efforts to align goals and targeted investment strategies. There are many opportunities to leverage
resources to achieve the goals outlined in this Blueprint.
Past Efforts to Increase the Supply of Affordable Housing
This is not the first time the City of Austin has focused funding and policy to address affordable housing issues.
These efforts include two Housing Market Study analyses, in 2008 and 2014, to identify existing and future housing
needs and to support the creation of a plan to meet those needs. In 2008, the City also conducted an Affordable
Housing Preservation Study that included recommendations for proactively preserving existing affordable units
in the face of declining or expiring federal subsidies and significant projected population growth. This study led to
the development and adoption of preservation goals in 2014. Affordable housing strategies were developed for
the downtown area (2009) and for Permanent Supportive Housing for people experiencing chronic homelessness
(2010). Analysis of the fee-in-lieu option allowed under certain density bonus programs has been conducted, with
recommendations delivered to City Council in 2016. Updates to the S.M.A.R.T. Housing program are also being con-
sidered with the purpose of making the program more effective at creating longer-term affordable housing units.
www.austintexas.gov/housingblueprint 13NHCD’s Rental Housing Development Assistance and Acquisition & Development programs have provided funding
to private developers to create affordable rental and ownership units for over a decade. General obligation bonds
for affordable housing were approved by Austin voters in 2006 and 2013, allocating $120 million and creating over
3,500 affordable housing units to date (with $20 million from the 2013 bond still remaining as of October 2016).
Affordable Housing Goals
Goals for 10-year housing production of both affordable and market-rate housing were established by examining
data on past housing production and population growth in both Austin and the Austin-Round Rock Metropolitan
Statistical Area (MSA), consultation with the City’s Demographer, and examination of a range of potential scenarios
with regard to the national and local economy over the next 10 years.
FIGURE 6:
METHODOLOGY
STEP 1: Multiply the 2015 City of Austin Total Housing stock by the 2025 MSA Population Per-
cent Change. This shows the number of new housing units that need to be added to keep pace with
population growth.
STEP 2: Proportionally distribute the number of new units needed to keep pace with population growth by the
percent of Austin households at various income levels.
397,637 x 34% = 135,197
2015 # Housing Units 2025 MSA Population % 2025 # New Housing Units Needed
(City of Austin) Change (est.) to Keep Pace with Population
Growth
2025 # New Housing
MFI Range Income Ranges for a Percent of Households Units Needed by MFI
* The percent column has been rounded for display purposes.
Four-Person Household by MFI Range* Range
0-30% MFI < $22,600 16.6% 22,417
31-60% MFI $22,601-$45,240 18.4% 24,963
61-80% MFI $45,241-$60,300 11.7% 15,822
0-80% MFI Unit Goal 63,201
ROUNDED 60,000
81-120% $63,301-$90,480 19% 25,959
MFI
121%+ MFI $90,481+ 34% 46,037
81% + MFI Unit Goal 71,995
ROUNDED 75,000
14 www.austintexas.gov/housingblueprintAs depicted in Figure 6 on the previous page, housing unit goals were set by calculating the percentage
of households falling within the various income categories in Austin today. Achieving these goals would
help ensure that households within each income category are able to find affordable housing choices
they can afford, minimizing the risk of displacement. This will require strategy that focuses both on preservation of
existing homes and the production of housing supply at all income levels.
FIGURE 7:
HOLISTIC APPROACH TO AFFORDABLE HOUSING
PRESERVE PRODUCE
MAINTAIN EXISTING
INCREASE OVERALL
HOMES AFFORDABLE
HOUSING SUPPLY AT
TO COMMUNITY
ALL INCOME LEVELS
MEMBERS
• Acquire and rehabilitate • Simplify regula
ons
affordable homes at-risk
• Use available public land
• Advance new home for affordable housing
ownership models
• Expand funding at all levels
• Create suppor
ve
financing environment
• Adopt proven policies
SOURCE: City of Aus
n
Appendix B features an implementation matrix that prioritizes each recommended policy action;
identifies implementation partners; and provides a time horizon for implementation. Any approach will need to be
multifaceted and will require increases to the supply of both the subsidized housing units and the unsubsidized,
market-rate housing units.
www.austintexas.gov/housingblueprint 15AUSTIN COMMUNITY 10-YEAR AFFORDABLE HOUSING GOALS
135,000 HOUSING UNITS IN 10 YEARS
KEY STRATEGIES:
Federal Funding
Local Funding
20,000
HOUSING UNITS
Affordable to
30% MFI and Below –
Includes Permanent Suppor
ve
Housing & Home Repair
50,000
HOUSING UNITS
Affordable to 25,000 KEY STRATEGIES:
121% MFI and Above HOUSING UNITS
Affordable to
Federal Funding
31-60% MFI
Local Funding
Density Bonus Programs
15,000
HOUSING UNITS
25,000 Affordable to
HOUSING UNITS 61-80% MFI
Affordable to
81-120% MFI
KEY STRATEGIES
Strike Fund
Density Bonus Programs
Other Incen
ves
KEY STRATEGIES
Strike Fund
CodeNEXT Changes
At least 75% of new housing units should be within 1/2 mile of Imagine Aus n Centers and Corridors
(see the Figure 10 map showing Imagine Aus n Centers and Corridors)
Preserve 10,000 affordable housing units over 10 years
Produce 100 Permanent Suppor ve Housing (PSH) units each year, with half of those units (50) being
Housing First
At least 25% of new income-restricted affordable housing should be in high opportunity areas.
At least 30% of new housing should be a range of housing types from small-lot single-family to
eight-plexes to help address Aus n’s need for mul -genera onal housing.
WITHIN EACH CITY COUNCIL DISTRICT:
At least 10% of rental housing units that are affordable to households earning at or below 30% MFI
($24,300 or less for a 4-person household in 2016); and
At least 25% of ownership housing units that are affordable to households earning at or below
120% MFI ($93,360 or less for a 4-person household in 2016).
16 www.austintexas.gov/housingblueprintCITY OF AUSTIN NEIGHBORHOOD HOUSING AND COMMUNITY
DEVELOPMENT (NHCD) DEPARTMENT 10-YEAR TARGETS
HOUSING FOR ALL
n Serve at least 20 people without a voucher and under 20% MFI each year in non-Permanent
Supportive Housing (PSH).
n 100% of ground floor units in new developments funded by NHCD will be adaptable and 25% of
all affordable units will be accessible.
n Support the production of 50 Permanent Supportive Housing units each year, with half of those
being Housing First.
FAMILY FRIENDLY HOUSING
n 25% of affordable housing units that are created or preserved should have two or more bed-
rooms AND a system to provide opportunities for families with children.
LINKING HOUSING WITH TRANSPORTATION
n 25% of affordable housing created or preserved to be within ¼ mile of high-frequency transit
(this is transit service that provides service every 15 minutes or better throughout most of the
day, on weekdays and weekends).
n 75% of affordable housing created or preserved within ¾ mile of local, fixed-route transit service,
ensuring Metro Access service for eligible persons with disabilities.
HOME REPAIR
n Assist 600 low-income households per year with home repair programs with the objective to
help preserve existing housing stock.
AFFORDABLE HOUSING GOALS IN MASTER PLANNED DEVELOPMENTS
Several areas throughout Austin have district or master plans specifying that a certain percentage of
units should be affordable to people at lower incomes. These percentages will be achieved through
mechanisms such as Tax Increment Finance Districts, density bonuses, direct investments of local and
federal funds, and other resources. These areas include:
COLONY PARK MUELLER SOUTH CENTRAL WATERFRONT
20% of units affordable 25% of units (approximately 20% of all new units
to households at 60% MFI 1,425 units at buildout) affordable to households
or below (rental) and affordable to households at at 60%-80% MFI
80% MFI or below (owner) 60% MFI or below (rental) and
80% MFI or below (owner)
www.austintexas.gov/housingblueprint 17FIGURE 8:
FUNDING MECHANISMS AND TOOLS FOR 60,000 AFFORDABLE UNITS
(UP TO 80% MFI) IN 10 YEARS
60,000
OTHER TOOLS
AFFORDABILITY PERIOD:
10-40 Years
INCLUDES:
50,000
Tax Increment
Financing, STRIKE FUND
AFFORDABILITY PERIOD:
Homestead 40 Years
Preserva on
Districts,
Planned Unit NEW AFFORDABLE
Developments, HOUSING BOND PROGRAM
Expanded AFFORDABILITY PERIOD:
40,000 40-99 Years
Density Bonus
POLICY
Programs, DIRECTION
S.M.A.R.T. REQUIRED
HACA/AUSTIN AFFORDABLE
Housing with HOUSING CORPORATION
an extended AFFORDABILITY PERIOD:
affordability 20 Years
period, and
30,000
other tools
iden fied in AUSTIN HOUSING TRUST FUND
this Blueprint. AFFORDABILITY PERIOD:
20-99 Years
47,717
DENSITY BONUS PROGRAMS
AFFORDABILITY PERIOD:
15-60 Years
20,000
TRAVIS COUNTY HOUSING
AUTHORITY/STRATEGIC HOUSING
FINANCE CORPORATION
AFFORDABILITY PERIOD:
30 Years
2013 AFFORDABLE HOUSING
5,000 BOND PROGRAM
10,000 AFFORDABILITY PERIOD:
40-99 Years
1,932
1,384 FEDERAL FUNDS
AFFORDABILITY PERIOD:
1,795
10-20 Years
1,450 CURRENT
950 TOOLS
450
0 272
*Es mate methodology is featured in Appendix A.
NOTE: These strategies and ac vi es are in addi on to the exis ng efforts already underway amongst the City and its partners.
18 www.austintexas.gov/housingblueprintKey Actions to Support Community Values
Achieving the aggressive community goals outlined in the Blueprint will require the continuation of existing
funding, as well as significant new funding, new regulations, new programs, new and deeper partnerships and col-
laborations with non-profit organizations legislative changes, land development code changes, and participation
from the private sector at a level not previously experienced in Austin. To make significant progress in altering the
current trajectory of Austin becoming a city available to only certain income households, policymakers will have to
make difficult decisions including redirecting funds from other uses toward affordable housing, and changing city
policies to address housing needs and ensure that the needs of vulnerable populations are addressed.
Analysis by University of California researchers about the relationship between housing production,
affordability, and displacement in the San Francisco Bay Area found that although subsidized housing
has twice the impact of market-rate units, both market-rate and subsidized housing work together to reduce dis-
placement pressures at the regional level. The research notes the importance of Increasing spending on subsidized
housing to ensure both neighborhood stability and income diversity into the future. However, the findings also
support the need for the production of more housing at alI levels of affordability in strong-market regions like Aus-
tin to ease housing pressures. When there is a lack of housing units relative to demand for housing, prices for all
types of housing rise.17 Thus, this Housing Blueprint incorporates goals and strategies to increase not just the supply
of subsidized units, but the supply of housing units in general.
Continuation of level funding for affordable housing in Austin (including new General Obligation Bonds when the
funds from the current bonds are expended) would result in the production of approximately 5,900 income-re-
stricted affordable units over the next ten years; however, the need for both income-restricted affordable
housing and market-rate housing over those ten years is estimated to be approximately 135,000 units, using the
growth rate of the Metropolitan Statistical Area. Aggressive implementation of the policies, programs, and tools
described below will be necessary to move the needle toward making Austin a more equitable and inclusive city.
It is important to note that, in any given year, a certain number of income-restricted affordable housing units are
lost due to the expiration of subsidies or affordability periods (i.e., the length of time they must remain affordable
to meet contractual or funding obligations). Market-rate units with affordable rents can also be lost due to in-
creasing rents or redevelopment. Strategies to deal with this natural attrition are discussed in the “Make Strategic
Investments to Minimize Displacement” subsection on page 22.
17 Miriam Zuk and Karen Chapple, Housing Production, Filtering and Displacement: Untangling the Relationships,” Institute of Governmental Studies Research Brief
(Berkeley: UC Berkeley), 2016.
www.austintexas.gov/housingblueprint 19SUCCESS STORY:
HOUSING GO BOND DEVELOPMENTS
In 2006, voters approved $55 million in general obligation bond funding for affordable housing development, a
historic first in Austin. All of this funding has been expended and has built, preserved, or repaired 2,593 rental and
ownership units throughout the city. 73% of these units are affordable to households earning up to 50% MFI. The
housing developments funded with 2006 bond funds have yielded a high return on investment: for every $1 of
City funding, $4 of other funding was leveraged, enabling seniors, persons with disabilities, and very low-income
families to obtain affordable housing throughout the community. In 2013, Austin voters approved an additional $65
million for affordable housing.
Prevent Households from Being Priced Out of Austin
Preserve communities and combat gentrification through legislative changes, local policies, programs and targeted investments.
(*indicates strategies with highest potential impact)
*Support Legislation for a Flat Dollar-Amount Homestead Exemption for all Local Taxing Entities
Current state law only allows cities to offer a homestead exemption equaling a percentage of the appraised value of a prop-
erty, which disproportionately benefits owners of high-value homes while offering little relief to owners of low-value homes.
A flat dollar-amount homestead exemption would offer more substantial relief to homeowners who are most in need.
*Support Legislation or other Mechanisms to Create a Preservation Property Tax Exemption for
...Communities at Risk of Displacement:
Austin needs a tool that can mitigate the pressure on its existing housing stock, which is causing rent increases and displac-
ing low-income renters to outside the city. A Preservation Property Tax Exemption geared toward preserving affordability
would provide a City of Austin tax exemption (regardless of the age of a property) in exchange for guaranteeing continued
affordability. The City will develop a strategy to implement this tool in areas most at risk of experiencing a displacement of
low-income renters.
Allow Homeowners to Rent a Portion of Their House as a Separate Housing Unit:
Pursue code changes to allow homeowners to convert existing interior residential space into accessory dwelling units they
could rent out to help them afford to stay in place.
20 www.austintexas.gov/housingblueprint*Expand the use of Community Land Trusts (CLT) and other forms of Shared Equity Ownership:
Between rental and conventional homeownership, shared equity ownership ensures that homes remain affordable to low-
er-income households on a long-term basis. One form of this, community land trusts, enable eligible households to purchase
a home and lease the land underneath it (Figure 9). By taking the cost of the land out of the real estate transaction, homes in a
community land trust are much more affordable than houses on the open real estate market. Dedicating additional resources
to the program could help expand it. Combining the land trust tool with regulatory changes through CodeNEXT that allow for
a range of multifamily housing types such as missing middle housing could result in greater homeownership opportunities at
an even lower cost to prospective income-eligible buyers.
Increase the Supply of Multi-Bedroom Housing for Families with Children:
Imagine Austin calls for a city that works for people of all ages, including families with children. The number of housing units
available with multiple bedrooms can constrain the choices for families; however, families also consider a number of other fac-
tors such as schools, and the availability of family oriented services and amenities. The city should evaluate CodeNEXT to ensure
it is providing an adequate supply of multi-bedroom housing throughout the community, creating diverse housing types and
unit mix. This could provide added housing stock for families and help Austin retain families and support under-enrolled schools.
• Explore ways and develop a goal for the percentage of multi-bedroom housing in neighborhoods which can create age-diverse
• neighborhoods;
• Explore options to increase multi-bedroom housing in a variety of areas, including on publicly-owned land and on corridors
• and centers near schools. Such options could include setting minimum bedroom requirements and policies that encourage
...dwellings for multi-generational households.
Prevent Displacement of Low- and Moderate-Income Homeowners:
Buying a home in Austin during a time of rising homes prices is out of reach for most low-income families, and being able
to continue to afford property taxes, especially in central Austin, has become very challenging. That means it is even more
critical to prevent displacement of existing low- and moderate-income homeowners. The City will continue to explore ways
to help stabilize low-income homeowners, build on the success of existing repair and weatherization programs, and pursue
policies to provide assistance to homeowners with financial hardships that threaten their housing.
FIGURE 9:
COMMUNITY LAND TRUSTS - HOW DO THEY WORK?
Land is owned by the
community land trust,
which is governed by
a non-profit board.
A 99-year ground lease between
CLT and owner ensures owner-
occupancy and responsible use
Buildings (residential or and outlines fees paid to the CLT.
commercial) are owned
by individuals.
X
Because they pay only for
the structure, and not the
underlying land, purchasing
the building is more affordable.
A resale formula built into the
ground lease is designed to
keep homes affordable for
subsequent buyers.
www.austintexas.gov/housingblueprint 21Develop Programs and Policies that can help Mitigate Gentrification Pressures in Historically Low-Income Neighborhoods The Imagine Austin Comprehensive Plan defines gentrification as the process of neighborhood change that results in the replacement of lower income residents with higher income ones. The City of Austin should continue to fo- cus resources on programs and policies that can help mitigate gentrification pressures in historically low-income neighborhoods. This includes undertaking equitable development strategies to create healthy, vibrant communities of opportunity. Equitable outcomes result when intentional strategies are put in place to ensure that everyone can participate in and benefit from decisions that shape their neighborhoods and city. This could also include the cre- ation of a low interest loan fund or grant for preservation in historically low-income gentrifying areas. Such a fund could provide a further incentive to preserve affordable housing stock in targeted areas with the greatest redevel- opment and displacement pressures. Preserve and Create Ownership Options for Households at 80% to 120% MFI: In response to City Council direction to provide recommendations on strategies to create more homeownership options for households earning from 80% to 120% MFI, staff and stakeholders developed a list of potential strategies to support households in this income range, including exploring the potential for funding sources for this income category, potentially having higher income limits in future General Obligation Bond elections, incorporating land development code changes through the CodeNEXT process, and expanding the City’s S.M.A.R.T. Housing Program for higher incomes, among others. (Assuming 0% down, an interest rate of 3.62% and an annual effective property tax rate of 2.5% an affordable home purchase price at 80% MFI for a 4 person household would be approximately $225,000 and at 120% MFI would be $348,000. These estimates could change based on the underlying assumptions and interest rates). Coordinate Preservation Strategies with Infrastructure Investments: Proactive preservation strategies can be particularly helpful if undertaken early and in coordination with infrastruc- ture improvements. These activities can often lead to increases in property values and rents; therefore, working with building owners early in the process to help preserve the affordability of properties will help stabilize the neigh- borhood and allow existing tenants to remain in their communities. Use Incentives to Support the Production of Living Wage Jobs: Incentives should be focused on improving the economic conditions of current lower income unemployed or underemployed residents to spur opportunities that enable them to better afford to live in Austin. Increasing the number of “living wage” jobs (jobs that pay a high enough wage for a per- son to meet the basic living expenses for an area) would enable residents who currently work in minimum wage jobs to earn enough to meet the cost of living in Austin. The living wage for City of Austin employees was $13.50 per hour as of October 2016. Greater coordination with relevant city departments, should be pursued to identify potential incentives for the creation of more living wage jobs. Make Strategic Investment to Minimize Displacement: Displacement is happening throughout Austin. Low-income communities are at high risk of displacement. Austin should make robust investments to anchor and strengthen these communities, including investments in new development and affordable housing preservation, as well as coordinating targeted investments in economic development, transit, and education. Additionally, tracking which income-restricted units are set to expire in a given year can help the City identify opportunities to preserve its affordable housing stock. Targeting those affordable units that will be lost through attrition with strategies like the Strike Fund, Community Land Trust, and others in this Blueprint can help extend the affordability periods of these units. Consider the Development of a District Plan for Central East Austin: The city should explore creating a District Plan for Central East Austin focused on preservation to acknowledge the public role in making the area vulnerable to gentrification, and which allows long-time residents to shape goals and strategies for preservation. 22 www.austintexas.gov/housingblueprint
You can also read