Australia's Construction Industry: Profile and Outlook. July 2015
←
→
Page content transcription
If your browser does not render page correctly, please read the page content below
Australia’s Construction Industry: Profile and Outlook. July 2015
The construction industry is a significant driver of economic activity in Australia. It is Australia's third largest
industry, behind only mining and finance, and produces around 8% of our Gross Domestic Product (GDP), in
value added terms. It comprises over 330,000 businesses nationwide and directly employs over one million
people (around 9% of the total workforce). It produces the buildings and infrastructure that are essential to the
operation of all other industries, adds to the wealth and capital stock of the nation and underpins the
productivity improvements that are necessary to support our future prosperity and incomes.
Demand for construction activity is driven by economic factors including population growth, income growth,
industry activity, technology changes, commodity cycles, consumer sentiment, interest rates and inflation.
Government policies affecting residential building, pricing and infrastructure development (including taxation,
land allocation, industrial and planning policies) are key influences. The availability, price and location of
resources, including skilled labour, building materials and building equipment are other key determinants of
the pace of growth in the industry.
The supply chain for construction is complex and strongly interrelated, encompassing manufacturing
(materials, equipment components), services (engineering, design, surveying, consulting, lease management)
and traditional construction trades.
CONSTRUCTION INDUSTRY ACTIVITIES
The construction industry operates in both the private and public sectors, across three broad areas of activity:
engineering construction (major infrastructure, mining and heavy industrial resource based projects;
non-residential building (including offices, shops, hotels, industrial premises, hospitals, entertainment
facilities) and;
residential building (houses, flats, home units, townhouses).
KEY POINTS ON OUTLOOK
The latest data points to a fragmented outlook for the construction industry. The current downturn underway
in engineering construction is expected to continue, as mining-related construction and related infrastructure
investment falls further from its recent peaks. Non-residential building activity (commercial construction) is
expected to remain subdued into 2016, reflecting persistent weakness in approvals and building
commencements across most major commercial property markets. In contrast, residential building activity is
forecast to remain solid over the remainder of 2015 and into 2016 supported by elevated approvals, low
mortgage interest rates, strong population growth and urban transport infrastructure developments.
CONTRIBUTION TO ECONOMIC OUTOUT
In 2014-15, direct construction industry output contributed 7.8% to Australia’s Gross Domestic Product (GDP)
up from around 6.5% a decade ago (see chart 1). This makes the construction industry Australia’s third
largest contributor to GDP in terms of the volume of its output. Only the financial and insurance services
(8.7%) and mining (8.8%) sectors contribute larger shares of direct output to GDP.
In addition to this direct contribution to GDP, construction activity supports a large upstream and downstream
supply chain. For example, the production of building materials (e.g. tiles, wood, steel, cement, bricks and
glass), building components (doors, windows, wiring, electronics, plumbing supplies) and accessories
1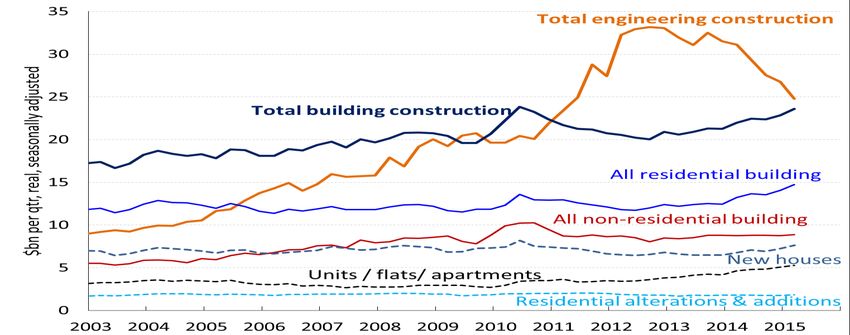
(bathroom and kitchenware, carpets and curtains) are supplied from manufacturing, while the sale and
management of property is the preserve of real estate services and the financing of property mortgages is
part of the financial services sector. Similarly, engineering and architectural design services are classified as
‘professional services’ in the 'ANZSIC'1 system of classification, while the transport and wholesaling of all
building materials are included in the 'transport' and 'wholesale trade' sectors respectively. These upstream
and downstream industries are large and significant in their own right. Collectively, they extend the reach of
construction-related activity to around 20% of the economy, in output ('value added') terms.

                    Chart 1: Construction industry output: size and share of GDP

Source: ABS, Australian National Accounts: National Income, Expenditure and Product

CONSTRUCTION ACTIVITY
Total construction activity in 2014 was valued at $204.5 billion, in real (inflation-adjusted) volume terms.
Engineering construction was the largest sector (56.1% of all construction activity in 2014) followed by
residential building (26.6%) and non-residential building (17.2%). See Table 1 and Chart 2.
The five years to 2012 saw the volume of total construction work done increase by $71.3b, implying an
average annual growth rate of 16.2%. $68.3b worth of this increase was in engineering construction, in line
with the substantial investment phase of the mining boom which led to historically high levels of activity in
infrastructure and resources related construction. The mining investment boom saw the annual value of
construction peak at $213b in 2012 (see chart 2).
From 2012 to 2014, engineering construction declined by $16.7 billion as mining investment fell from its
record-high peaks and as mining-related heavy industrial, rail and port infrastructure construction declined.
Engineering construction’s share of total work done rose from 47.2% in 2010 to 61.6% in 2012, before dipping
to 56.1% in 2014 with the passing of the peak in resources investment.
The impact of this downturn in engineering construction on total construction work done over this two-year
period was partially countered by an $8 billion recovery in other (non-engineering) types of building work. The
value of residential work rose by $6.5 billion through 2013 and 2014, in response to low interest rates, pent-
up demand and ongoing population growth. Non-residential building and commercial construction expanded
by $1.4 billion over the same period, mainly reflecting large projects underway in Melbourne and Sydney.
However, overall levels of non-residential work done building work have remained relatively subdued in
recent years, with heightened risk aversion and low investor sentiment weighing heavily on the sector.

1
 Australian and New Zealand Standard Industrial Classification 2006 (ANZSIC) is the coding system used for
all industry data published by the Australian Bureau of Statistics and most other Government agencies.

                                                                                                             2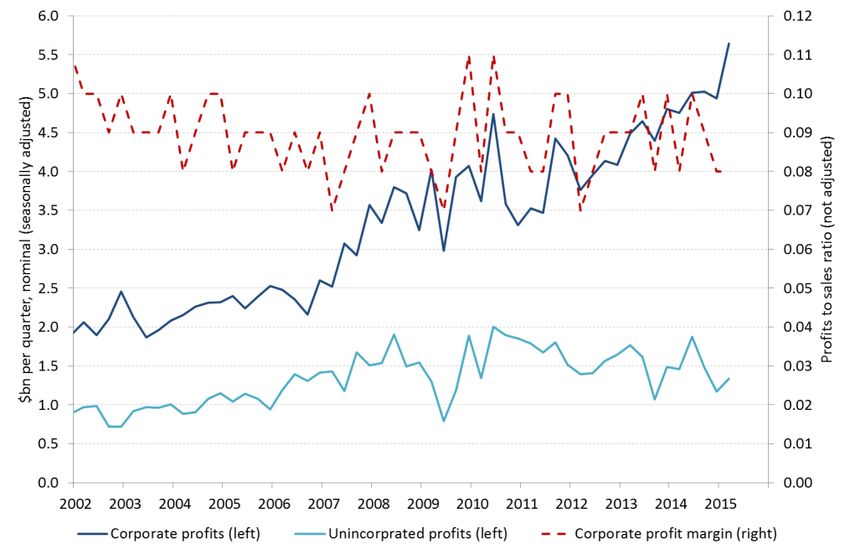
The total volume of construction work continued to contract in early 2015, led by engineering construction
which fell by 20.3% p.a. in Q1 2015. In contrast, residential building increased by 11.4% p.a. in Q1 2015,
supported by stronger house approvals and especially strong growth in multi-unit dwelling construction.
Building construction as a share of total work done in construction fell to an historical low of 38.3% in 2012,
followed by an upturn in 2013 and 2014 in line with the residential building recovery and higher levels of
commercial building work.
The location of construction work has shifted during this period as well, reflecting the locations of the mining
boom (Western Australia and Queensland) versus the main locations of residential construction (NSW,
Victoria and Queensland, in line with those states' larger population size and growth). The value of all
construction work being done peaked in Western Australia and Queensland in 2012 and in the Northern
Territory in 2014. NSW construction activity peaked in 2012, while Victoria is peaking in 2015 (see Chart 3).
The Federal Department of Industry and Science biannual Resources and Energy Major Projects report (April
2015) provides further confirmation of the downward investment trend in in resources and energy. Projects at
the committed stage (see chart 4) had a combined value of $225.8 billion as at April 2015 (these are projects
that have been approved, financed and work is ready to commence). This was $1.9 billion less than in
October 2014. The report predicts further declines in committed projects that will not be offset by new
investments coming through the pipeline which are increasing being delayed by adverse market conditions.

                       Table 1: Value of Construction Work Done (real volumes)
Real Value (chain volume                   2012             2013        2014     Q1 2014         Q1 2015
measures as at Q1 2015)                    $ bn             $ bn        $ bn   % change p.a.   % change p.a.
Residential Building                      48.0             49.6         54.5     8.4               11.4
Non-Residential Building                  33.7             34.5         35.1     4.2               1.2
Total Building                            81.7             84.1         89.7     6.7               7.4
Engineering Construction                 131.4            127.0        114.7     -2.5             -20.3
Total Construction                       213.1            211.1        204.5     1.1               -8.8
Shares of total (%)                        %                %            %
Residential Building                      22.5             23.5         26.6
Non-Residential Building                  15.8             16.3         17.2
Total Building                            38.3             39.8         43.8
Engineering Construction                  61.6             60.2         56.1
Source ABS Construction Work Done, Australia, Preliminary, Mar 2015.

                      Chart 2: Value of Construction Work Done (real volumes)

Source: ABS Construction Work Done, Australia, Preliminary, Mar 2015

                                                                                                            3
Chart 3: Value of Construction Work Done (real volumes)

Source: ABS Construction Work Done, Australia, Preliminary, Mar 2015

              Chart 4: Current major resource projects at the 'committed' stage

          Source: DIS Major Resource Projects Report, April 2015.

                                                                                  4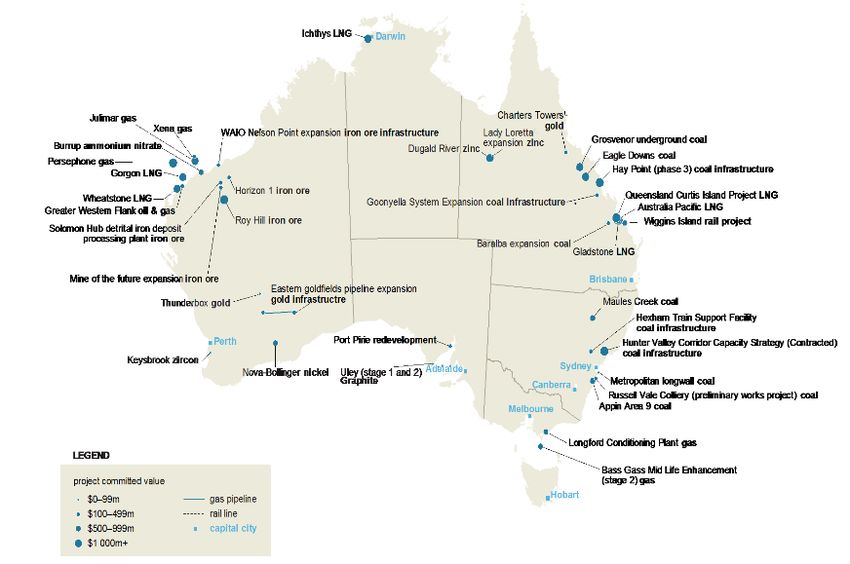
These trends are in line with the findings from the Australian Industry Group/HIA Performance of Construction
Index (Australian PCI®) which show that the broader construction sector continues to be hamstrung by the
structural retreat of engineering construction (see chart 5). By June 2015, engineering construction had
contracted for 12 consecutive months in response to weaker mining-related projects and major infrastructure
construction activity nationally. This contraction in engineering construction is continuing to outweigh the
growth in house and apartment building. As a consequence, 2014-15 has been characterised by monthly
Australian PCI® readings below the 50 point level that indicates industry-wide contraction, with businesses
engaged in engineering and commercial projects reporting limited investment activity by clients, a lack of
public sector tenders and intense competition for the available work.

      Chart 5: Ai Group/HIA Performance of Construction Index (Australian PCI®)

Source: Australian Industry Group, July 2015

CONSTRUCTION BUSINESSES
Approximately 338,000 businesses were registered as operating in the construction industry as of June 2014
(ABS business register). See table 2. These included project based businesses (major builders and
contractors, designers, engineers, project managers); property sector businesses (organisations that develop,
commission, own, manage and lease buildings and other infrastructure) and; the traditional construction
trades (concreting, bricklaying, structural steel and carpentry services).
Due to the construction industry’s diverse range of products and services, and its traditional structure of sub-
contracted and legally licenced trade specialisations, few individual businesses grow to a size that commands
a substantial market share. As such, the industry is overwhelmingly comprised of small businesses with fewer
than 20 employees (98.6% of construction businesses). Indeed, 60% of construction businesses are sole
operators with no employees. The majority (82.2%) of these small businesses operate in the trade services
sector of the building industry that includes plumbers, electricians, plasterers and a myriad of other specialist

                                                                                                             5
building trades. Medium sized businesses (employing between 20 and 200 employees) made up 1.3% of the
total number of businesses while medium to large businesses (employing 200 or more persons) accounted
for just 0.1% of the total. Whilst the majority of companies participating in the industry are Australian-owned,
the majority of tier one contractors are foreign-owned, if not foreign controlled.
Only 5.9% of construction businesses generated more than $2 million of revenue in 2013-14, while the
majority (60.8%) generated revenue of less than $200,000.
Table 2: Distribution of businesses by employment size -June 2014
Employee range Number of businesses Share of businesses (%)
Non-employing 55,329 60.0
1-19 13,165 38.6
20-199 10,514 1.3
200+ 259,218 0.1
Total 338,226 100.0
Source: ABS: Counts of Australian Businesses, June 2014
CONSTRUCTION EMPLOYMENT
The construction industry is the third largest employing industry in Australia (behind only healthcare and retail
trade), with 1.05 million employees (around 9% of all workers) in May 2015 (see chart 6).
Employment in the industry has been characterised by relatively solid recovery in 2013 and outright growth
through 2014. This reflects employment gains in the building construction sector due to the recovery in
housing and apartment building activity. Despite job losses in the engineering (heavy and civil) construction
sector in 2014 and 2015, total construction employment has strengthened. This reflects a solid pick-up in
construction services' employment and continued jobs growth in the building construction sector. Reflecting
their bigger populations, employment in the construction industry is concentrated in New South Wales,
Victoria and Queensland. These three states together account for 74% of all construction employment.
The majority of construction workers (65%) are employed in trade services. 26% are in building construction,
7% are in heavy and civil construction and 2.5% are in general construction services.
At a more detailed level, the largest segment of construction employment is 'Building Installation services',
which employed 232,700 workers (23% of industry employment) in February 2015. Other large employing
sectors include building completion services (192,400 or 19%), residential building construction (100,900 or
10%) and other construction services (98,900 or 10%) (see chart 7).
By state, New South Wales recorded the largest growth in construction industry employment in the five years
to February 2015, (up 30,300 or 11%). Although Western Australia accounts for only 14.2% of total
construction employment, over the five years to February 2015 it accounted for one third of employment
growth in the industry (up 19,900). In contrast, declines in construction industry employment over this 5 year
period were recorded in Queensland (down 14,900 or 6.5%), South Australia (8,000 or 12%) and Tasmania
(1,700 or 8.5%). See chart 8.
Notable employment and employee characteristics in this industry include far higher shares of full-time, male,
younger, self-employed, certificate-qualified workers than for most other industries:
85% of construction workers are full-time, compared with 54% across all industries, and 15% were part-
time, compared to 31% for all industries (as of Feb 2015).
average hours worked per week by construction employees was 38.3 hours in May 2015, compared to
33.9 hours for employees in all industries. It has the fourth highest average hours worked of any industry,
exceeded only by mining (43.5 hours), agriculture (40 hours) and wholesale trade (38.6 hours).
89% of construction workers are male, compared with 54% across all industries (in February 2015). "Male
representation is particularly high in Building Structure Services (92.6%) and Building Completion
Services (92%)." 2
2
Department of Employment, Industry Outlook Construction, May 2015.
6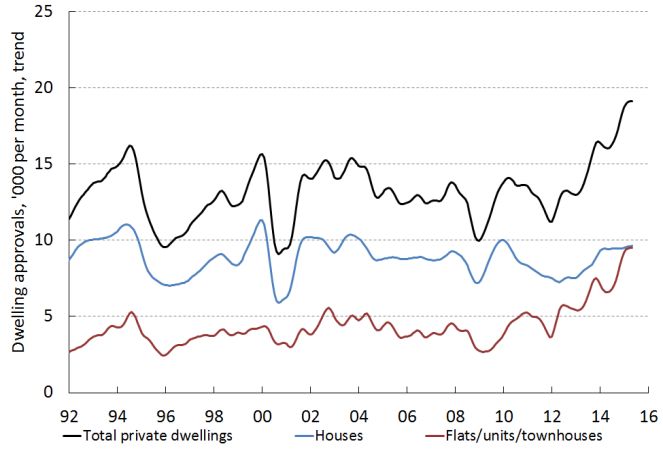
"the construction industry has a relatively young workforce, with 43% of workers aged 15 to 34 years,
compared with 38% across all industries. The industry is the largest employer of young full time workers,
employing 152,100 or 17% of all full-time workers aged 15 to 24 years in February 2015. By contrast,
older workers are under-represented in the construction industry, likely due to the manual labour roles
dominant in the industry, with 35% aged 45 years or over, compared with 39% across all industries. The
median age of workers in the industry was 38 years in 2014, slightly below the median age of 40 years
recorded across all industries. Notably, despite remaining dominated by younger age groups, the
workforce age profile of the Construction industry has become older over the past 20 years, in line with
broader demographic trends. Indeed, the share of the industry’s workforce aged 55 and over has risen by
7.2 percentage points over the past two decades to stand at 15.8% in February 2015"3.
30% of construction workers are self-employed, compared to only 8.5% for all industries (see table 3)
45% of construction industry workers have completed a certificate III or IV qualification (see chart 9). This
is well above the share for all industries (20%).
In contrast, 8% of construction industry workers have attained a Bachelor Degree or higher, compared
with 28% for all industries.
The most common occupations in the construction industry in 2014 were carpenters and joiners (105,900),
electricians (87,900) and plumbers (73,600).
Average Weekly Ordinary Time Earnings for full-time workers (AWOTE) in construction was $1,475.10,
just below the AWOTE for all industries of $1,477.00 (November 2014, latest available data).
The national Wages Price Index (WPI) for construction industry wage and salary workers (total hourly
rates of pay excluding bonuses) increased by 1.8% p.a. in the March quarter 2015, compared with 2.3%
p.a. growth for all industries (see table 4).
Chart 6: Persons Employed in construction, by major sector
Source: ABS, Labour Force, Australia, Detailed Quarterly, May 2015.
Table 3: Forms of employment, construction and all industries (2013 & 2014)
All employees (May 2014) Forms of employment (Nov 2013)
Part- Paid No paid Independent Business
People Female
time leave leave contractors operators
‘000 % % % % % %
Construction 1,029.2 15.5 11.4 48.1 12.7 29.7 9.5
All industries 11,529.9 30.4 45.7 63.3 19.4 8.5 8.8
3
Department of Employment, Industry Outlook Construction, May 2015.
7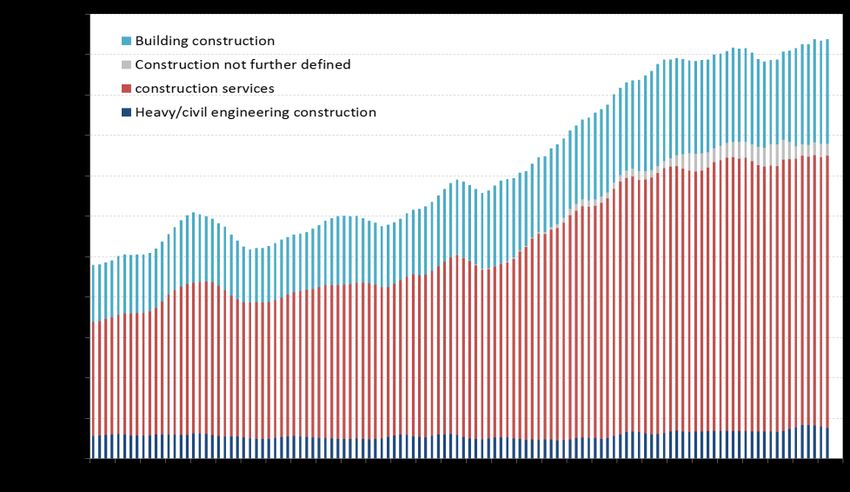
Chart 7: Construction employment and growth, by detailed sector, February 2015

Source: ABS, Labour Force, Australia, Detailed, Quarterly, cat. no. 6291.0.55.003, Department of Employment trend.

      Chart 8: Construction industry employment growth, by State, February 2015

Source: ABS, Labour Force, Australia, Detailed, Quarterly, cat. no. 6291.0.55.003, Department of Employment trend.

                      Chart 9: Highest educational attainment, % of employees

Source: ABS, Survey of Education and Work, 2013.

                                                                                                                     8
Table 4: ABS wage measures, construction and all industries
Wage price index Full time adult average weekly ordinary
(private sector), Q1 2015 time earnings (AWOTE), Nov 2014
q/q % y/y % $ per week
Construction 0.3 1.8 1,475.10
All industries 0.6 2.4 1,477.00
Sources: ABS, Wage Price Index, Australia, Cat no. 6345.0, Mar 2015 and Average Weekly Earnings, Australia, Cat no. 6302.0, Nov 2014.
The next WPI for Q2 (the June quarter) 2015 will be released on 12 August 2015.
For more information from the ABS, go to www.abs.gov.au and follow the subject links or catalogue numbers.
CONSTRUCTION PROFITS AND MARGINS
In 2013-14 (the most recent full financial year of data available), construction businesses in aggregate
generated $31.6bn in operating profits before tax, or 9.5% of all industries' profits that year (see table 5).
Around 60% of construction industry profits come from construction services. Since then, the latest data on
gross operating profits suggests a lift in aggregate profits earned by construction companies through 2014-15,
reflecting stronger levels of activity (see chart 10). Profit margins have however, remained tight, suggesting
strong competition for building sector work and a corresponding lack of pricing freedom. Construction
materials price rises (e.g. as metals prices soared) have also been a source of cost pressure in recent years.
Most recently, a smaller pipeline of new work due to the scaling back in mining-related engineering
construction has exerted additional downward pressure on profits in engineering-related work.
Table 5: Construction industry operating profits before tax (nominal)
Operating profit before tax ($ million) 2010-11 2011-12 2012-13 2013-14
Building (res. & non-res.) 9,592 8,110 7,708 9,198
Heavy & Civil Engineering 1,434 1,857 -1,137 3,688
Construction Services 19,256 19,581 18,183 18,708
Total Construction 30,282 29,548 24,754 31,594
All Industries 345,876 353,496 315,115 332,931
Source: ABS Australian Industry, 2013-14
Chart 10: Gross operating profits (nominal)
Source: ABS Business Indicators, Mar 2015.
9CONSTRUCTION ACTIVITY OUTLOOK
The latest data points to a fragmented outlook for Australia’s construction industry.
The downturn underway in engineering construction is expected to continue, as mining-related construction
and related infrastructure investment falls further from its recent peaks (see Chart 11). The latest estimates of
private sector capital expenditure (CAPEX) indicates that total private investment in building and structures
was down by 11.5% p.a. in 2014-15 (in nominal value terms) and will fall by a further 25.2% in 2015-16.
This downward trend mainly reflects the rapid decline in engineering investment by the resources sector (see
chart 11). Mining investment in buildings, structures, plant and equipment fell by 4.1% q/q (and -13.7% p.a.)
in Q1 of 2015, the sixth consecutive quarter of decline. The outlook for mining industry investment indicates
further falls, with an 18.7% decline in investment expected to have occurred in 2014-15 and another 31% fall
expected in 2015-16 (in nominal terms).
This decisive end to the mining investment 'boom' is not being replaced by greater investment activity from
other, non-mining industries. Manufacturing investment in buildings, structures, plant and equipment is
expected to be 5.6% p.a. lower in 2014-15 and 21% p.a. lower in 2015-16, as the demise of the automotive
sector and other factors weigh on local manufacturers' investment and expansion plans. Up until a decade
ago, manufacturing and mining were responsible for around the same levels of annual investment spending,
but the level and share of investment coming from manufacturing has progressively dwindled since peaking in
2006 (see chart 11). Across other private-sector industries (e.g. utilities, retail, wholesale, transport and
finance), a lift in total investment is expected in 2014-15 (up 9.2% in nominal terms), followed by lower
spending in 2015-16 (-7.3% p.a.).
Chart 11: Actual and expected CAPEX, by major industry group
Source: ABS, CAPEX, Mar 2015.
A similar story is evident in the May 2015 Australian Industry Group/Australian Constructors Association
Construction Outlook survey. This reveals that revenue from major project activity in Australia is forecast to
fall by 4.3% (current dollars) in 2015 following a 3.6% decline in 2014. A further fall of 1.7% is projected for
2016. This largely reflects the continued declines in mining-related engineering construction (see Table 6).
The Ai Group Outlook Survey indicates that mining-related construction is expected to decline by 16.8% in
2015, in response to falling commodity prices and the completion of a number of major projects. Reduced
resources investment is also contributing to a decline of 3.2% in heavy industrial resource-based
construction. The value of oil and gas related construction projects is set to fall by 17.5% p.a. in 2016, as a
number of the large-scale LNG projects finish construction later this year and in 2016. This includes projects
underway at Curtis Island off the Queensland coast (planned for completion by the end of 2015) as well as
the Wheatstone LNG (2016) and Gorgon LNG (2016) projects.
10Table 6: Resource Construction Outlook (% change p.a. in revenue*)
Sector 2014 2015 (f) 2016 (f)
Mining-related construction -2.8 -16.8 -12.0
Heavy industrial construction
1. Chemical, petro-chemical plants -4.4 -13.5 -8.9
2. Oil and gas processing 0.1 -1.1 -17.5
3. Other “downstream” processing plants 0.5 -5.4 -7.9
Total Heavy Industrial (1-3 above) -0.2 -3.2 -14.6
Source: Australian Industry Group, May 2015 Construction Outlook survey *nominal dollars.
The effect of the downturn in resource-related engineering construction in 2015 and 2016 will be partly offset
by better conditions in some other key infrastructure project categories (see table 7). Revenue derived from
road and rail projects for example, is expected to grow in 2016 in line with Federal and State Government
plans to commence a number of major transport projects (see chart 12).
In telecommunications, construction work is expected to be broadly sustained at current levels of activity over
the next two years, in line with the rollout of the NBN and 4G network developments. However, the recent
decline in capital investment in power and water infrastructure (following large investments over the past
decade) is expected to continue, with falls of between 10% p.a. and 13% p.a. in the value of utilities
construction projects such as electricity generation and supply and sewerage, drainage and water supply.
Table 7: Infrastructure Construction Outlook (% change p.a. in revenue*)
Sector 2014 2015 (f) 2016 (f)
1.Transport – road and rail -7.7 -0.3 10.6
2.Telecommunications -3.1 -2.0 3.3
3.Utilities -13.9 -11.3 -13.4
4.Other - (pipelines, dams, bridges, wharves) 5.0 -9.9 -6.1
Total Infrastructure ( 1-4 above) -7.6 -4.9 2.0
Source: Australian Industry Group, May 2015 Construction Outlook survey * nominal dollars.
Chart 12: Major road projects (> $1 billion) - Australia
$ Billion Forecast
6.0 NorthConnex
Gateway Western Sydney
Princes Highway M1 - M2 Link (NSW) Airport Roads (NSW)
Motorway
upgrades
North-South North Toowoomba Second
(NSW / VIC)
Bypass Tunnel (QLD) Range Crossing (QLD)
(QLD) Pacific Motorway
East North - South Bruce Highway
Corridor (SA) upgrades (QLD)
Lane Cove Link upgrades
Tunnel (VIC) (QLD) WestConnex
(NSW) Upgrade Stage 2 (NSW)
M80 (VIC) Legacy Way
(QLD) WestConnex
Cross
City Stage 1 (NSW)
Tunnel East-West Link
(NSW) East West Link
(QLD)
Airport Link
(VIC)
(QLD)
WestConnex
M7 Stage 3
(NSW) (NSW)
Pacific Highway upgrades (NSW)
0.0
2003 2006 2009 2012 2015 2018 2021 2024
Year ended June Source: BIS Shrapnel
11Non-residential building activity (commercial construction) is expected to remain subdued into 2016, reflecting
persistent weakness in approvals and building commencements across most major commercial property
markets. Constrained public sector investment and weak white collar employment growth (two of the main
drivers of office construction), poor growth in local retail spending (the main driver of growth in retail
construction) and poor investor sentiment continue to weigh heavily on the commercial construction industry’s
pipeline of work. Accordingly, results from the Ai Group Construction Outlook survey point to relatively weak
annual growth in turnover from non-residential building work in both 2015 and 2016 (see table 8). Public
sector commercial building work is expected to be flat, while private sector commercial building activity is
expected to improve modestly through 2015 and 2016.
Table 8: Commercial Construction Outlook (% change p.a. in revenue*)
2014 2015 (f) 2016 (f)
1.Private sector 2.3 2.5 3.5
2.Public sector -1.7 0.3 -0.1
Total commercial 0.0 1.3 1.5
Source: Australian Industry Group, May 2015 Construction Outlook survey * nominal dollars, not adjusted for inflation.
Across the key project areas in commercial construction, there is currently a pipeline of work valued at around
$23bn waiting to be completed (see table 9). This includes:
office construction which is facing a thinning project pipeline and patchy demand for office space.
health building investment levels have been strong, with an aging population and urban sprawl driving
demand for aged care facilities and hospitals, including health facilities servicing regional communities.
There is likely to be a drop in large projects in the pipeline in 2015 (-16.5% reduction in investment
pipeline) as existing large projects move close to completion.
industrial building and warehousing is expected to remain mixed. Subdued conditions and excess
capacity in manufacturing are likely to continue to weigh heavily on demand for factory space. However,
the trend towards warehouse storage and distribution centres on transport corridors is likely to continue to
support other forms of industrial construction.
retail building and wholesale premises construction is likely to drop in 2015 with the investment pipeline
falling by 24.1% in the year to the March quarter 2015. Subdued consumer sentiment, weak retail
spending growth and competition from on-line retailers are key challenges for the sector.
entertainment and recreation building is expected to show solid growth over the next three years (with the
pipeline already up 122%) reflecting a boost from the 2018 Commonwealth Games facilities on the Gold
Coast, the new Sydney Entertainment and Convention Centre, and other sporting facilities.
accommodation and hotel construction is expected to push higher over the next three years in response
to a strong increase in the demand pipeline. The lower Australian dollar is encouraging international
visitor arrivals and increasing the attractiveness of domestic travel. Deloitte Access Economics forecasts
that national hotel demand – measured as room nights sold – will rise by 2.5% p.a. on average over the
three years to December 2017. The projected average supply growth over the same period is less than
half the pace of demand at 1.2% p.a.
Table 9: Work yet to be done - March quarter 2015
Investment pipeline as at March (% change - year to March quarter 2015)
Industry quarter 2015 ($ billion)
Wholesale and retail 2.55 -24.1
Offices 4.35 -23.0
Industrial 1.83 -18.9
Entertainment 2.26 122.0
Accommodation 1.86 89.3
Health 5.99 -16.5
Education 1.97 -29.3
Total non-residential 23.2 -10.4
Source: ABS, Construction Work Done, preliminary, Mar 2015.
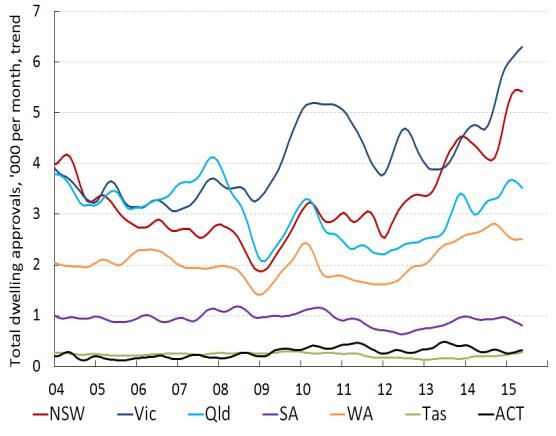
12Residential building activity continues to charge ahead in 2015, reflecting buoyant new apartment approvals,
particularly in Sydney and Melbourne. The number of total dwelling units approved in May 2015 was up
17.6% p.a., mainly due to the strength in approvals for apartments (“other dwellings” in the ABS data), which
rose by 46% p.a. to a near-record high of around 10,000 approvals per month (see chart 13).
Chart 13: Private residential building approvals (trend)
By type By state
Source: ABS, Building Approvals Australia, May 2015
The latest Ai Group Construction Outlook survey (May 2015) suggests growth in the value of apartment
construction of 14.9% p.a. in 2015. Further growth of 4.1% p.a. is expected in 2016, in response to sustained
demand for new residences (see table 10). The drivers of residential construction suggest further growth in
residential building activity over the remainder of 2015 and into 2016. These factors include elevated
approvals, low mortgage interest rates, strong population growth and urban transport infrastructure
developments.
Table 10: Apartments Construction Outlook (% change p.a. in revenue*)
2014 2015 (f) 2016 (f)
Multi-apartment complexes 7.1 14.9 4.1
Source: Australian Industry Group, May 2015 Construction Outlook survey * nominal dollars
CONSTRUCTION EMPLOYMENT OUTLOOK
Based on recent labour market trends, the Australian Government Department of Employment (May 2015)
expects growth in construction industry employment of 137,900 (13%) over the five years to November 2019.
This is well above the growth rate of 10% that it expects for total employment, so construction will account for
a greater share of employment (and of employment growth) over this forward period.
The Department expects construction employment growth over the five years to November 2019 to be
strongest in the Building Installation Services sector (up by 50,400 or 21%), followed by Building Completion
Services (24,800 or 13%), Other Construction Services (15,800 or 14%) and Building Structure Services
(12,600 or 16%) (see chart 14).
Reflecting the subdued outlook for major engineering project activity, employment in the Heavy and Civil
Engineering Construction sector is expected to decline over the five years to November 2019 (down by 6,500
or 8.3%), with conditions expected to be constrained by fewer new mining-related engineering projects.
The latest Ai Group Construction Outlook survey (May 2015) similarly forecasts a deteriorating outlook for
non-residential construction employment in 2015, with a fall of 1% p.a. expected In the year to December
2015, following a 1.6% decline in the year to February 2015. A smaller pipeline of new projects and the
deferral of some existing projects will see falls in employment concentrated in the on-site and sub-contracted
13trades. The number of on-site employees and sub-contract tradesmen is forecast to fall by 1.4% p.a. and
1.0% p.a. respectively by December 2015. In contrast, off-site construction employment is expected to rise
marginally by 0.6% over this year to December 2015.
Chart 14: Projected employment growth (‘000) by Construction industry sector:
five years to November 2019
Source: Department of Employment, 2015 Employment Projections to November 2019.
Ai Group Economics and Research Team
Julie Toth Chief Economist (03) 9867 0124
Pip Freebairn Senior Adviser, Economic Policy (03) 9867 0261
Yi Ming Hu Economist (03) 9867 0231
David Richardson Manager, Economics and Business Services (02) 9466 5456
Colleen Dowling Senior Research Coordinator (part time) (03) 9867 0251
Elle Spyropoulos Research Assistant (part time) (03) 9867 0108
14You can also read