Australian crop report - Department of ...
←
→
Page content transcription
If your browser does not render page correctly, please read the page content below
Australian crop report
Prepared by the Australian Bureau of Agricultural and Resource
                                      Economics and Sciences
                                                    No. 192
                                              December 2019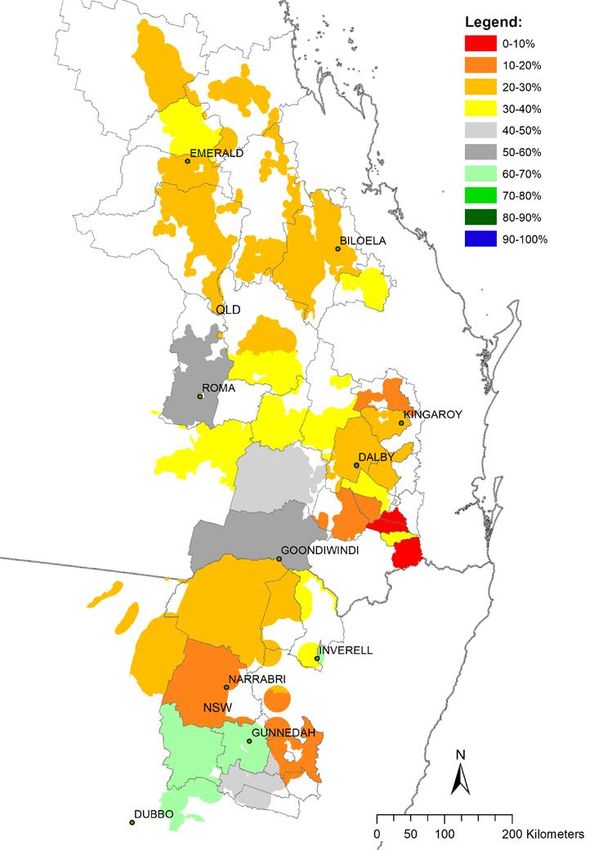
© Commonwealth of Australia 2019

Ownership of intellectual property rights

Unless otherwise noted, copyright (and any other intellectual property rights, if any) in this publication is owned by
the Commonwealth of Australia (referred to as the Commonwealth).

Creative Commons licence

All material in this publication is licensed under a Creative Commons Attribution 4.0 International Licence except
content supplied by third parties, logos and the Commonwealth Coat of Arms.

Inquiries about the licence and any use of this document should be emailed to copyright@agriculture.gov.au.

Cataloguing data

ABARES 2019, Australian crop report, Australian Bureau of Agricultural and Resource Economics and Sciences,
Canberra, September. CC BY 4.0. https://doi.org/10.25814/5de06ae055ba7

ISSN 1447-8358

ISBN 978-1-74323-456-3

ABARES project AWP12

Internet

This publication is available at agriculture.gov.au/abares/research-topics/agricultural-commodities/australian-crop-
report

Department of Agriculture

GPO Box 858 Canberra ACT 2601

Telephone 1800 900 090

Web agriculture.gov.au

The Australian Government acting through the Department of Agriculture, represented by the Australian Bureau of
Agricultural and Resource Economics and Sciences (ABARES), has exercised due care and skill in preparing and
compiling the information and data in this publication. This publication has been compiled from a wide range of
publicly available information and other information obtained through consultations with experts and
representatives from industry. Such information has not been independently verified.

The purpose of this publication is to provide a high level overview of domestic commodities for information only, it is
not intended to be relied on as a comprehensive representation of Australia’s agricultural sector or used for
commercial purposes. The Department of Agriculture, ABARES and its employees do not accept responsibility for the
accuracy or completeness of the contents and disclaim all liability, including liability for negligence and for any loss,
damage, injury, expense or cost incurred by any person directly or indirectly as a result of accessing, using or relying
on any of the contents of this publication to the maximum extent permitted by law.

The next issue of Australian crop report is scheduled to be released on Tuesday 18 February 2020.

In the next issue:

2019–20 winter crop area estimates and production estimates updated

2019–20 summer crop area and production forecasts updated

Acknowledgements

This report was prepared by Amelia Brown, Benjamin K Agbenyegah, Charley Xia, Chris Mornement and Matthew
Miller.
Australian crop report December 2019               ABARES

Contents
National overview                                                                          1
Climatic and agronomic conditions                                                          5
Crop conditions and production forecasts, by state                                        11
    New South Wales                                                                       11
    Queensland                                                                            12
    Victoria                                                                              14
    South Australia                                                                       15
    Western Australia                                                                     16
Statistical tables                                                                        18

Tables
Table 1 Winter crop production, Australia, 2009–10 to 2019–20                              2
Table 2 Winter crop area, Australia, 2009–10 to 2019–20                                    3
Table 3 Summer crop area and production, Australia, 2009–10 to 2019–20                     4
Table 4 Winter crop forecasts, New South Wales, 2019−20                                   11
Table 5 Summer crop forecasts, New South Wales, 2019−20                                   12
Table 6 Winter crop forecasts, Queensland, 2019−20                                        13
Table 7 Summer crop forecasts, Queensland, 2019−20                                        14
Table 8 Winter crop forecasts, Victoria, 2019–20                                          15
Table 9 Winter crop forecasts, South Australia, 2019–20                                   16
Table 10 Winter crop forecasts, Western Australia, 2019–20                                17
Table 11 Winter crop production and area, Australia, 2017–18 to 2019–20                   18
Table 12 Summer crop production and area, Australia, 2017–18 to 2019–20                   18
Table 13 Production, major crops, Australian states, 2017–18 to 2019–20                   19
Table 14 Production, other crops, Australian states, 2017–18 to 2019–20                   21
Table 15 Supply and disposal of wheat, canola and pulses, Australia, 2013–14 to 2018–19   23
Table 16 Supply and disposal of coarse grains, Australia, 2013–14 to 2018–19              24
Table 17 Grain, oilseed and pulse prices, first quarter 2018 to third quarter 2019        25

                                                 iii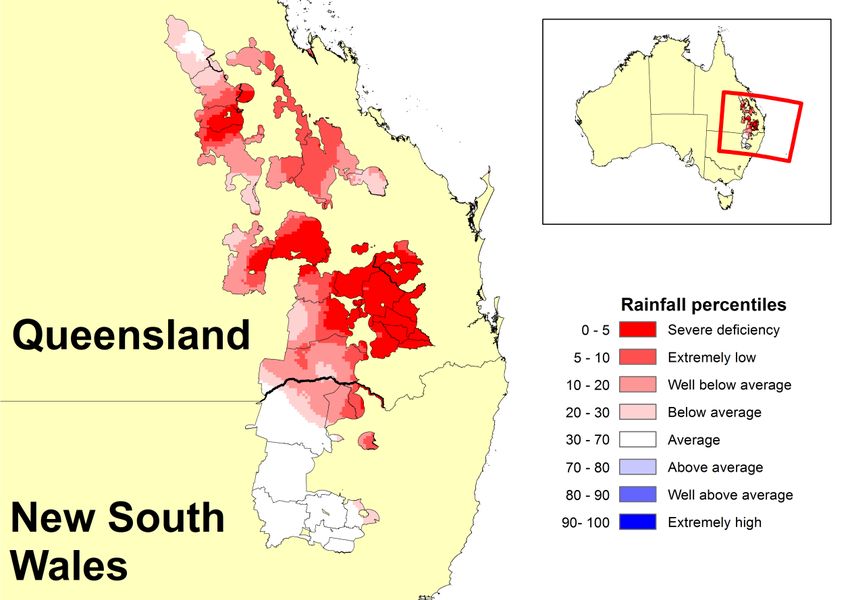
Australian crop report December 2019                 ABARES

Maps
Map 1 Australian rainfall percentiles, 1 August to 31 October 2019              5
Map 2 Australian rainfall percentiles, 1 to 25 November 2019                    6
Map 3 Modelled root zone soil moisture, as at 25 November 2019                  7
Map 4 Rainfall outlook, December 2019 to February 2020                          8
Map 5 Probability of exceeding long-term median grain sorghum yield             9
Map 6 Chance of achieving 290 millimetres of water availability                10

                                               iv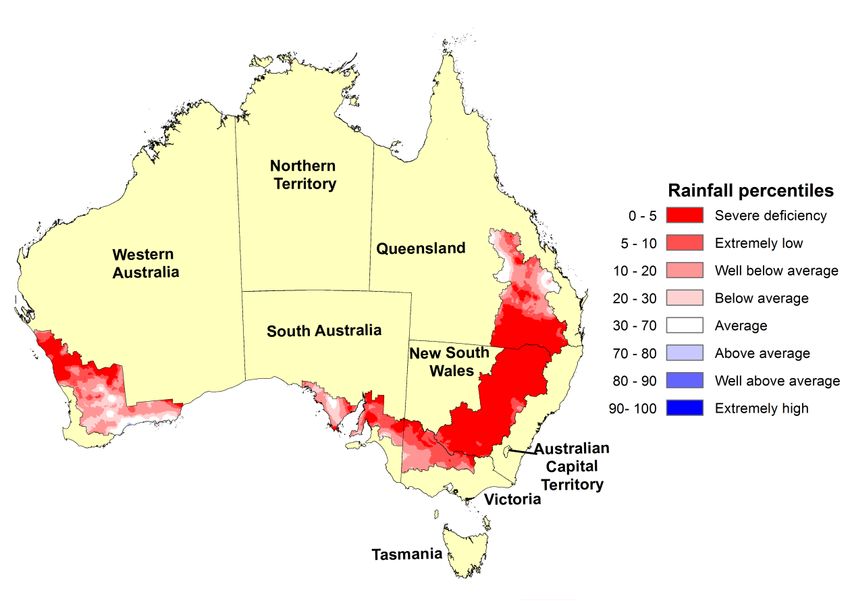
Australian crop report December 2019                  ABARES

National overview
Australian winter crop production was adversely affected by seasonal conditions in early spring
that were more unfavourable than expected in most cropping regions, particularly in Western
Australia and southern New South Wales. Rainfall was below average and daytime temperatures
above average in most cropping regions. The unfavourable seasonal conditions reduced crop
prospects in most cropping regions but the changes in Western Australia and southern New
South Wales were the most significant in reducing national production prospects. In contrast,
yields in most southern cropping regions in South Australia and Victoria are expected to be
average to above average where timely spring rainfall fell.

Harvest is underway in many regions but rainfall in early November slowed progress in
southern New South Wales, Victoria and South Australia. According to the latest rainfall outlook,
issued by the Bureau of Meteorology on 21 November 2019, December rainfall is likely to be
below average in most cropping regions.

Winter crop production is forecast to fall by 3% in 2019–20 to 29.4 million tonnes, which is a
downward revision of 13% from the forecast ABARES published in September. Forecast
production is around 27% below the 10-year average to 2018–19 and is set to fall for the third
consecutive year since record high production was achieved in 2016–17. Winter crop
production in Victoria is expected to account for around 24% of national production, compared
to an average of 16% over the 10-years to 2018–19.

For the major winter crops, wheat production is forecast to decrease by 8% to around
15.9 million tonnes, 35% below the 10-year average to 2018–19. Barley production is forecast
to increase by 4% to around 8.7 million tonnes, 3% below the 10-year average to 2018–19.
Canola production is forecast to fall by 4% to around 2.1 million tonnes, 35% below the 10-year
average to 2018–19.

Amongst other crops, chickpea production is forecast to rise by 2% to 289,000 tonnes and oats
production is forecast to rise by 5% to 935,000 tonnes.

                                                1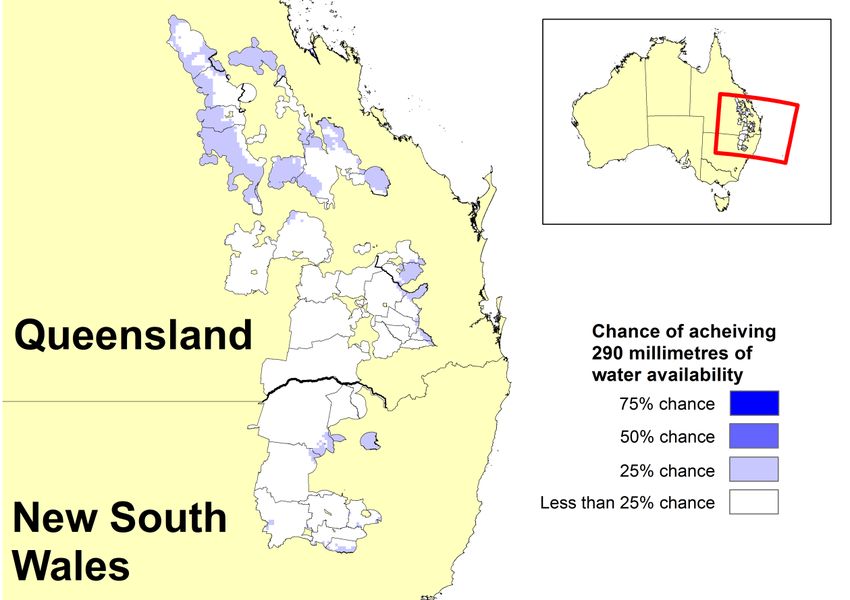
Australian crop report December 2019                                      ABARES

Table 1 Winter crop production, Australia, 2009–10 to 2019–20
 Year                  Unit     New South          Victoria      Queensland           South          Western         Australia
                                   Wales                                           Australia        Australia
 2009–10                  kt           7787           5,889              1,617          7,035           12,943          35,343
 2010–11                  kt          14784           7,625              1,821          9,316            8,044          41,672
 2011–12                  kt         11,952           7,352              2,329          7,371           16,600          45,673
 2012–13                  kt         11,123           6,886              2,156          6,470           11,244          37,936
 2013–14                  kt          9,773           6,774              1,516          7,221           16,511          41,881
 2014–15                  kt         10,445           5,117              1,464          7,439           14,662          39,198
 2015–16                  kt         11,624           3,568              2,104          6,104           14,206          37,687
 2016–17                  kt         15,510           9,511              3,159         10,656           17,737          56,675
 2017–18                  kt          7,743           7,612              1,438          7,022           14,510          38,396
 2018–19 s                kt          2,880           3,733                714          5,286           17,729          30,433
 2019–20 f                kt          3,616           7,184                678          6,279           11,550          29,405
 % change
 2018–19 to                               26              92                 -5             19              -35               -3
 2019–20
f ABARES forecast. s ABARES estimate.
Notes: Includes barley, canola, chickpeas, faba beans, field peas, lentils, linseed, lupins, oats, safflower, triticale and wheat.
Due to a change in scope by the ABS of its agricultural data collections, crop production is shown for establishments with an
estimated value of agricultural operations (EVAO) of $5,000 or more until 2014–15, and an EVAO of $40,000 or more from
2015–16.
Sources: ABARES; ABS

Area planted to winter crops is estimated to have increased to just under 18.1 million hectares,
partly because a smaller area of crops intended for grains and oilseeds production was cut for
hay this year than last year. The crops planted for grains and oilseeds production that were cut
for hay this year were in response to high fodder prices and unfavourable conditions in
September in regions with low levels of soil moisture at the beginning of spring.

                                                                2
Australian crop report December 2019                                      ABARES

Table 2 Winter crop area, Australia, 2009–10 to 2019–20
 Year                  Unit       New South       Victoria      Queensland            South          Western         Australia
                                     Wales                                         Australia        Australia
 2009–10            '000 ha             6,106         3,488              1,173          3,783            8,271          22,844
 2010–11            '000 ha             6,158         3,457              1,217          3,821            7,715          22,392
 2011–12            '000 ha             5,969         3,411              1,205          3,838            8,252          22,693
 2012–13            '000 ha             5,852         3,457              1,222          3,776            8,097          22,421
 2013–14            '000 ha             5,314         3,283              1,105          3,448            8,249          21,419
 2014–15            '000 ha             5,491         3,304                995          3,639            8,313          21,760
 2015–16            '000 ha             5,375         2,915              1,049          3,152            7,771          20,283
 2016–17            '000 ha             6,062         3,231              1,375          3,904            8,531          23,126
 2017–18            '000 ha             5,489         3,509              1,302          3,645            7,898          21,861
 2018–19 s          '000 ha             2,971         2,903                715          3,326            8,050          17,987
 2019–20 f          '000 ha             3,126         3,081                657          3,467            7,693          18,048
 % change
 2018–19 to                                  5             6                 -8              4               -4                0
 2019–20
f ABARES forecast. s ABARES estimate.
Notes: Includes barley, canola, chickpeas, faba beans, field peas, lentils, linseed, lupins, oats, safflower, triticale and wheat.
Due to a change in scope by the ABS of its agricultural data collections, crop production is shown for establishments with an
estimated value of agricultural operations (EVAO) of $5,000 or more until 2014–15, and an EVAO of $40,000 or more from
2015–16. Area based on planted crop that is harvested, fed off or failed.
Sources: ABARES; ABS

Area planted to summer crops is forecast to fall by 49% in 2019–20 to around
535,000 hectares, driven by significant expected falls in area planted to grain sorghum and
cotton. This reflects very low levels of soil moisture and an unfavourable outlook for seasonal
conditions during summer in Queensland and northern New South Wales.

The latest three-month rainfall outlook (December to February), issued by the Bureau of
Meteorology on 21 November 2019, indicates summer rainfall is likely to be very much below
average in most parts of Queensland and northern New South Wales. As a result, summer crop
production is forecast to decline by 52% to around 1.2 million tonnes.

Area planted to grain sorghum is forecast to fall by 51% in 2019–20 to 241,000 hectares. Early
planting was minimal and late planting would require significant rainfall, which is unlikely given
the latest three-month season outlook issued by the Bureau of Meteorology. Production is
forecast to more than halve to 398,000 tonnes, the lowest on record. The average yield is
assumed to fall by 36% from 2018–19.

Area planted to cotton is forecast to fall by 76% to 82,000 hectares because water levels in dams
servicing cotton growing regions are extremely low and soil moisture levels are insufficient to
enable planting of dryland cotton. The planted area is expected to be the lowest since 2007–08
when it was 63,000 hectares. Production is forecast to decline by 63% to around 177,000 tonnes
of lint and 251,000 tonnes of cottonseed. The average yield is forecast to rise from last season
because almost all planting this season is expected to be irrigated.

                                                                3
Australian crop report December 2019 ABARES
Area planted to rice is forecast to remain low at around 5,000 hectares in response to low water
allocations and high water prices.
Table 3 Summer crop area and production, Australia, 2009–10 to 2019–20
Year New South Wales Queensland Australia
'000 ha kt '000 ha kt '000 ha kt
2009–10 381 1405 514 1342 903 2764
2010–11 713 2514 790 1901 1514 4446
2011–12 757 3064 783 2379 1556 5489
2012–13 711 3205 686 2250 1411 5506
2013–14 568 2317 559 1469 1139 3847
2014–15 435 2044 696 2134 1149 4263
2015–16 412 1646 624 1814 1054 3552
2016–17 662 2289 566 1278 1247 3666
2017–18 614 2205 649 1648 1283 3952
2018–19 s 425 1019 617 1493 1056 2593
2019–20 f 166 482 356 684 535 1243
% change
2018–19 to
2019–20 -61 -53 -42 -54 -49 -52
f ABARES forecast. s ABARES estimate.
Note: State production includes cottonseed, grain sorghum, corn (maize), mung beans, rice, peanuts, soybeans and
sunflowers. Total for Australia also includes navy beans, and small areas and volumes of summer crops in other states.
Due to a change in scope by the ABS of its agricultural data collections, crop production is shown for establishments with an
estimated value of agricultural operations (EVAO) of $5,000 or more until 2014–15, and an EVAO of $40,000 or more from
2015–16. Area based on planted crop that is harvested, fed off or failed.
Sources: ABARES; ABS
4Australian crop report December 2019 ABARES
Climatic and agronomic conditions
Rainfall from August to October 2019 was generally extremely low to well below average across
most cropping regions in New South Wales, southern Queensland, northern Victoria, north-
eastern cropping regions in South Australia and northern cropping regions in Western Australia
(Map 1). Over the same period, rainfall in northern cropping regions in Queensland, western
South Australia and southern Western Australian was generally below average to average, which
was largely the result of below average rainfall during October.
Maximum daytime temperatures during late winter and spring were generally above average in
most cropping regions. In contrast, there were numerous frost events and lowest minimum
temperatures on record in southern Australia in September.
Map 1 Australian rainfall percentiles, 1 August to 31 October 2019
Note: Rainfall percentages are displayed for wheat–sheep zone only. Rainfall for August to October 2019 relative to the
long-term record and ranked in percentiles. This analysis ranks rainfall for the selected period compared with the historical
average (1900 to present) recorded for that period.
Source: Bureau of Meteorology
November rainfall, as at 26 November 2019, was around average in most summer cropping
regions in northern New South Wales but below average in almost all summer cropping regions
in Queensland (Map 2).
5Australian crop report December 2019 ABARES
Map 2 Australian rainfall percentiles, 1 to 25 November 2019
Note: Rainfall percentages are displayed for summer cropping regions only. Rainfall for 1 to 26 November 2019 relative to
the long-term record and ranked in percentiles. This analysis ranks rainfall for the selected period compared with the
historical average (1900 to present) recorded for that period.
Source: Bureau of Meteorology
Map 3 shows modelled root zone (0 to ~1 metres) soil moisture in millimetres for cropping
zones in New South Wales and Queensland as at 25 November 2019.
The modelled root zone soil moisture for November 2019 indicates stored soil moisture levels
are extremely low in summer cropping regions. (Map 3).
6Australian crop report December 2019 ABARES
Map 3 Modelled root zone soil moisture, as at 25 November 2019
Note: Root zone soil moisture is displayed for summer cropping regions only.
Source: Bureau of Meteorology
Due to the extremely low levels of root zone soil moisture, planting and yield prospects for
dryland summer crops will be almost entirely dependent on in crop rainfall during the
remainder of the growing season.
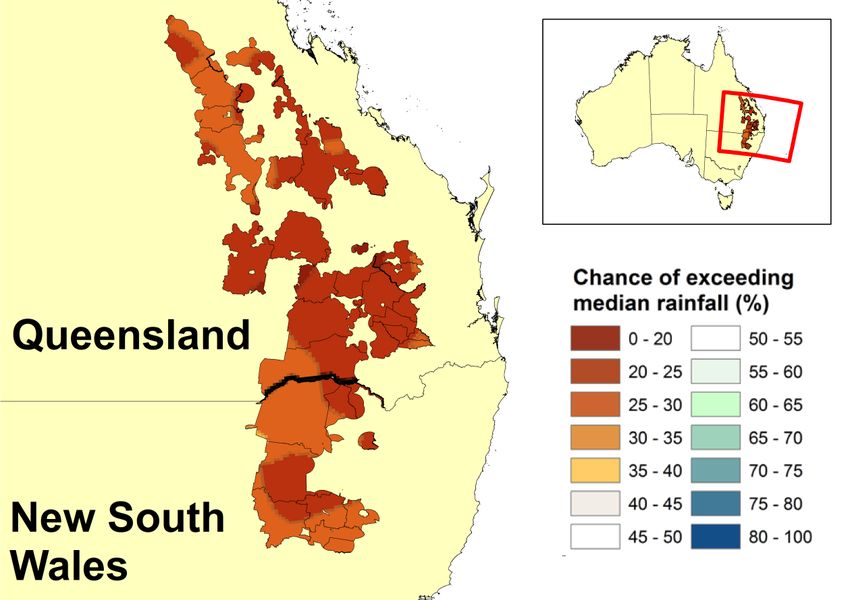
According to the latest three-month rainfall outlook (December to February), issued by the
Bureau of Meteorology on 21 November 2019, rainfall in summer cropping regions in New
South Wales and Queensland is likely to be below average (Map 4).
The outlook for maximum and minimum temperatures for summer 2019–20, indicates higher
than average daytime and night-time temperatures are likely in cropping regions in New South
Wales and Queensland.
7Australian crop report December 2019 ABARES
Map 4 Rainfall outlook, December 2019 to February 2020
Note: Rainfall outlook is displayed for sorghum producing shires only.
The map shows the likelihood of exceeding the 1990–2012 median rainfall. Median rainfall is defined as the 50th percentile
calculated from the 1990–2012 reference period.
Source: Bureau of Meteorology
Map 5 shows the shire-scale forecast of grain sorghum yields obtained from the University of
Queensland's Queensland Alliance for Agriculture and Food Innovation (QAAFI). These forecasts
are based on soil moisture conditions and the seasonal outlook, including the most recent trend
in the Southern Oscillation Index (SOI). It is important to note that final sorghum crop yield is
affected more by in-crop rainfall and temperatures during crop growth than by the soil moisture
at the time of sowing.
At the beginning of November 2019, the forecast indicated a generally below average outlook for
the 2019–20 sorghum crop (Map 5).
8Australian crop report December 2019 ABARES
Map 5 Probability of exceeding long-term median grain sorghum yield
Note: Probability of exceeding the long-term sorghum yield, given SOI phase was "consistently negative” " at the end of
October.
Source: Queensland Alliance for Agriculture and Food Innovation
The water available for crop growth can come from water stored in the soil during the fallow or
from in-crop rain. On average, the total water requirement to achieve the national 5-year
average sorghum yield of 2.85 tonnes/ha is 290 millimetres, based on a conversion rate of 15kg
of grain sorghum per millimetre of water. See recent analysis published by the Grains Research
& Development Corporation (GRDC) for more detail.
The QAAFI estimates of the probability of exceeding the long-term grain sorghum yield is based
on rainfall information up to the end of October and does not incorporate significant rainfall
deficiencies in November. As such ABARES has undertaken an analysis to determine the chance
of achieving 290 millimetres of water availability (Map 6). This analysis is based on available
soil moisture as at 25 November 2019 and estimates of rainfall totals for December to February
derived from the Bureau of Meteorology’s latest rainfall outlook. The probability of achieving
9Australian crop report December 2019 ABARES
290 millimetres of water availability provides a good indication of the prospects for grain
sorghum production.
At the end of November 2019, the chance of achieving 290 millimetres of water availability was
low in summer cropping regions. The highest chance (25%) is in the northern and eastern part
of the Queensland summer cropping region and some eastern parts of the New South Wales
summer cropping region. In other summer cropping regions in northern New South Wales and
Queensland, the chance of achieving 290 millimetres of water availability are lower than 25%.
Map 6 Chance of achieving 290 millimetres of water availability
Note: Chance of achieving 290 millimetres of water availability is displayed for sorghum producing shires only.
Source: ABARES & Bureau of Meteorology
It is important to note that the crop yield associated with a specific level of water availability
varies across regions with variations in soil characteristics (the QAFFI analysis presented in
Map 5 does account for regional variations in soil characteristics). As a result the implications of
290 millimetres of water being available may be quite different across regions. Additionally, in
some seasons the responsiveness of crop growth to water availability will be better than average
(around 28kg/mm) and in other years it will be worse (around 6kg/mm) as responsiveness
depends on factors such as temperature, humidity and the timing of rainfall.
10Australian crop report December 2019 ABARES
Crop conditions and production
forecasts, by state
New South Wales
Less than half of average rainfall fell in New South Wales from January to October 2019, the
lowest for the first 10 months of the year since 1940. While spring rainfall was forecast at the
beginning of spring to be below average, conditions that eventuated in many cropping regions
were worse than expected.
The prolonged period of well below average rainfall had a significant impact on crop production
in New South Wales.
Winter crop production in New South Wales is forecast to be 3.6 million tonnes in 2019–20,
around 65% below the 10-year average to 2018–19. Many crops intended for grain and oilseed
production were cut for hay during spring in response to high fodder prices and uncertainty
about enough spring rainfall falling to keep crops viable.
Wheat production is forecast to be 2.3 million tonnes in 2019–20, 67% below the 10-year
average to 2018–19. The average wheat yield is forecast to be 1.2 tonnes per hectare, which is
42% below the 10-year average to 2018–19. Crops across New South Wales achieved below
average yields and most crops that made it through to harvest in central and northern New
South Wales achieved well below average yields. Area planted to wheat is estimated to have
increased from the very low area planted in 2018–19 but was still 41% below the 10-year
average to 2018–19.
Barley production is forecast to be 725,000 tonnes in 2019–20, 57% below the 10-year average
to 2018–19. The average barley yield is forecast to be 1.25 tonnes per hectare, which is 38%
below the 10-year average to 2018–19. Area planted to barley is estimated to be 580,000
hectares, 28% below the 10-year average to 2018–19.
Canola production is forecast to reach 225,000 tonnes in 2019–20. The average yield is forecast
to be well below average at 0.9 tonnes per hectare. Area planted to canola is estimated to be
250,000 hectares with the majority of this in southern New South Wales. A significant number of
canola crops were cut for hay in early spring as the risk of crops failing before harvest rose.
Table 4 Winter crop forecasts, New South Wales, 2019−20
Crop Area Yield Production Area change Prod. change
'000 ha t/ha kt % %
Wheat 1,900 1.20 2,280 6 27
Barley 580 1.25 725 –3 15
Canola 250 0.90 225 32 48
Note: Yields are based on area planted. Area based on planted crop that is harvested, fed off or failed. Percent change are
relative to last year.
Sources: ABARES
Summer crop prospects in northern New South Wales are currently extremely poor. Soil
moisture levels are extremely low following the prolonged period of well below average rainfall
11Australian crop report December 2019 ABARES
and the outlook for seasonal conditions during summer is unfavourable. Additionally, supplies of
irrigation water are low.
According to the latest three-month rainfall outlook (December to February), issued by the
Bureau of Meteorology on 21 November 2019, summer rainfall is likely to be below average in
summer cropping regions of New South Wales and daytime temperatures very likely to be above
average.
Area planted to summer crops in New South Wales is forecast to be the lowest on record at
166,000 hectares. It would take significant summer rainfall for the summer crop outlook in New
South Wales to improve. However, this not likely given the latest three-month season outlook
issued by the Bureau of Meteorology.
Area planted to grain sorghum is forecast to be very much below the 10-year average at
40,000 hectares. Production, at 76,000 tonnes, is also expected to be well below average. The
large area of fallow land available because of the poor winter cropping season in northern New
South Wales and high grain sorghum prices would provide a strong incentive to plant grain
sorghum if there is significant rainfall during the planting window. However, significant rainfall
over summer appears unlikely.
Area planted to cotton is forecast to fall by 77% to 52,000 hectares in 2019–20 because of the
low water levels in irrigation dams serving New South Wales cotton growing regions. Cotton
production is forecast to fall by 64% to 114,000 tonnes of cotton lint and around 162,000 tonnes
of cottonseed. The average yield is forecast to increase by 55% because most cotton planted is
expected to be irrigated.
Area planted to rice is forecast to remain largely unchanged at 3,400 hectares, in response to
high water prices and low availability of irrigation water.
Table 5 Summer crop forecasts, New South Wales, 2019−20
Crop Area Yield Production Area change Prod. change
'000 ha t/ha Kt % %
Grain sorghum 40 1.90 76 –64 –72
Cotton lint 52 2.20 114 –77 –64
Cottonseed 52 3.11 162 –77 –64
Rice 3 13.50 46 –15 –15
Note: Yields are based on area planted, except cotton which is based on area harvested. Area based on planted crop that is
harvested, fed off or failed. Percent change are relative to last year.
Sources: ABARES
Queensland
Harvesting of winter crops in Queensland is now largely complete. Winter crop production in
2019–20 is estimated to have fallen by 5% to around 678,000 tonnes, the third consecutive year
of falling winter crop production in Queensland since record high production was achieved in
2016-17. If the forecast for 2019–20 is realised, this will be the lowest production since 1994–
95, when 312,000 tonnes was produced. Around 10% of area planted to wheat and barley for
grain production was cut for hay in response to high fodder prices and unfavourable seasonal
conditions increasing the risk of grain production.
12Australian crop report December 2019 ABARES
Seasonal conditions in southern Queensland and parts of central Queensland in September and
October were generally poor. Rainfall was well below average in most cropping regions outside
of small parts of the south east and central Queensland.
Wheat production is estimated to have increased by 5% in 2019–20 to 420,000 tonnes. Area
planted to wheat is estimated to have remained at 400,000 hectares. The average yield is
estimated to have risen by 5% to 1.05 tonnes per hectare. The average yield increased because
almost all crops harvested were grown in central Queensland, which received well above
average rainfall in July 2019.
Barley production is estimated to have fallen by 37% in 2019–20 to 60,000 tonnes. Area planted
to barley is estimated to have fallen by 36% to 45,000 hectares due to lower than average
rainfall in southern Queensland, where most barley is grown in the state.
Production of chickpeas is estimated to have declined by 11% in 2019–20 to 170,000 tonnes.
Area planted to chickpeas is estimated to have fallen by 15% to 170,000 hectares in response to
lower prices and weaker import demand from India. Yields are estimated to have increased
because almost all chickpeas are grown in central Queensland where seasonal conditions
improved from last season.
Table 6 Winter crop forecasts, Queensland, 2019−20
Crop Area Yield Production Area change Prod. change
'000 ha t/ha kt % %
Wheat 400 1.05 420 0 5
Barley 45 1.33 60 –36 –37
Chickpeas 170 1.00 170 –15 –11
Note: Yields are based on area planted. Area based on planted crop that is harvested, fed off or failed. Percent change are
relative to last year.
Sources: ABARES
Prospects for summer crop production in Queensland are poor because of the long period of
below average rainfall in most cropping regions and an unfavourable outlook for seasonal
conditions over summer. Average winter rainfall improved soil moisture levels north of Emerald
to facilitate some planting of summer crops. But even in this region, above average rainfall is
needed between now and February 2020 to support further summer crop planting, which is
unlikely given the latest three-month season outlook issued by the Bureau of Meteorology.
Additionally, low water levels in dams servicing cotton producers will constrain planting of
irrigated cotton. As a result, for most summer crops, area planted is forecast to fall from 2018–
19 levels.
Area planted to summer crops in Queensland is forecast to fall by 42% in 2019–20 to around
356,000 hectares. This is due to a significant forecast fall in area planted to irrigated cotton and
grain sorghum. Summer crop production is forecast to more than halve to 684,000 tonnes.
Area planted to grain sorghum is forecast to fall by 48% in 2019–20 to 200,000 hectares, the
lowest on record. Grain sorghum production is forecast to fall by 68% in 2019–20 to
320,000 tonnes largely because of the forecast fall in planted area. Additionally, the average
yield is forecast to fall by 38% to 1.6 tonnes per hectare because of the unfavourable seasonal
conditions expected over summer.
13Australian crop report December 2019 ABARES
Area planted to cotton is forecast to fall by 74% to 30,000 hectares in 2019–20, which is
expected to be mainly comprised of irrigated cotton. Cotton production is forecast to decline by
61% to 63,000 tonnes of cotton lint and around 89,000 tonnes of cottonseed in 2019–20. The
average yield is forecast to increase by 50% as a result of the expected dominance of irrigated
cotton in planted area.
Area planted to rice is forecast to remain largely unchanged at 1,200 hectares due to milling
capacity constraints. Production is forecast to be around 8,000 tonnes and with the low level of
rice production in New South Wales, Queensland production is expected to comprise around
15% of national production.
Table 7 Summer crop forecasts, Queensland, 2019−20
Crop Area Yield Production Area change Prod. Change
'000 ha t/ha kt % %
Grain sorghum 200 1.60 320 –48 –68
Cotton lint 30 2.10 63 –74 –61
Cottonseed 30 2.97 89 –74 –61
Note: Yields are based on area planted, except cotton which is based on area harvested. Area based on planted crop that is
harvested, fed off or failed. Percent change are relative to last year.
Sources: ABARES
Victoria
Seasonal conditions were mixed in Victoria during spring after winter conditions were generally
favourable. Timely rainfall and average daytime temperatures in September supported grain
formation in most parts of the southern Mallee, the Wimmera, the North Central and the
Western districts. Rainfall was below average and daytime temperatures above average in
October for these cropping regions. However, average night time temperatures and sufficient
levels of soil moisture supported prospects for average to above average yields. In contrast, soil
moisture levels were low at the beginning of spring in the northern Mallee and the north eastern
parts of the Victorian cropping region, and yield prospects were adversely affected by below
average rainfall and above average temperatures during spring.
High fodder prices and frosts in September caused some cereal crops intended for grain
production to be cut for hay, especially in the northern Mallee and the north eastern parts of the
Victorian cropping region. Rainfall and cool conditions in early November have delayed
harvesting in most cropping regions, and has the potential to boost yields in late finishing
districts.
According to the latest rainfall outlook issued by the Bureau of Meteorology on
21 November 2019, December rainfall is likely to be below average in Victoria.
Winter crop production in Victoria is forecast to increase by 92% in 2019–20 from low levels in
2018–19 to around 7.2 million tonnes, which is 12% above the 10-year average to 2018–19.
Planted area is estimated to have increased by 6%, after fewer crops intended for grains and
oilseeds production were cut for hay compared to last year.
Wheat production is forecast to increase by 85% in 2019–20 to 3.6 million tonnes reflecting an
expected significant increase in the average yield. Yield prospects are forecast to be average to
above average in most cropping regions outside of the northern Mallee and the north eastern
parts of the Victorian cropping region.
14Australian crop report December 2019 ABARES
Barley production is forecast to increase by 109% in 2019–20 to around 2.3 million tonnes,
which is 24% above the 10-year average to 2018–19. The forecast increase is largely driven by
an expected 101% increase in the average yield. There has been a high level of screenings in
early deliveries of barley from regions adversely affected by a finish with below average rainfall.
Canola production is forecast to increase by 107% in 2019–20 to around 620,000 tonnes after
many canola crops intended for oilseed production were cut for hay last year. Planted area is
forecast to increase by 28% and the average yield is forecast to increase by 61%.
Table 8 Winter crop forecasts, Victoria, 2019–20
Crop Area Yield Production Area change Prod. Change
'000 ha t/ha kt % %
Wheat 1,450 2.48 3,600 4 85
Barley 800 2.88 2,300 4 109
Canola 385 1.61 620 28 107
Note: Yields are based on area planted. Area based on planted crop that is harvested, fed off or failed. Percent change are
relative to last year.
Sources: ABARES
South Australia
Seasonal conditions were mixed during spring in South Australia. Crop prospects in most
northern cropping regions were adversely affected by below average rainfall and above average
temperatures during spring. However, while spring rainfall was below average in parts of the
upper Eyre Peninsula, the southern Mallee and the mid-North, it was timely, and benefitted yield
prospects in these regions. Average rainfall in September and the timeliness of rainfall in
October supported average yield prospects in most southern cropping regions including lower
Eyre Peninsula, lower Yorke Peninsula and the South East.
Fires in Yorke Peninsula in late November will delay harvest and reduce production in the
region. However, the affected region is a small proportion of total planted area in South Australia
and the fires will not reduce state level production significantly.
According to the latest three-month seasonal outlook (December to February), issued by the
Bureau of Meteorology on 21 November 2019, December rainfall is likely to be below average in
South Australia.
Winter crop production in South Australia is forecast to increase by 19% in 2019–20 to around
6.3 million tonnes. However, production in 2018–19 was very low and forecast production in
2019–20 is still 15% below the 10-year average to 2018–19. The 2019–20 forecast reflects an
estimated 4% increase in planted area to around 3.5 million hectares and expected yield
improvements in key growing regions. High fodder prices and frosts in September resulted in
some crops intended for grain production being cut for hay, especially in parts of the northern
Mallee and the upper North.
Wheat production is forecast to increase by 19% in 2019–20 to around 3.5 million tonnes,
reflecting a 13% increase in the average yield and an estimated 5% increase in planted area.
Barley production is forecast to increase by 21% to just under 1.9 million tonnes. The average
yield is forecast to increase by 17% and planted area is estimated to have increased by 3%.
15Australian crop report December 2019 ABARES
Canola production is forecast to increase by 15% to around 300,000 tonnes, which largely
reflects an estimated 10% increase in planted area. Canola in early deliveries from regions
adversely affected by below average spring rainfall has had below average oil content.
Table 9 Winter crop forecasts, South Australia, 2019–20
Crop Area Yield Production Area change Prod. change
'000 ha t/ha kt % %
Wheat 1,950 1.79 3,500 5 19
Barley 845 2.19 1,850 3 21
Canola 220 1.36 300 10 15
Note: Yields are based on area planted. Area based on planted crop that is harvested, fed off or failed. Percent change are
relative to last year.
Sources: ABARES
Western Australia
Winter crop prospects in Western Australia appeared reasonable at the beginning of spring but
deteriorated quickly. After below average winter rainfall and a late break to the season, crops
needed average September rainfall to reach average yields, which was the initial rainfall outlook
issued by the Bureau of Meteorology at the end of winter. However the initial outlook was
revised and below average spring rainfall fell in most cropping regions, accompanied by well
above average temperatures. Heat stress and low moisture adversely affected most winter crops
in the state, especially in northern cropping regions such as Geraldton. Frost events during
spring in the southern cropping areas reduced yield prospects for some wheat, barley and
canola crops.
Winter crop production is forecast to fall by 35% in 2019–20 to 11.6 million tonnes. This
reflects a 4% decrease in planted area to around 7.7 million hectares and expected falls in yields
in all growing regions. Unfavourable seasonal conditions in the Geraldton region are pushing
regional production towards its lowest total in a decade. Frost events in Albany and Esperance
resulted in some wheat and canola crops being cut for hay.
Wheat production is forecast to fall by 41% in 2019–20 to around 6.0 million tonnes, reflecting
a forecast 37% fall in the average yield. Area planted to wheat is estimated to have fallen by 6%
to 4.4 million hectares.
Barley production is forecast to fall by 25% in 2019–20 to 3.7 million tonnes, largely reflecting a
forecast 34% fall in the average yield from the high yield of last year. Area planted to barley is
estimated to have risen by 14% to around 1.7 million hectares. Barley yields across the state
held up a lot better than wheat over spring due to a lot of barley being grown in the southern
cropping regions, where seasonal conditions were slightly more favourable.
Canola production is forecast to fall by 35% in 2019–20 to 950,000 tonnes. The late break to the
season and higher than average temperatures caused yields to be below average. Additionally,
planted area is estimated to have fallen by 22% to 940,000 hectares.
16Australian crop report December 2019 ABARES
Table 10 Winter crop forecasts, Western Australia, 2019–20
Crop Area Yield Production Area change Prod. change
'000 ha t/ha kt % %
Wheat 4,400 1.36 6,000 –6 –41
Barley 1,650 2.24 3,700 14 –25
Canola 940 1.01 950 –22 –35
Lupins 350 1.00 350 –8 –42
Note: Yields are based on area planted. Area based on planted crop that is harvested, fed off or failed. Percent change are
relative to last year.
Sources: ABARES
17Australian crop report December 2019 ABARES
Statistical tables
Table 11 Winter crop production and area, Australia, 2017–18 to 2019–20
Crop Area Production
2017–18 2018–19 s 2019–20 f 2017–18 2018–19 s 2019–20 f
'000 ha '000 ha '000 ha kt kt kt
Wheat 10919 10159 10110 20941 17298 15852
Barley 4124 3719 3930 9254 8310 8672
Canola 3171 1893 1798 3893 2180 2099
Chickpeas 1075 303 268 998 282 289
Faba beans 313 178 196 416 217 322
Field peas 291 179 236 317 152 257
Lentils 418 303 240 543 323 338
Lupins 612 500 520 714 693 532
Oats 874 680 673 1227 888 935
Triticale 55 66 72 87 89 105
f ABARES forecast. s ABARES estimate.
Notes: Crop year refers to crops planted during the 12 months to 31 March. Slight discrepancies may appear between
tables as a result of including the Northern Territory and Australian Capital Territory in Australian totals. Area based on
planted crop that is harvested, fed off or failed.
Sources: ABARES; ABS; Pulse Australia
Table 12 Summer crop production and area, Australia, 2017–18 to 2019–20
Crop Area Production
2017–18 2018–19 s 2019–20 f 2017–18 2018–19 s 2019–20 f
'000 ha '000 ha '000 ha kt kt kt
Grain sorghum 462 496 241 1255 1278 398
Cottonseed a 526 343 82 1497 686 251
Cotton lint a 526 343 82 1058 485 177
Rice 61 5 5 635 61 54
Corn (maize) 53 55 52 387 392 361
Soybeans 32 26 25 29 42 41
Sunflower 14 19 19 15 23 24
a Cotton area is estimated harvested area. f ABARES forecast. s ABARES estimate.
Notes: Crop year refers to crops planted during the 12 months to 31 March. Slight discrepancies may appear between
tables as a result of including the Northern Territory and Australian Capital Territory in Australian totals. Area based on
planted crop that is harvested, fed off or failed.
Sources: ABARES; ABS; Cotton Australia.
18Table 13 Production, major crops, Australian states, 2017–18 to 2019–20
Winter crops New South Wales Victoria Queensland South Australia Western Australia Tasmania
Area Prod. Area Prod. Area Prod. Area Prod. Area Prod. Area Prod.
'000 ha kt '000 ha kt '000 ha kt '000 ha kt '000 ha kt '000 ha kt
Wheat
Australian crop report September 2019
2019–20 f 1,900 2,280 1,450 3,600 400 420 1,950 3,500 4,400 6,000 10 52
2018–19 s 1,800 1,800 1,400 1,950 400 400 1,850 2,950 4,700 10,150 9 48
2017–18 2,793 4,703 1,447 3,682 639 765 1,976 4,052 4,057 7,699 7 40
Five-year average to 2018–19 2,788 5,975 1,427 2,949 581 994 1,964 4,283 4,618 8,966 9 48
Barley
2019–20 f 580 725 800 2,300 45 60 845 1,850 1,650 3,700 10 37
2018–19 s 600 630 770 1,100 70 95 820 1,535 1,450 4,916 9 34
2017–18 763 1,305 844 2,110 105 188 876 1,861 1,531 3,775 5 16
19
Five-year average to 2018–19 854 1,833 864 1,755 117 269 857 2,012 1,473 3,850 6 23
Canola
2019–20 f 250 225 385 620 2 1 220 300 940 950 1 3
2018–19 s 190 152 300 300 1 1 200 260 1,200 1,464 2 3
2017–18 860 893 542 938 1 0 237 335 1,531 1,724 1 4
Five-year average to 2018–19 621 849 386 543 1 1 224 304 1,314 1,641 1 3
ABARES
Oats
2019–20 f 190 171 100 175 35 18 65 95 280 470 3 7
2018–19 s 200 140 130 140 39 21 48 80 260 500 3 7
2017–18 366 229 97 188 45 12 57 94 306 697 3 6
Five-year average to 2018–19 307 320 133 237 47 26 63 109 300 678 3 6
continued …Table 13 Production, major crops, Australian states, 2017–18 to 2019–20 (continued)
Summer crops New South Wales Victoria Queensland South Australia Western Australia Tasmania
Area Prod. Area Prod. Area Prod. Area Prod. Area Prod. Area Prod.
'000 ha kt '000 ha kt '000 ha kt '000 ha kt '000 ha kt '000 ha kt
Grain sorghum
Australian crop report September 2019
2019–20 f 40 76 0 0 200 320 0 0 1 2 0 0
2018–19 s 110 275 0 0 385 1,001 0 0 1 2 0 0
2017–18 108 279 0 0 353 974 0 0 1 1 0 0
Five-year average to 2018–19 135 426 0 1 380 1,075 0 0 1 3 0 0
Cottonseed a
2019–20 f 52 162 0 0 30 89 0 0 0 0 0 0
2018–19 s 227 454 0 0 117 231 0 0 0 0 0 0
2017–18 351 1,044 0 0 175 453 0 0 0 0 0 0
20
Five-year average to 2018–19 247 669 0 0 132 347 0 0 0 0 0 0
Rice
2019–20 f 3 46 0 0 1 8 0 0 0 0 0 0
2018–19 s 4 54 0 0 1 7 0 0 0 0 0 0
2017–18 60 628 0 0 1 7 0 0 0 0 0 0
Five-year average to 2018–19 48 488 0 1 1 5 0 0 0 0 0 0
ABARES
a Cotton area is estimated harvested area. f ABARES forecast. s ABARES estimate.
Note: Zero is used to denote nil or less than 500 tonnes or 500 hectares. Area based on planted crop that is harvested, fed off or failed.
Sources: ABARES; ABSTable 14 Production, other crops, Australian states, 2017–18 to 2019–20
Winter crops New South Wales Victoria Queensland South Australia Western Australia Tasmania
Area Prod. Area Prod. Area Prod. Area Prod. Area Prod. Area Prod.
'000 ha kt '000 ha kt '000 ha kt '000 ha kt '000 ha kt '000 ha kt
Chickpeas
Australian crop report September 2019
2019–20 f 25 20 50 75 170 170 15 17 8 7 0 0
2018–19 s 50 35 20 20 200 190 25 25 8 12 0 0
2017–18 450 407 77 78 507 467 34 38 7 8 0 0
Five-year average to 2018–19 317 401 31 36 335 476 22 23 5 7 0 0
Field peas
2019–20 f 41 34 55 60 0 0 105 125 35 38 0 0
2018–19 s 39 29 50 35 0 0 70 50 20 38 0 0
2017–18 75 46 84 91 0 0 102 137 31 42 0 0
21
Five-year average to 2018–19 53 60 58 62 0 0 99 114 26 39 0 0
Lentils
2019–20 f 6 5 110 140 0 0 110 175 14 18 0 0
2018–19 s 7 5 125 105 0 0 160 200 11 13 0 0
2017–18 2 1 210 261 0 0 198 274 8 6 0 0
Five-year average to 2018–19 3 4 128 137 0 0 147 249 4 4 0 0
ABARES
Lupins
2019–20 f 91 90 34 37 0 0 45 55 350 350 0 0
2018–19 s 50 38 30 20 0 0 40 35 380 600 0 1
2017–18 95 46 49 52 0 0 66 82 402 532 0 1
Five-year average to 2018–19 69 65 38 38 0 0 61 69 352 555 0 0
continued …Table 14 Production, other crops, Australian states, 2017–18 to 2019–20 (continued)
Summer crops New South Wales Victoria Queensland South Australia Western Australia Tasmania
Area Prod. Area Prod. Area Prod. Area Prod. Area Prod. Area Prod.
'000 ha kt '000 ha kt '000 ha kt '000 ha kt '000 ha kt '000 ha kt
Corn (maize)
Australian crop report September 2019
2019–20 f 15 135 5 50 30 159 0 0 2 13 0 4
2018–19 s 18 162 5 55 30 159 0 0 2 12 0 4
2017–18 20 190 5 60 26 115 0 0 2 18 0 4
Five-year average to 2018–19 20 194 6 61 30 153 0 0 1 12 0 2
Soybeans
2019–20 f 15 25 1 1 9 15 0 0 0 0 0 0
2018–19 s 16 27 1 1 9 14 0 0 0 0 0 0
2017–18 24 17 1 1 7 10 0 0 0 0 0 0
22
Five-year average to 2018–19 16 23 1 1 7 10 0 0 0 0 0 0
Sunflower
2019–20 f 10 14 0 0 9 9 0 0 1 0 0 0
2018–19 s 10 14 0 0 8 9 0 0 0 0 0 0
2017–18 10 9 0 0 4 5 0 0 0 2 0 0
Five-year average to 2018–19 10 12 0 0 7 6 0 0 2 3 0 0
f ABARES forecast. s ABARES estimate.
ABARES
Note: Zero is used to denote nil or less than 500 tonnes or 500 hectares. Area based on planted crop that is harvested, fed off or failed.
Sources: ABARES; ABS; Pulse AustraliaAustralian crop report December 2019 ABARES
Table 15 Supply and disposal of wheat, canola and pulses, Australia, 2013–14 to 2018–19
Crop 2013–14 2014–15 2015–16 2016–17 2017–18 2018–19 s
kt kt kt kt kt kt
Wheat
Production 25303 23743 22275 31819 20941 17298
Apparent domestic use 6785 7154 7233 7805 8685 8920
– seed 619 564 610 612 508 506
– other a 6165 6590 6623 7193 8177 8414
Exports b 18612 16587 16116 22636 13820 8986
Imports b 20 22 25 25 28 327
Canola
Production 3832 3540 2775 4313 3893 2180
Apparent domestic use a 969 915 1088 972 900 980
Exports 2863 2626 1857 3458 2489 1519
Pulses
Production
– lupins 626 549 652 1031 714 693
– field peas 342 290 205 415 317 152
– chickpeas 629 555 875 2004 998 282
Apparent domestic use a
– lupins 286 306 398 637 258 485
– field peas 175 124 72 148 189 72
– chickpeas 0 1 1 1 1 0
Exports
– lupins 340 243 254 395 456 208
– field peas 169 168 134 268 130 82
– chickpeas 629 663 1145 2293 724 355
a Calculated as a residual: production plus imports less exports less any observed or assumed change in stocks and, for
wheat only, less seed use. b Includes grain and grain equivalent of wheat flour. s ABARES estimate.
Notes: Production, use, trade and stock data are on a marketing year basis: October–September for wheat; November–
October for canola and pulses. Export data on a marketing year basis are not comparable with financial year export figures
published elsewhere. Zero is used to denote nil or less than 500 tonnes. Due to a change in scope by the ABS of its
agricultural data collections, crop production is shown for establishments with an estimated value of agricultural operations
(EVAO) of $5,000 or more until 2014–15, and an EVAO of $40,000 or more from 2015–16.
Sources: ABARES; ABS; Pulse Australia
23Australian crop report December 2019 ABARES
Table 16 Supply and disposal of coarse grains, Australia, 2013–14 to 2018–19
Crop 2013–14 2014–15 2015–16 2016–17 2017–18 2018–19 s
kt kt kt kt kt kt
Barley
Production 9,174 8,646 8,992 13,506 9,254 8,310
Apparent domestic use 3,187 3,243 3,271 3,314 4,282 3,371
– seed 184 185 180 169 167 177
– other a 3,003 3,058 3,091 3,145 4,115 3,194
Export 6,957 5,932 6,342 9,873 6,496 5,096
– feed barley 3,944 3,070 4,351 6,364 3,641 1,912
– malting barley 2,273 2,149 1,394 2,826 2,084 2,348
– malt (grain equivalent) 740 713 596 683 771 835
Oats
Production 1,255 1,198 1,300 2,266 1,227 888
Apparent domestic use 1,001 960 1,074 1,708 1,075 554
– seed 41 39 49 42 33 32
– other a 960 920 1,024 1,666 1,042 521
Export 253 238 226 558 152 334
Triticale
Production 126 143 127 150 87 89
Apparent domestic use 126 143 127 150 87 89
– seed 4 4 3 3 3 4
– other a 122 139 124 147 84 86
Export 0 0 1 0 0 0
Grain sorghum
Production 1,282 2,210 1,791 994 1,255 1,278
Apparent domestic use b 1,083 885 572 878 717 808
– seed 3 4 3 2 3 3
– other a 1,080 881 569 875 714 805
Export b 1,146 397 1,638 913 277 441
Corn (maize)
Production 390 495 400 436 387 392
Apparent domestic use b 250 422 343 371 329 293
– seed 1 1 1 1 1 1
– other a 249 421 342 370 328 292
Export b 106 60 64 63 68 73
a Calculated as a residual: production plus imports less exports less any observed or assumed change in stocks less seed
use. b For summer crops, export and apparent domestic use volumes are shown in year of actual export and consumption,
which is typically in the year following production. Export data are on a marketing year basis and are not comparable with
financial year export figures published elsewhere. s ABARES estimate.
Notes: Production, use and export data are on a marketing year basis: November—October for barley, oats and triticale;
March—February for grain sorghum and corn (maize). Zero is used to denote nil or less than 500 tonnes. Due to a change in
scope by the ABS of its agricultural data collections, crop production is shown for establishments with an estimated value of
agricultural operations (EVAO) of $5,000 or more until 2014–15, and an EVAO of $40,000 or more from 2015–16.
24Australian crop report December 2019 ABARES
Sources: ABARES; ABS; UN Commodity Trade Statistics Database (UN Comtrade)
Table 17 Grain, oilseed and pulse prices, first quarter 2018 to third quarter 2019
Crop 2018 2018 2018 2018 2019 2019 2019
Q1 Q2 Q3 Q4 Q1 Q2 Q3
A$/t A$/t A$/t A$/t A$/t A$/t A$/t
Wheat
Domestic: feed, del. Sydney 266 334 406 445 428 386 365
International: US no. 2 hard red winter, fob Gulf a 303 322 332 331 327 311 303
Barley
Domestic: 2 row feed, del. Sydney 274 324 389 428 381 368 363
Export: feed b 269 299 336 353 345 344 365
Export: malting b 283 304 346 365 371 424 324
International: feed, fob Rouen a 259 277 320 330 300 273 256
Grain sorghum
Domestic: feed, del. Sydney 320 366 388 410 373 367 335
Export b 380 333 362 584 401 440 420
Oats
Domestic: feed, del. Sydney 180 275 351 390 390 391 390
International: CME oats nearby contract 225 216 233 275 269 288 273
Corn (maize)
Domestic: feed, del. Sydney 387 400 428 447 445 445 446
International: US no. 2 yellow corn, fob Gulf a 210 230 217 228 237 250 249
Oilseeds
Domestic: canola, del. Melbourne 504 525 567 629 605 562 569
International: Europe rapeseed, cif Hamburg 542 544 588 596 588 590 615
International: US no. 2 soybeans, fob Gulf a 496 511 444 462 490 483 498
Pulses
Domestic: lupins, del. Kwinana 292 323 330 363 374 388 396
Domestic: chickpeas, del. Melbourne 598 645 736 789 802 694 646
Domestic: field peas, del. Melbourne 305 378 429 516 620 542 505
Export: chickpeas b 821 737 764 835 896 833 750
Export: field peas b 400 425 494 546 683 689 658
a Average of daily offer prices made in US dollars and converted to Australian dollars using quarterly average of daily
exchange rates. b Export unit values reflect the average price received for grain exported over the quarter, not current
market prices. These prices are the average unit value (free on board) of Australian exports recorded by the Australian
Bureau of Statistics. A long lag time can exist between when exporters negotiate prices and when the product is exported.
Note: Q1 refers to the period January–March; Q2 refers to April–June; Q3 refers to July–September; Q4 refers to October–
December. Prices used in these calculations exclude GST.
Sources: ABARES; ABS; CME Group; Farm Weekly; International Grains Council; The Land; The Weekly Times;
US Department of Agriculture
25You can also read