Australian Housing - End of the Boom? - By Jordan Eliseo Chief Economist March 21st 2018 - ABC Bullion
←
→
Page content transcription
If your browser does not render page correctly, please read the page content below

Australian Housing
- End of the Boom?
          By Jordan Eliseo
          Chief Economist
               March 21st 2018
INTRODUCTION
Despite the stronger than expected property price data we’ve seen                   The fact that year to date, house prices are only down 0.8% at
this week, Australian property prices look to have peaked in late 2017,             an aggregate level across our five mainland state capitals (based
with the average price of a residential dwelling sitting at AUD $686,700,           on CoreLogic data to 12th March 2018), lends credence to their
according to data released by the Australian Bureau of Statistics.                  argument that there is no need for wide spread panic at this point.

Apart from Hobart, and some regional areas, property price weakness                 Be that as it may, even the most optimistic of forecasters would
is evident across the nation, led by Sydney, where prices fell by 2.40%             acknowledge the multiple headwinds facing the Australian residential
in the three months to end February 2018.                                           property market today, which include:

Property bulls will quite rightly point out that many financial commentators        • Near world-leading household debt to GDP, debt to income and
have for years been calling for a bust in Australian house prices, and that it        debt servicing ratios in Australia.
is still too early to say definitively that this current period of price weakness
does in fact represent the end of the largely uninterrupted bull market             • Record low wage growth and high underemployment.
in residential property prices that got under way in earnest around the             • A low, and declining savings rate of just 2.70% (note this includes
beginning of the 1990’s.                                                              compulsory superannuation of 9.5%), with surveys suggesting
                                                                                      nearly half of all Australians are not saving any money on a
                                                                                      month-to-month basis.

                                                                                    • Higher borrowing costs, with banks hitting borrowers with multiple
      Property bulls will quite rightly point out that many financial                 out of cycle rate hikes over the last couple of years, though they
      commentators have for years been calling for a bust in                          are now starting to reverse course and edge rates lower.
      Australian house prices, and that it is still too early to say
                                                                                    • Rental yields near record lows, especially for detached housing,
      definitively that this current period of price weakness does                    meaning investors are almost entirely reliant on capital gains to
      in fact represent the end of the largely uninterrupted bull                     justify their investments.
      market in residential property prices that got under way in                                                                                               1
      earnest around the beginning of the 1990’s.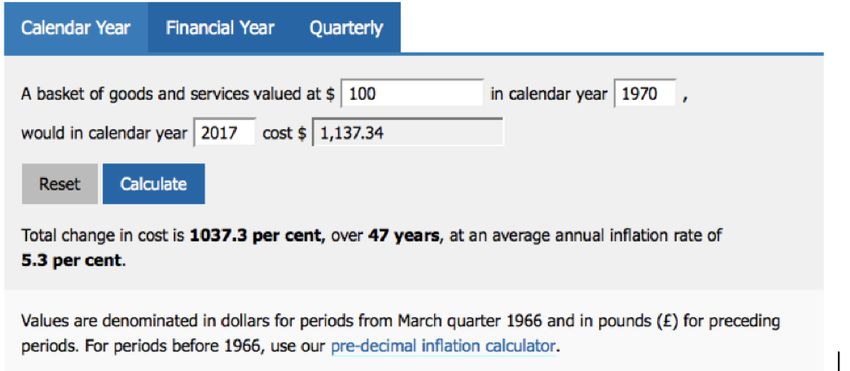
• The looming principal and interest (P+I) cliff, with tens of billions
  of dollars of ‘interest only’ loans set to convert to P+I loans in the
  coming years, which will add further pressure to already stretched
  household finances.

• Less accommodating regulators, with APRA acting to clamp down
  on investor lending, as well as putting caps on interest only lending
  (see point above), whilst the federal government has taken greater
  measures to clamp down on foreign investors.

• A significant uptick in residential property supply, which is
  particularly acute in East Coast apartment markets.
Overhanging all of this is the Royal Commission into our banks, the
potential end of the RBA’s rate cutting cycle, and most importantly,
the increasing likelihood of a change in government at the next
Federal election, which is set for the first half of 2019.

A Shorten led Labor government is promising to end negative gearing
tax concessions on established dwellings (though existing investors will
be grandfathered), as well as halving existing capital gains tax exemptions
for investors.

Little wonder given the above headwinds that housing related credit
growth, arguably the major factor pushing prices higher over the past
25 plus years, has slowed markedly, and that property prices themselves
have begun to head lower.

The question is how far they will fall, and how long the correction will take.
                                                                                 2
HOW FAR COULD PROPERTY FALL?
Before looking at how far property could fall in the event that we enter a Note that the gain you can see in the chart comes to an amazing
full blown housing correction in Australia, it pays first to look at how far 5,261% over this 45 year plus time period, or just shy of 9% per annum.
prices have risen over the long-run. No wonder we call it the great Australian dream.
The chart below, which begins at the start of the 1970s, plots the rise That’s the upside homeowners and property investors have benefited
in Australian housing values, which have increased from around AUD in the past, but what about the potential downside risk in the future?
$12,500 in 1970, to AUD $686,700 by the end of 2017.
According to a May 2009 study titled “The Aftermath of Financial
Crises”, carried out by renowned economists Carmen Reinhardt and
AUSTRALIAN RESIDENTIAL PROPERTY PRICES - 1970 TO 2017 Kenneth Rogoff, the average fall in residential real estate prices during
a ‘housing crash’, across the multiple countries they studied, was an
800000
eye-watering 35%.
700000
However, as per the chart on the next page, which comes from the
600000 Reinhart and Rogoff study, not all housing crashes are equal, with
500000
some relatively mild ones seen a decade age (in Austria and Hungary
for example) where prices fell by only 10%.
400000
300000
200000
100000 According to a May 2009 study titled “The Aftermath of
0
Financial Crises”, carried out by renowned economists
Carmen Reinhardt and Kenneth Rogoff, the average fall
1969 1975 1981 1987 1993 1999 2005 2011 2017
in residential real estate prices during a ‘housing crash’,
3
Source: Bank for International Settlements, Australian Bureau of Statistics across the multiple countries they studied, was an eye-
watering 35%.At the other end of the spectrum, Finnish property prices were INTERNATIONAL HOUSING CORRECTIONS
ravaged by the countries banking crisis and recession in the early
Austria 2008
1990s, whilst residential real estate in countries like Indonesia, the Hungary 2008
Philippines and Hong Kong all suffered falls of 50% or more in 1997, US 1929
UK 2007
as the Asian Financial crisis wreaked havoc across the region. Thailand Iceland 2007
and Malaysia were also affected, though the falls weren’t as severe. Malaysia 1997
Thailand 1997
Note that at the time Reinhardt and Rogoff wrote their paper, some of Korea 1997
Ireland 2007
the housing corrections they were analysing were still ongoing, with
Norway 1899
Austria, Hungary, the UK, Iceland, Ireland and the United States still Argentina 2001
reeling from the effects of the Global Financial Crisis (GFC). US 2007
Sweden 1991
Spain 1977
Historical average
Japan 1992
Norway 1987
Indonesia 1997
Finland 1991
Colombia 1998
Philippines 1997
Hong Kong 1997
-60 -50 -40 -30 -20 -10 0 0 5 10 15 20
Percent decline Duration in years
Ongoing
Source: Reinhardt and Rogoff, The Aftermath of Financial Crises
4WILL AUSTRALIA SUFFER AS BADLY?
Whilst the Reinhardt and Rogoff study gives us a useful guide as Of course not every city and region would suffer exactly the same
to how far housing can fall during a genuine property crash, every price decline in a nationwide property correction. Cities like Perth,
nation is different, and one could make a case that the Australian where house prices have already fallen over the past few years, might
experience will be either more, or less severe than the global average see more modest price declines from here. Sydney and Melbourne,
decline of 35%. the two primary destinations for foreign capital, may also hold up better,
though given both cities have seen property price growth of close to
No doubt the more alarmist of housing price forecasters in Australia 35% in the last three years alone, some would argue they are more
would argue that given the scale of our housing boom, and its duration, exposed as this cycle comes to an end.
a local housing bust, should it eventuate, will likely be at least as bad if
not worse than those we’ve seen in other countries.
We are not so sure.
Indeed given the fact that some of the more extreme falls we’ve seen
in historical property price crashes have occurred in emerging markets,
and given Australia’s (current) high immigration rate as well as our
popularity as a destination for foreign capital, we are of the view that Indeed given the fact that some of the more
a local property price crash, were it to occur, would likely be more extreme falls we’ve seen in historical property
benign than the historical average from other countries captured in price crashes have occurred in emerging markets,
the chart above. and given Australia’s (current) high immigration
Note this is not to appear cavalier about the risks we face Down rate as well as our popularity as a destination for
Under, for a crash of even 20% would still be devastating to the foreign capital, we are of the view that a local
Australian economy, wiping some AUD $1.4 Trillion off the value of property price crash, were it to occur, would likely
the nations housing stock, equivalent to roughly 75% of one year of be more benign than the historical average from
5
our gross domestic product. other countries captured in the chart above.A fall of such magnitude couldn’t help but spill over into the broader In terms of the time that housing markets take to fully correct,
economy. Debt laden Australian households would bunker down, Reinhart and Rogoff’s study estimates that housing market crashes
placing further strain on an already struggling retail sector. Combine have on average taken around six years to fully play out, which you
this with a finance and building sector that would likely go into can also see in the chart on page 4.
hibernation, and a fall in housing prices would have profoundly
negative consequences for unemployment and already moribund They are protracted affairs that take nearly twice as long to play out
wage growth. as equity market crashes, though as per the magnitude of the
corrections in terms of price declines, there is a large difference
Budget deficits would skyrocket, threatening our AAA rating in across nations in regards to the time period these housing
due course, with data from Reinhardt suggesting that countries corrections take to fully play out, with Japan being the standout.
that go through a housing crash also see an average increase in
fiscal deficits of 7% of GDP, measured from pre-crisis to its peak. Apply these findings to Australia, and we can estimate that if local
property prices did indeed peak in late 2017, then it may
As housing crashes and banking sector crises tend to go hand take until around 2024 before the Australian residential property
in hand, it is relatively safe to say that a property price crash would market heads meaningfully higher again.
decimate the local sharemarket, given the almost absurd financial
sector concentration of the ASX.
This in turn would drag down the performance of our +AUD $2.5 6
Trillion superannuation industry, which, based on the latest ASFA
data, has a circa 25% allocation to listed Australian equities.
Be in no doubt, an Australian property price crash, even if it’s Be in no doubt, an Australian property
relatively mild when compared to the experience in many other price crash, even if it’s relatively mild when
nations, would be devastating for the country. compared to the experience in many other
nations, would be devastating for the country.
6WHAT IF WE MEASURED HOUSING IN GOLD?
If Australian property prices were to fall 20% by 2024, then we
would expect to see the average residential dwelling trade hands
for around AUD $550,000 by the end of this corrective phase.
This would suggest that the easiest course of action for would be
owner occupiers and property investors in Australia is to simply sit
still on their hands, and build up their savings for the next few years,
earning some income along the way.
But with interest rates at record lows today, and set to remain that
way for some time, saving in cash is becoming an ever more
Source: RBA
untenable option in Australia.
Saving in cash will only become more painful if inflation in Australia
rises, as it may well do.
As a way of picturing this, whilst the latest CPI data showed official
inflation is currently rising at just 1.9% per annum, the long
term inflation average from the 1970s to today is closer to 5.3% per
annum, as the image on this page (from the RBA’s inflation calculator)
highlights.
Gold is also an easy asset to invest in, with products like the ABC
Given Australian dollar savings in a bank account are likely to remain Bullion Gold Saver allowing aspiring homeowners to build savings
unappealing for some time, Australians may be better off looking for from as little as AUD $50 per month, with their savings then
monetary alternatives to build their wealth in, and physical gold is the benefitting from the long-term appreciation in the gold price.
most obvious choice. 7Saving in physical gold has become more attractive to many types of The chart highlights that today, an Australian would need to own
Australian investors including SMSF trustees and managed funds over 416 ounces of physical gold in order to afford the average property
the past few years, as the precious metal has offered investors a number in this country. However, it hasn’t always been this way, and at
of benefits, which include; various points in time, you’ve needed to own either a lot less,
or a lot more gold in order to buy a house.
• Strong long-term returns, with gold prices rising by circa 8% per
annum in Australian dollar terms since the turn of the century RATIO OF AUSTRALIAN RESIDENTIAL HOUSING TO PHYSICAL GOLD
700
• An asset that is uncorrelated to financial markets, with gold the
best performing defensive asset in environments where the share
600
market falls fastest
• A simple hedge against a potential fall in the Australian dollar, which 500
HOUSING VERY EXPENSIVE
increases the price of gold in AUD.
400
Gold is also an easy asset to invest in, with products like the ABC
Bullion Gold Saver allowing aspiring homeowners to build savings 300
from as little as AUD $50 per month, with their savings then
benefitting from the long-term appreciation in the gold price. 200
8
And as per the chart on this page, which represents a long-term study GOLD VERY EXPENSIVE
100
of physical gold vs. Australian residential housing prices, whilst the value
of an Australian house priced in dollars may well fall by up to 20% in 1975 1981 1987 1993 1999 2005 2011 2017
0
the years ahead, the price of an Australian house when measured in
ounces of physical gold could plunge a lot further. 1969 1975 1981 1987 1993 1999 2005 2011 2017
Chart Source: Real Estate Institute of Australia, “Housing Prices in Australia” (Abelson and Chung), “Long Term Housing Prices
in Australia and Some Economic Perspectives (Stapledon), Bank for International Settlements, Bloomberg, RBA
8Over the long-run, the average ratio between Australian housing and However, given these ratios tend to overshoot in one direction and
gold has been 306, which is the red line you can see on the chart. then the other, it is unlikely that the ratio between housing and gold
will only drop to around 306, which is the long-run average.
Note that the black line and the grey line on the chart represent
points above and below which property is very expensive (black line) Instead, if history is any guide, what may well happen is that the ratio
or very cheap (grey line) relative to gold. Very expensive is defined continues to drop down to a point where gold is once again very
as 1.5x the long-term average whilst very cheap is defined as 0.5x expensive relative to housing, which could come about as the gold price
the long-term average. rises, and house prices fall simultaneously. Indeed the ratio would need
to decline from its current level of 416 all the way down to 153, which
As you can see, the peak in property relative to gold occurred in the is the grey line on the chart and the point at which we would define
early 2000s, when you needed nearly 600 ounces of gold to buy the gold as being very expensive.
average Australian property.
Compared to current levels, a decline of this magnitude would mean
At the other end of the spectrum, back in 1980 when gold was at its that housing prices, relative to gold, could fall by over 60%.
most valuable level relative to property, Australian’s would only have
needed to own 79 ounces of gold in order to afford the average house. If you are a highly leveraged property owner, a fall of that magnitude
would likely be disastrous. If you’re a physical gold owner, or if you’re
To put that in perspective, if you were to buy 79 ounces of gold right saving in gold so that you can invest in property or buy a family home
now, it would only cost you around AUD $135,000, which is not even in the future, it’s an amazing opportunity.
enough for a 20% deposit on the average Australian property today.
The message from the chart, and the observations above is clear.
At present, housing is expensive relative to gold, with the current
housing to gold ratio some 25% above the long-run average.
This alone suggests gold is likely to outperform housing in the
coming years.
9CONCLUSION
This article is not suggesting that Australians should sell their family Of the all the steps that Australians can take to protect their wealth
home or put all of their money into physical gold. As I stated at the should such an event take place, owning gold is likely the smartest
outset, there is no guarantee that property prices are going to fall and simplest.
meaningfully at this stage, with the correction in nationwide housing
values over the last few months incredibly benign so far. Whilst the sharemarket is one option, the ASX is almost certain to
struggle in an environment where house prices fall, both due to
Indeed, given the importance of housing to the Australian economy, weighting of our major banks in the index, as well as the fact that
and the wealth of our nation, I, for one, hope that the property a housing correction would almost certainly lead to a recession.
market doesn’t crash at all. Instead, it would be far better for the
nation as a whole if property prices spent the next few years Cash in the bank will also likely prove a suboptimal investment choice,
stagnating, or at the very least lagging wage growth and inflation, if for no other reason than the RBA will almost certainly respond
which have a long way to catch up. to a housing correction with even lower interest rates, meaning the
real value of your money will continue to deteriorate.
This echoes the sentiments of RBA governor Dr Phillip Lowe, who
in February 2018 stated that; “it would be a good outcome if we now Physical gold on the other hand will not only protect capital
experienced a run of years in which the rate of growth of housing in its traditional safe haven role, but its price is likely to rise quite
costs and debt did not outstrip growth in our incomes.” substantially in such an environment. This will mean the ratio
between Australian housing and gold could decline meaningfully
But hoping for best doesn’t mean we shouldn’t prepare for the worst, in the years ahead, helping make the great Australian dream that
and the reality is that the Australian property market has a number much more affordable again.
of imbalances, and there is no easy way out the position we find
ourselves in as a nation.
A meaningful property correction would not be a major surprise,
and if it were to occur, it would hit household wealth, and the
broader Australian economy quite dramatically. 10A Note on the Housing Chart and Housing Data
According to the latest Credit Suisse Global Wealth Report, “real assets” We have applied the moves in that index from the start of the 1970s
make up 60% of total gross assets for Australian households. Residential to present day residential property valuations. Based on an end 2017
property, currently valued at just under AUD $7 Trillion is by far the largest average dwelling value of $686,700 (data courtesy of the ABS), the BIS
of these “real assets”. series suggests that the average dwelling in Australia was worth just over
AUD $12,500 back in 1970.
Given this fact, and the importance of property to the Australian
economy, it is astounding that there is not one publically available and That number is very close to the median house price reported in various
widely accepted data source which tracks Australian housing valuations other studies into Australian housing valuations, including Abelson and
over the very long run, by which we mean 100 plus years. Chung; “Housing Prices in Australia”, and Stapledon; “Long Term Housing
Prices in Australia and Some Economic Perspectives”, which for example,
This is not to impugn the work of the industry bodies and businesses
stated that a house in Melbourne was worth $12,800 (Abelson/Chung)
that are involved in property, including the REIA, CoreLogic, SQM
and $12,670 (Stapledon) in 1970.
Research, all of whom produce very useful property related data, or
the official statistics which come from the ABS, but rather just a general
observation given property underpins the local economy.
In the Australian residential property charts we have created and used in
this publication, our primary data source is a residential property price
index series that comes from the Bank for International Settlements.
The BIS series can be found at this link.
https://www.bis.org/statistics/pp_long.htm?m=6%7C288%7C595
11REFERENCES Sources Exter’s Pyramid and the End of Easy Money https://www.abcbullion.com.au/media/SMSF%20National%20Conference%20Report_Final.pdf House Prices to 12th March 2018 https://www.businessinsider.com.au/australia-house-prices-capital-city-comparison-corelogic-2018-3 Reinhart and Rogoff https://voxeu.org/article/economic-and-fiscal-consequences-financial-crises Long Term Housing Prices in Australia http://unsworks.unsw.edu.au/fapi/datastream/unsworks:1435/SOURCE02?view=true Long Term Housing Prices in Australia – v2 http://www.econ.mq.edu.au/Econ_docs/research_papers2/2004_research_papers/Abelson_9_04.pdf Bank for International Settlements House Price Data https://www.bis.org/statistics/pp_long.htm?m=6%7C288%7C595 Newgate Capital Partners article on Australian Housing https://dpsi7pmz5b6vt.cloudfront.net/uploads/media/2796/Newgate_Capital_Partners_-_Analysis_of_the__Australian_Residential_Market_-_May_2016.pdf REIA National House Price Data https://reia.asn.au/product/remf-data-spreadsheet-purchase/ ABC: Housing Slips for Fifth Month http://www.abc.net.au/news/2018-03-01/australian-housing-prices-slip-for-fifth-straight-month/9496392 ASFA data on Super https://www.superannuation.asn.au/resources/superannuation-statistics Reinhardt and Rogoff Paper https://dash.harvard.edu/bitstream/handle/1/11129155/reinhart_rogoff_aftermath_of_financial_crises_aer2009.pdf?sequence=1 Credit Suisse Global Wealth Report http://publications.credit-suisse.com/tasks/render/file/index.cfm?fileid=12DFFD63-07D1-EC63-A3D5F67356880EF3 Disclaimer This publication is for educational purposes only and should not be considered either general or personal advice. It does not consider any particular person’s investment objectives, financial situation or needs. Accordingly, no recommendation (expressed or implied) or other information contained in this report should be acted upon without the appropriateness of that information having regard to those factors. You should assess whether or not the information contained herein is appropriate to your individual financial circumstances and goals before making an investment decision, or seek the help the of a licensed 12 financial adviser. Performance is historical, performance may vary, and past performance is not necessarily indicative of future performance. Any prices, quotes, or statistics included have been obtained from sources deemed to be reliable, but we do not guarantee their accuracy or completeness.
To find out more about investing in precious metals, please visit

                 abcbullion.com.au
                  AUSTRALIA WIDE 1300 361 261
             Level 6, 88 Pitt Street, Sydney NSW 2000
P: +61 2 9231 4511 | F: +61 2 9233 2227 | E: info@abcbullion.com.au

                           @ABCBullion

                  Copyright ® ABC Bullion 2018
You can also read


