AUSTRALIAN INFLUENZA SURVEILLANCE REPORT - Department of Health
←
→
Page content transcription
If your browser does not render page correctly, please read the page content below
AUSTRALIAN INFLUENZA
SURVEILLANCE REPORT
No. 1, 2020
6 April to 19 April 2020
The Department of Health acknowledges the providers of the many sources of data used in this report and
greatly appreciates their contribution.
KEY MESSAGES
It is important to note that due to the COVID-19 epidemic in Australia, data reported from the various
influenza surveillance systems may not represent an accurate reflection of influenza activity. Results should
be interpreted with caution, especially where comparisons are made to previous influenza seasons.
Interpretation of 2020 influenza activity data should take into account, but are not limited to, the impact of
social distancing measures, likely changes in health seeking behaviour of the community including access to
alternative streams of acute respiratory infection specific health services, and focussed testing for COVID-19
response activities. Current COVID-19 related public health measures and the community’s adherence to
public health messages are also likely having an effect on transmission of acute respiratory infections,
including influenza.
Activity – Following a high start to the 2020 interseasonal period, currently, influenza and influenza-like
illness (ILI) activity are lower than average across all systems for this time of year. At the national level,
notifications of laboratory-confirmed influenza have substantially decreased since mid-March and remain
low.
Impact – There is no indication of the potential impact on society of the 2020 season at this time.
Severity – There is no indication of the potential severity of the 2020 season at this time. In the year to
date, of the 20,158 notifications of laboratory confirmed influenza, 30 (0.15%) laboratory-confirmed
influenza-associated deaths have been notified to the National Notifiable Diseases Surveillance System
(NNDSS).
Virology – In the year to date, the majority of nationally reported laboratory-confirmed influenza cases
were influenza A (87.9%). The proportion of cases attributed to influenza B has increased in the past
fortnight (25%), compared to previous fortnights (range 10%-18%).
Vaccine match and effectiveness – It is too early in the season to assess vaccine match and effectiveness.
Introduction
Each year, the influenza virus changes and different strains can circulate in the population. Particular subtypes
of influenza can affect different groups of the population more than others. Depending on the susceptibility of
the population, the subtypes that are circulating and the changes to the virus itself, the influenza season can
be very different year to year. Our surveillance systems help us to understand influenza activity, severity of the
infection in individuals and impact of the illness on society in Australia. We are also able to monitor which
influenza viruses are circulating, which populations might be more affected, the effectiveness of the vaccine,
and any resistance to antiviral drugs that has developed.
Activity measures the capacity of the circulating influenza viruses to spread person to person and may be
measured indirectly through systems that monitor ILI and more directly through systems that monitor
laboratory-confirmed influenza.
Impact measures how the influenza epidemic affects society, including stress on health-care resources and
societal and economic consequences.
Severity is a measure of adverse outcomes or complications as a result of ILI such as hospital referrals,
admissions, need for intensive care and deaths. Measuring and understanding the severity of circulating
influenza is difficult to establish at the beginning of the influenza season. The proportion of confirmed
influenza cases with serious outcomes might be skewed initially because there are only a small number of
people notified at the beginning of the season. This means that the measure of severity will vary substantially
1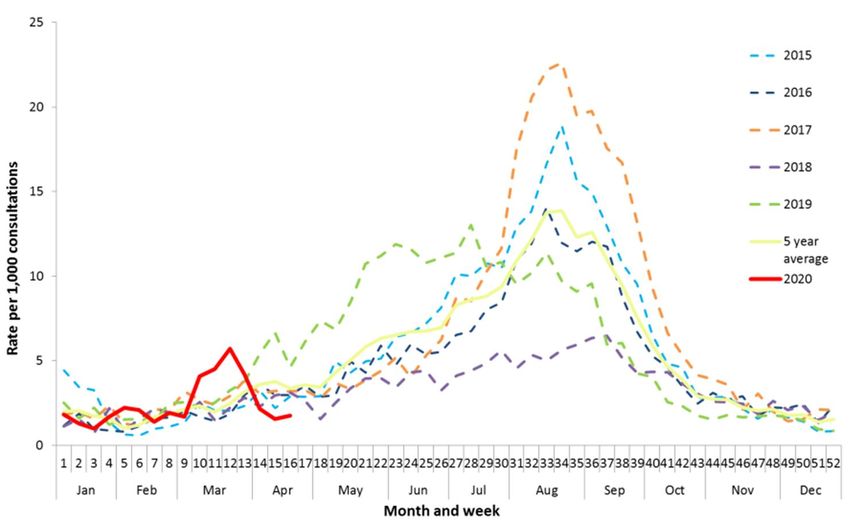
fortnight to fortnight until after the peak of the season, when there is enough data for measurements to
stabilise. An assessment of severity can be provided once the signals become clearer.
Analysis of influenza surveillance systems
Healthdirect
Healthdirect provides free health triage advice and information services by telephone and online, and can assist
in identifying symptoms including those that may be classified as an ILI syndrome. Community level ILI
syndromic trends are monitored using Healthdirect data.
Activity
Calls to Healthdirect relating to ILI for the year to date appear to have been impacted by the bushfires
and COVID-19 (Figure 1).
In late January and early February 2020, the Healthdirect helpline reported an increase in ILI calls
related to bushfire smoke.
During February and March, there was an increase in media coverage of COVID-19 and its symptoms,
which overlap with ILI symptoms reported.
The National Coronavirus Helpline was established on 16 March 2020. Since then, callers to the
Healthdirect helpline who have concerns about COVID-19 have been diverted to the National
Coronavirus Helpline. This explains the sudden drop in ILI related calls to the helpline in mid-March.
This fortnight (6 to 19 April) 3.4% of calls to the Healthdirect helpline have been related to ILI.
Figure 1. Per cent of calls to Healthdirect related to ILI, Australia, 1 January 2015 to 19 April 2020, by month
and week of call*
Source: Healthdirect
* All data are preliminary and subject to change as updates are received.
Flutracking
Flutracking is an online syndromic surveillance system which monitors ILI in the community.
Activity
Flutracking began reporting earlier than usual this year due to COVID-19. As such, historical
comparisons are not available for data reported prior to April 2020.
Since reporting commenced in week 8, Flutracking participants reporting ILI (fever and cough) has
decreased from a peak of 1.5% to a low of 0.25% in week 16 (Figure 2).
This fortnight (6 to 19 April) 0.25% of Flutracking participants reported ILI (fever and cough).
2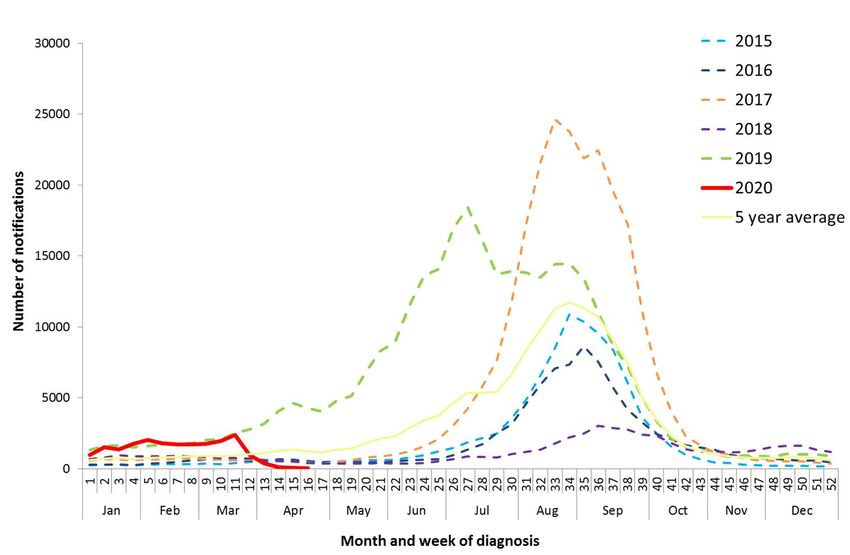
Impact
Since week 8, the proportion of Flutracking survey respondents reporting having ILI and taking time off
regular duties while unwell has declined from a peak of 1.1% in week 8 to 0.1% in week 16.
Figure 2. Proportion of fever and cough among Flutracking participants, Australia, between February and
October, 2015 to 2020, by month and week*
Source: Flutracking
* All data are preliminary and subject to change as updates are received.
Sentinel General Practitioners (ASPREN)
ASPREN is a year-round sentinel general practice surveillance system in which general and nurse practitioners
report de-identified information on the number of ILI patient presentations seen in participating practices each
week.
It should be noted that in addition to the overarching impacts of COVID-19 on influenza surveillance systems
(see page 1), interpretation of ASPREN’s 2020 influenza data should take into account the following COVID-19
impacts:
o changes in the health seeking behaviour at ASPREN sentinel sites due to the availability of telehealth
and respiratory clinics may result in less presentations to General Practice (GP); and
o changes to GPs swabbing at ASPREN sentinel sites, due to the availability of telehealth and respiratory
clinics, may result in a lower number of swabs being undertaken by ASPREN reporters.
Activity
From weeks 1 to 9, sentinel ASPREN general practices (GPs) reported on average 1.7 per 1,000
consultations per week due to ILI.
From week 9, ILI consultations increased and peaked in week 12 (5.7 per 1,000), following which they
declined to 1.8 per 1,000 consultations in week 16 (Figure 3).
In the year to date, the proportion of ILI cases with confirmed influenza seen by sentinel GPs is low. Of
the 271 ILI cases presenting to sentinel GPs who were tested for influenza, 20 (7.4%) were influenza
positive.
In the year to date, influenza positive results for patients tested have ranged between 3% and 42%.
In this fortnight (6 to 19 April), there were no influenza positive results for patients that were tested
through sentinel ASPREN GPs.
The most common respiratory virus reported so far this year is rhinovirus, accounting for 22.5% of all
tests.
3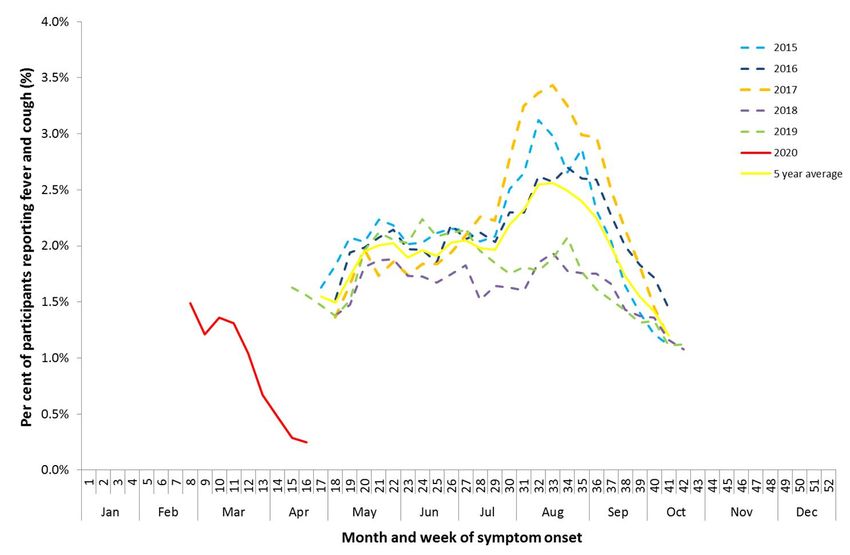
Figure 3. Unweighted rate of ILI reported from sentinel GP surveillance systems, Australia, 1 January 2015 to
19 April 2020, by month and week*
Source: ASPREN
* All data are preliminary and subject to change as updates are received.
Virology
Of the 20 influenza positive samples detected year to date, 10 were influenza A(H1N1)pdm09, five
were influenza A(unsubtyped) and three were influenza A(H3N2). The remaining two were influenza B
(Figure 4).
Figure 4. Proportion of respiratory viral tests positive for influenza in ASPREN ILI patients and ASPREN ILI
consultation rate, Australia, 1 January to 19 April 2020, by month and week*
Source: ASPREN
* All data are preliminary and subject to change as updates are received.
4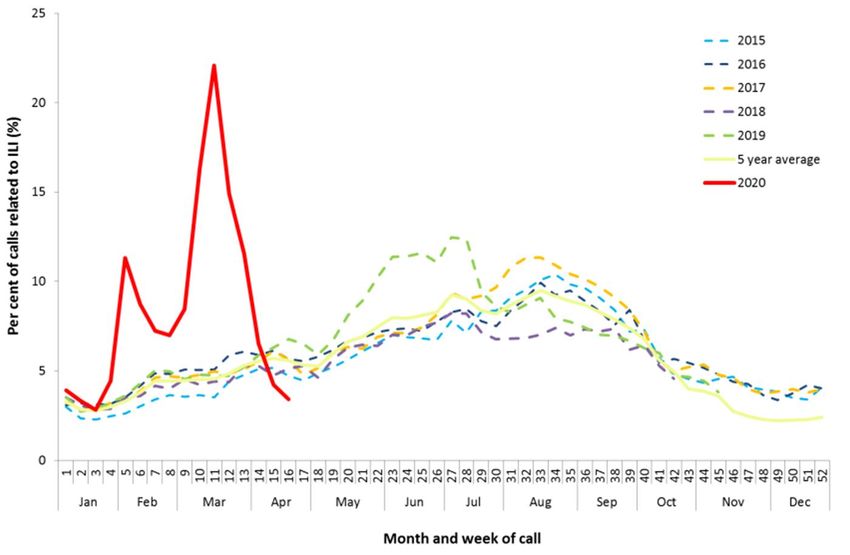
Sentinel Laboratories
Sentinel laboratory surveillance systems provide fortnightly reporting of influenza testing. This includes the
number of tests undertaken, the number of positive results, and the detected viruses.
Activity
Of the 83,777 samples tested across sentinel laboratories in the year to date, 1,897 (2.3%) were
positive for influenza.
Detections of influenza across sentinel laboratories increased from 4.6% in week 1 to 8.5% in week 4
(unweighted percentage of tests positive for influenza across all sentinel laboratories) and steadily
decreased to 0.1% in week 16 (Figure 5).
Figure 5. Proportion of sentinel laboratory tests positive for influenza, 1 January to 19 April 2020, by
contributing laboratory or jurisdiction and month and week†
Source: Sentinel laboratories
†
All data are preliminary and subject to change as updates are received.
* Pooled percentage positive indicators should be interpreted with caution, noting that collectively pooled contributing laboratories are not
representative of testing across Australia and individually contributing laboratories may not be representative of the jurisdiction in which they are
located.
^ Weighted according to jurisdictional population in which laboratories are located.
The percentage of tests positive for influenza in the interseasonal period should be interpreted with caution due to small numbers of tests being
undertaken in this time, resulting in high variability in the indicators.
#
South Australia data only includes specimens tested at SA Pathology. Data from the private laboratories for total number of specimens is not available.
Virology
In the year to date, 84.2% of influenza positive samples detected in sentinel laboratories were influenza A (of
which 34.9% were influenza A(unsubtyped), 18.5% were influenza A(H1N1)pdm09, and 3.8% were influenza
A(H3N2)) and 15.8% were influenza B (Figure 6).
5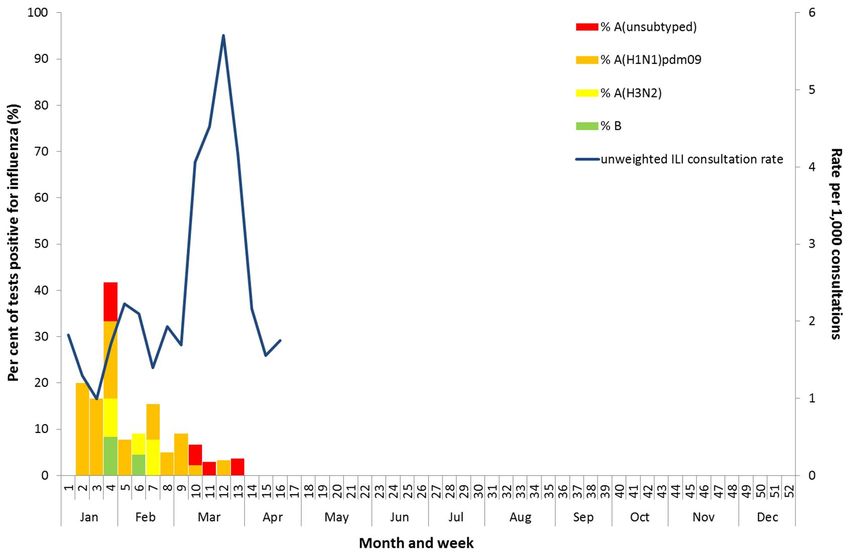
Figure 6. Proportion of sentinel laboratory tests positive for influenza and total number of specimens tested,
1 January to 19 April 2020, by subtype and month and week*
Source: Sentinel laboratories
* Total number of tests include all specimens that were tested for influenza, including multiplex respiratory panels which include both influenza and
SARS-CoV2. Testing methodologies in the response to COVID-19 vary across jurisdictions.
All data are preliminary and subject to change as updates are received.
The Influenza Complications Alert Network (FluCAN)
FluCAN conducts surveillance of severe influenza at sentinel hospitals across the country during the influenza
season.
Activity
Since seasonal sentinel hospital surveillance began on 16 March 2020, the total number of people
admitted to hospital with confirmed influenza (n=9) has been below historical trends (Figure 7).
Figure 7. Number of influenza hospitalisations at sentinel hospitals, between March and October, 2014 to
2020 by month and week*
Source: FluCAN
* All data are preliminary and subject to change as updates are received.
6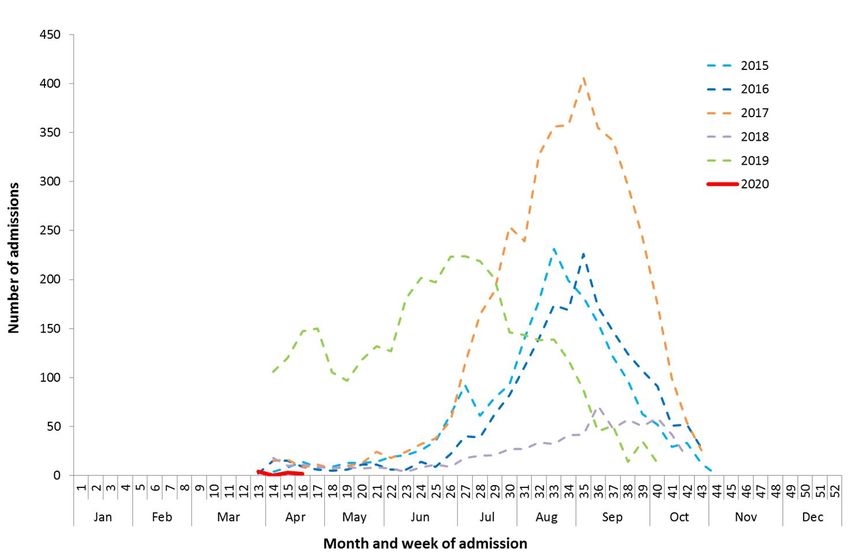
Severity
Of the nine people with confirmed influenza admitted to sentinel hospitals since 16 March 2020, only
one has been admitted to an intensive care unit (ICU).
Virology
Of the nine confirmed influenza admissions to sentinel hospitals:
o Seven were influenza A (four influenza A(H1N1)pdm09, two A(unsubtyped) and one influenza
A(H3N2)); and
o two were influenza B (Figure 8).
Figure 8. Number of influenza hospitalisations at sentinel hospitals by subtype and ICU admission, 16 March
to 19 April 2020, by month and week*
Source: FluCAN
* All data are preliminary and subject to change as updates are received.
At-risk Populations
Of the nine people admitted with confirmed influenza:
o five were children aged 15 years and younger, of which one was admitted to ICU;
o one was aged between 16 and 64 years; and
o three were aged 65 years and older.
National Notifiable Diseases Surveillance System (NNDSS) Notifications
The NNDSS coordinates the national surveillance of more than 50 communicable diseases or disease groups.
Notifications of laboratory-confirmed influenza are made to the States or Territory health authority and
supplied daily to the Australian Government Department of Health via the NNDSS for collation, analysis and to
assist in the coordination of public health responses.
Activity
In the year to date, there have been 20,158 notifications of laboratory-confirmed influenza to the
NNDSS. This fortnight (6 April to 19 April 2020) there were 108 notifications.
There was a steady increase in notifications from weeks 1 to 11 of 2020. From week 12, notifications
have declined and remained low (Figure 9).
7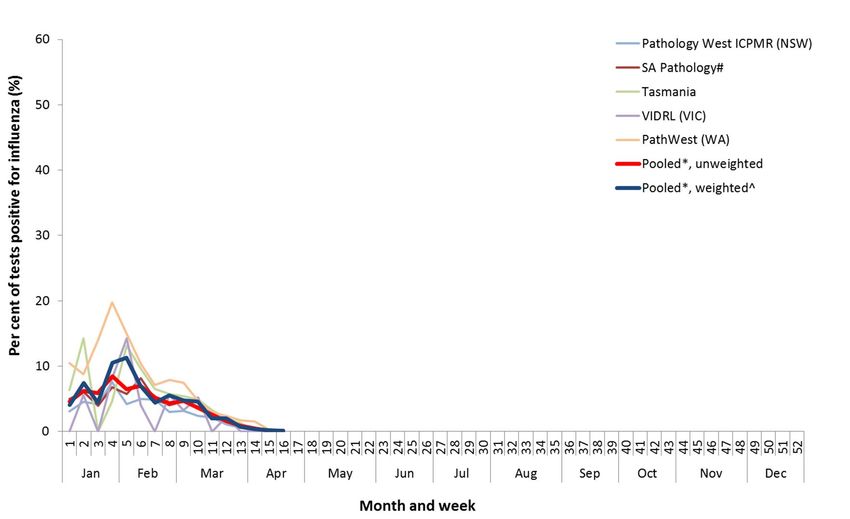
Figure 9. Notifications of laboratory confirmed influenza, Australia, 1 January 2013 to 19 April 2020, by
month and week of diagnosis*
Source: NNDSS
*NNDSS notification data provided for the current and most recent weeks may be incomplete. All data are preliminary and subject to change as updates
are received.
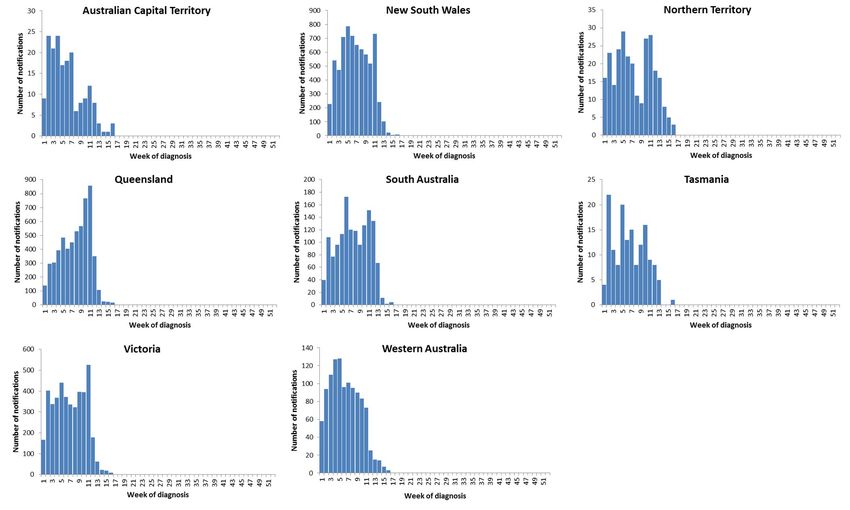
Geographical distribution of activity/Activity
Notifications of influenza have declined across all jurisdictions and remain low compared to previous
weeks (Figure 10).
In the year to date, of the 20,158 notifications of influenza reported to the NNDSS, 6,936 were from
New South Wales (NSW), 5,704 from Queensland (QLD), 4,353 from Victoria (VIC), 1,437 from South
Australia (SA), 1,119 from Western Australia (WA), 273 from the Northern Territory (NT) and 184 from
the Australian Capital Territory (ACT).
For further information regarding influenza activity at the jurisdictional level, please refer to the following
State and Territory health surveillance reports:
ACT: ACT Influenza Report
(www.health.act.gov.au/about-our-health-system/population-health/winter-wellbeing-and-flu/flu-act)
NSW: Influenza Surveillance Report
(http://www.health.nsw.gov.au/Infectious/Influenza/Pages/reports.aspx)
QLD: Statewide Weekly Influenza Surveillance Report (https://www.health.qld.gov.au/clinical-
practice/guidelines-procedures/diseases-infection/surveillance/reports/flu)
SA: Weekly Epidemiological Summary (Influenza section)
(http://www.sahealth.sa.gov.au/wps/wcm/connect/public+content/sa+health+internet/about+us/hea
lth+statistics/surveillance+of+notifiable+conditions)
TAS: fluTAS Reports
(http://www.dhhs.tas.gov.au/publichealth/communicable_diseases_prevention_unit)
VIC: Influenza Surveillance Reports (https://www2.health.vic.gov.au/public-health/infectious-
diseases/infectious-diseases-surveillance/seasonal-influenza-reports)
WA: Virus WAtch (http://ww2.health.wa.gov.au/Articles/F_I/Infectious-disease-data/Virus-WAtch)
8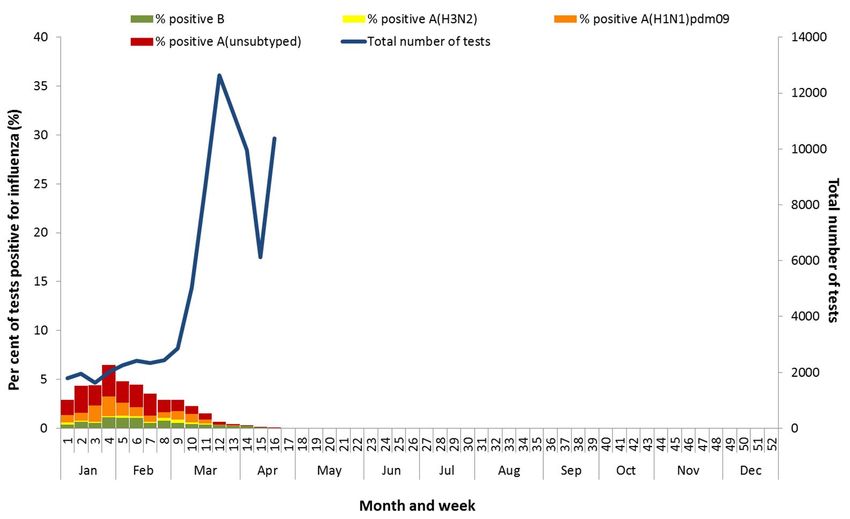
Figure 10. Notifications of laboratory confirmed influenza*, 1 January to 19 April 2020, by state or territory
and week
Source: NNDSS
*NNDSS notification data provided for the current and most recent weeks may be incomplete. All data are preliminary and subject to change as updates
are received.
Severity
So far in 2020, of the 20,158 notifications of laboratory confirmed influenza, 30 (0.15%) laboratory-
confirmed influenza-associated deaths have been notified to the NNDSS.
Where subtyping information was available, five were associated with influenza A(H1N1), one with
influenza A(H3N2), and one with influenza B.
Of the notified deaths, one was in a child aged less than 5 years, six were aged between 20 and 64
years and 23 were aged 65 years and older.
The median age of notified deaths was 76 years.
Note that the number of influenza-associated deaths reported to the NNDSS does not represent the true
mortality associated with this disease. The number of deaths is reliant on the follow up of cases to
determine the outcome of their infection. The follow up of cases is not a requirement of notification, and
are only inclusive of laboratory-confirmed cases of influenza. Due to retrospective revision, the variation
across jurisdictions in methodology, representativeness and timeliness of death data, and reporting of an
outcome of infection not being a requirement of notification, year on year comparisons of deaths in
notified cases of influenza may not be reliable.
Virology
In the year to date, 87.9% of notifications of laboratory-confirmed influenza to the NNDSS were
influenza A (of which, 92.1% were influenza A(unsubtyped), 6.8% were influenza A(H1N1)pdm09 and
1.1% were influenza A(H3N2)), 12% were influenza B, and less than 1% were influenza A&B co-
infections or untyped (Figure 11).
There has been an increase in the proportion of cases reported as influenza B this fortnight (25%),
compared to previous fortnights (range 10%-18%).
9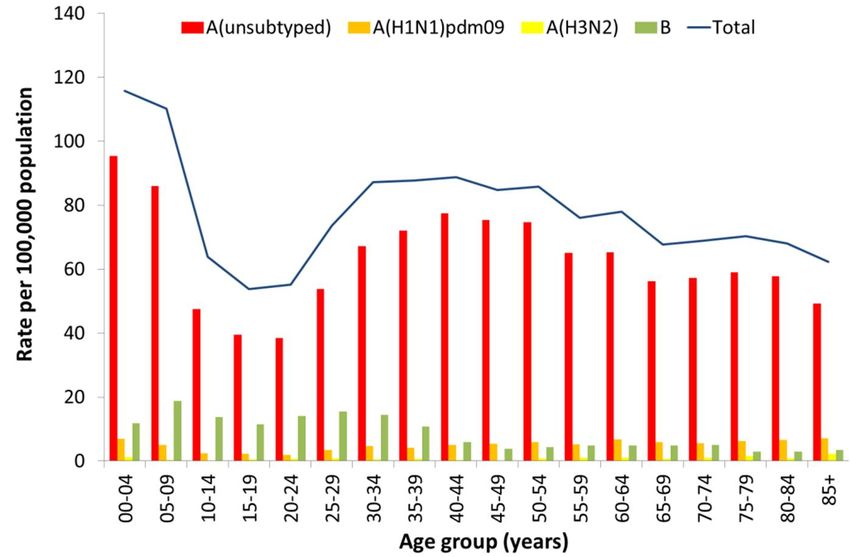
In this reporting fortnight (6 April to 19 April 2020), 75% of notifications of laboratory confirmed
influenza to the NNDSS were influenza A (of which, 92.6% were influenza A(unsubtyped), 6.2% were
influenza A(H1N1)pdm09 and 1.2% were influenza A(H3N2)) and 25% were influenza B.
In the year to date, the proportion of all notifications reported as influenza A has been fairly similar
across jurisdictions, ranging from 87.3% in WA to 90.8% in NT, with the exception of SA (82.7%)
(Figure 12).
Figure 11. Per cent of laboratory confirmed influenza, Australia, 1 January to 19 April 220 by subtype and
week
Source: NNDSS
Figure 12. Per cent of notifications of laboratory confirmed influenza, Australia, 1 January to 19 April 2020,
by subtype and state or territory
Source: NNDSS
10At-risk Populations
In the year to date, notification rates have been highest in children aged less than 10 years (113
notifications per 100,000), while rates in adults aged 65 years or older (67.9 notifications per 100,000)
have been low (Figure 13).
In the year to date, influenza A accounted for the greatest number of notifications across all age groups.
Where further subtyping information was available, notifications were highest in adults aged 85 years and
over (7.2 per 100,000) and children aged less than five years (7 per 100,000) for influenza A(H1N1)pdm09;
in adults aged between 75 and 79 years (1.5 per 100,000) and 80 years and older (1.5 per 100,000) for
influenza A(H3N2); and children aged 5 to 9 years (18.7 per 100,000) for influenza B.
Figure 13. Rate of notifications of laboratory confirmed influenza, Australia, 1 January to 19 April 2020, by
age group and subtype
Source: NNDSS
World Health Organization Collaborating Centre (WHOCC) for Reference and Research on Influenza
The WHOCC monitors the frequent changes in influenza viruses with the aim of reducing the impact of
influenza through the use of vaccine containing currently circulating strains.
Australian Influenza Vaccines Composition 2020
In 2020 all seasonal influenza vaccinations registered for use in Australia are quadrivalent influenza vaccines
(QIVs). The influenza virus strains included in the 2020 seasonal influenza vaccines in Australia are:
A/Brisbane/02/2018 (H1N1)pdm09-like virus;
A/South Australia/34/2019 (H3N2)-like virus;
B/Washington/02/2019-like (B/Victoria lineage) virus; and
B/Phuket/3073/2013-like (B/Yamagata lineage) virus.
The best way to determine how well the vaccine protects against circulating viruses during the season is by
determining the vaccine effectiveness. These estimates provide an indication of how effective the vaccine was
in providing protection against influenza infection. Vaccine effectiveness is usually estimated from
observational studies and is calculated after the end of the influenza season, though interim analyses are
sometimes available where there is sufficient data.
11Virology
From 1 January to 21 April 2020, the WHOCC characterised 185 influenza viruses (Table 1). Of these,
94.6% were influenza A (of which, 88% were A(H1N1)pdm09 and 12% A(H3N2)), and 5.4% were
influenza B Victoria lineage.
Vaccine match
Of the 185 isolates characterised for similarity to their corresponding vaccine components by
haemagglutination inhibition (HI) assay (Table 1):
o 53% of influenza A(H1N1)pdm09 isolates were antigenically similar to the corresponding vaccine
components and 47% were characterised as low reactors;
o 76% of influenza A(H3N2) isolates were antigenically similar to the corresponding vaccine
components; and
o Of the 10 influenza B/Victoria isolates, all were antigenically similar to the corresponding vaccine
component. Year to date, there have been no influenza B/Yamagata isolates characterised.
Table 1. Australian influenza viruses typed by HI from the WHOCC, 1 January to 21 April 2020*
Type/Subtype ACT NSW NT QLD SA TAS VIC WA TOTAL
A(H1N1) pdm09 32 15 37 2 12 0 36 20 154
A(H3N2) 4 3 3 0 4 0 6 1 21
B/Victoria lineage 1 1 0 0 0 0 5 3 10
B/Yamagata 0 0 0 0 0 0 0 0 0
lineage
Total 37 19 40 2 16 0 47 24 185
SOURCE: WHOCC
* Viruses tested by the WHO CC are not necessarily a random sample of all those in the community. State indicates the residential location for the
individual tested, not the submitting laboratory. There may be up to a month delay on reporting of samples.
Antiviral Resistance
The WHOCC reported that from 1 January to 21 April 2020, two of the 198 influenza viruses tested for
neuraminidase inhibitor resistance, demonstrated reduced inhibition to Oseltamivir.
Data considerations
This report presents an overview of influenza activity based on a number of complimentary systems. No one
single system, including notification data, provides the full picture on influenza, because influenza is a common
disease and its presenting symptoms are non-specific. The epidemiology of influenza is informed by a number
of different systems based in the community, laboratories, primary care and hospitals, as well as notifiable
diseases data, which includes officially reported deaths. The information in this report is reliant on the
surveillance sources available to the Department of Health at the time of production.
Data in this summary is reported by International Organization for Standardization (ISO) 8601 weeks, with the
week ending on Sunday. Throughout the summary, where the year to date is presented, this includes data
from 1 January to 19 April 2020. NNDSS data were extracted on 29 April 2020. Due to the dynamic nature of
the NNDSS and other surveillance systems, data in this report are subject to retrospective revision and may
vary from data reported in other national reports and reports by states and territories. Detailed notes on
interpreting the data presented in this report are available at the Department of Health’s Australian Influenza
Surveillance Report website (www.health.gov.au/flureport).
While every care has been taken in preparing this report, the Commonwealth does not accept liability for any
injury or loss or damage arising from the use of, or reliance upon, the content of the report. Delays in the
reporting of data may cause data to change retrospectively. For further details about information contained in
this report please contact the Influenza Surveillance Team (flu@health.gov.au).
12You can also read