Australian Shopping Centre Investment Review & Outlook 2018 - April 2018 - JLL

Page created by Jessie Mendez
 
CONTINUE READING
Australian Shopping Centre Investment Review & Outlook 2018 - April 2018 - JLL
April 2018

Australian Shopping Centre Investment
Review & Outlook 2018
Australian Shopping Centre Investment Review & Outlook 2018 - April 2018 - JLL
Snapshot                                                                                                             Buyer profile
                                                                                                                                                                                 3%
                                                                                                                                                                          Superannuation
                                                                                                                                                                                                 12%
                                                                                                                                                                                                 Other

                                                                                                                                                                              Funds
                                                                                                                                                                                                                                                 34%
                                                                                                                                                                                                                                             Unlisted Funds

       2017 national retail transactions breakdown by state

                                                            SA
                                                                         CT                                             2017                                         16%
                                                                                                                                                                     Offshore
                                                                                                                                                                     Investors

                                                                     A
                                             WA                          2%
                                                             3   %                  /GIC

                                             4                                      13 %

                                                                              VCX
                                   Rest of

                                                 %
                          am
                    ockingh

                              4%                                                                                                                                                  14%
                                                                                                                                                                                                                           21%
                         R
                                                                                                                                                                             Private Investors
                                                                                                      e Hub                                                                                                                AREITs          Source: JLL Research

                                                                                                Hom
         Q LD                                                                                         5%                Transactions by sub-category

       f
       o

   20
                                                             WA
   t

                                                                                                                            8%               12%                 14%                 19%                     23%                          23%
Res

                        %
                                                             $8.8
                                                                              NSW

                                                                                                                                                                                 Large Format
                                                                                                                            CBD         Sub-regional             Other                                      Regional                Neighbourhood
                                                                                                                                                                                    Retail
                                                 QLD

                                                                                                22
                                                                                                                                                                                                                                           Source: JLL Research

                                                                 billion
                                                                                                              %         Key Retail Drivers

                                                                                                                                              Population growth
                                                                                                                                                                         1.3%
                                                                                                                SW
                                                                                                                                                                                       Globally, second highest for an advanced economy
                                                                     VIC                                                                      (10yr forecast p.a.)

                                                                                                                   N
                    op
                      illy
                                                                                                      R e st o f                               Business investment
                                                                                                                                               (p.a. as at Dec-17)       7.4%           A precursor to wage growth

                        9%
               Ind ro
                  oo

                                                                                                                                               Labour market growth
                                                                                                                                               (p.a. as at Feb-18)       3.5%           Double the 10-year average

                                                            C
                                                       VI
                                                                                    8%                                                                                   2.6%
                                                            10%
                                                                                                                                               Wages
                                                                                           nt

                                                                                                                                                                                        Recovery from 2.1% p.a. avg 3-yrs to 2017
                                                  Rest of

                                                                                                                                               (3yr forecast p.a.)
                                                                                           oi

                                                                                    Hig hp
                                                                                                 Source: JLL Research                          Tourist arrivals
                                                                                                                                               (3yr forecast p.a.)       6.6%           Remains a supportive driver

                                                                                                                                                                                   Source: JLL Research, ABS,Deloitte Access Economics, Oxford Economics

   2 I JLL                                                                                                                                                                                                    Shopping Centre Investment Review & Outlook 2018 I 3
Australian Shopping Centre Investment Review & Outlook 2018 - April 2018 - JLL
Table of contents                                            Executive summary
          05 Executive summary                               Retail investment activity in 2017 was the second highest on         Experienced and active asset management will be key to
                                                             record at $8.8 billion. We expect 2018 to be another strong year,    delivering outperformance in the competitive retail landscape.
          06 2017 in review                                  with a number of major transactions already in the pipeline.         Those at the forefront of retail innovation, which are
                                                             Investors have mixed views on the outlook for the retail sector,     introducing new concepts and retail experiences to boost the
          08 Capital sources                                 which has stimulated near-record levels of asset trading. The        attractiveness of shopping centres to customers, will be well-
                                                             changing retail environment is driving transaction activity as       positioned to gain market share in a low-growth environment.
          12 Around the country                              owners refine their portfolios, adjust their exposure to different   Owners will also be seeking to capitalise on the growing
                                                             states and asset types and seek greater diversification to           population density within major capital cities and exploit
          16 Divergence                                      improve their long-term risk-return profile.                         mixed-use development opportunities to utilise surplus land or
                                                                                                                                  re-purposing existing space.
          18 Pricing                                         Polarisation within the retail sector is a global phenomenon.
                                                             A widening variance between the performance of individual            Retail investments can continue to deliver attractive returns for
          21 Discount rates trending down                    retailers and prime and secondary grade retail assets in             prime assets with the right tenant mix for the trade area and
                                                             Australia has resulted in buyers becoming increasingly               for assets in growing catchments. However, asset selection
          22 Macro outlook                                                                                                        will be more important moving forward given the increasingly
                                                             selective and cautious towards underlying asset performance.
          26 Re-leasing spreads                              We see this coming to the forefront of investor considerations       diverse underlying performance. Investors continue to seek
                                                             in 2018, given record-low yields and the increasing reliance on      opportunities in the retail sector to add value and drive
          30 Amazon and the e-commerce trend                 income growth as a driver of returns.                                enhanced returns. Opportunities for high-yield investors will
                                                                                                                                  emerge, particularly in the sub-regional shopping centre sector.
          32 Quantifying the benefit of tenant mix changes   Technology has radically improved price transparency for
                                                             consumers, increasing market efficiency and reducing long-           Owners have been undertaking strategic portfolio restructuring
          34 Department stores                               term profitability for retailers. Despite an overestimated initial   in the last few years to reposition their businesses for growth.
                                                             launch, Amazon’s recent entrance into Australia will likley          While many of the strategic manoeuvres are now largely in
          36 Outlook                                         accelerate this trend over time, by increasing competition and       place, for most groups, we still see a need for ongoing tactical
                                                             putting further downward pressure on retail prices.                  adjustments to retail portfolios (sales and acquisitions) in order
                                                                                                                                  to maximise portfolio returns.

                                                                Figure 1: Transactions by sub-category

                                                                            $10

                                                                             $9

                                                                             $8

                                                                             $7

                                                             AUD Billions
                                                                             $6

                                                                             $5

                                                                             $4

                                                                             $3

                                                                             $2

                                                                             $1

                                                                             $0
                                                                                  2001 2002 2003 2004 2005 2006 2007 2008 2009 2010 2011 2012 2013 2014 2015 2016 2017
                                                                                   Regional     Sub-regional          Neighbourhood            CBD           Large Format Retail                  Other

                                                             Source: JLL Research

4 I JLL                                                                                                                                                 Shopping Centre Investment Review & Outlook 2018 I 5
Australian Shopping Centre Investment Review & Outlook 2018 - April 2018 - JLL
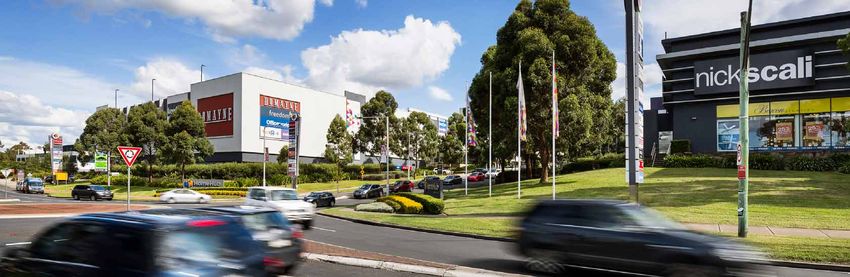
2017 in revеw                                                                                                                                             Figure 2: Transactions by price cohort

– A year boosted by major transactions                                                                                                                  $3.5

                                                                                                                                                        $3.0

                                                                                                                                                        $2.5
Retail transactions reached $8.8 billion in 2017 – the second        4. Home Hub Castle Hill and Home Hub Marsden Park for

                                                                                                                                         AUD Billions
highest annual figure on record – which was a surprisingly              $436 million – the biggest Large Format Retail sale on                          $2.0
strong result following very light volume in the first half of the      record; and
year. Volume was just $2.4 billion in 1H17, with over $6.4 billion
                                                                     5. A 50% share in Rockingham Shopping Centre in WA for
transacting in 2H17.                                                                                                                                    $1.5
                                                                        approximately $305 million.
The five largest transactions accounted for approximately 40%        These five major transactions, all above $300 million, totalled
                                                                                                                                                        $1.0
of the 2017 total volume. Four of which occurred in the second       $3.3 billion. This is the highest volume of transactions above
half of the year. These include:                                     $300 million on record, having increased significantly from the
                                                                     last few years in value terms. While each transaction had its                      $0.5
1. Vicinity Centres/GIC asset swap for $1.1 billion – the            own unique set of circumstances, owners are taking advantage
   largest transaction of 2017;                                      of market liquidity to undertake major asset transactions.
                                                                                                                                                         $0
                                                                     There continues to be a strong trend towards strategic joint
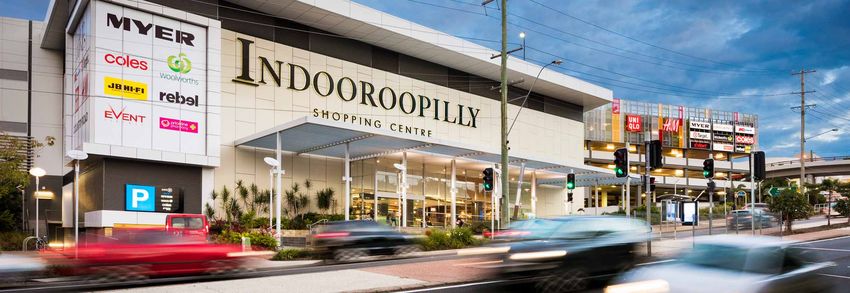
2. A 50% share in Indooroopilly Shopping Centre in Brisbane                                                                                                      $5-$25 million       $25-$50 million      $50-$150 million     $150-$300 million             >$300 million
                                                                     ventures as investors seek liquid part-share investments in
   for approximately $800 million – the biggest retail single-
                                                                     high-quality assets. Investors have been primarily reducing
   asset sale on record;                                                                                                                                                     2008   2009    2010    2011    2012     2013     2014   2015      2016       2017
                                                                     exposure to large individual assets (from 100% share) to
3. A 25% share in Highpoint Shopping Centre in Melbourne             increase portfolio diversification. Some of the key examples of
   for $680 million;                                                 major joint venture deals include: the Vicinity Centres/GIC asset                   Source: JLL
                                                                     swap, Indooroopilly Shopping Centre, Rockingham Shopping
                                                                     Centre, MLC Centre and Wynyard Place.

                                                                                                                                                                                                                      Indooroopilly Shopping Centre, QLD (50%)
                                                                                                                                                                                                                      Transacted by JLL with co-agent on behalf of Commonwealth
                                                                                                                                                                                                                      Superannuation Corporation (CSC) to AMP Capital Shopping
                                                                                                                                                                                                                      Centre Fund (ASCF) / AMP Capital Diversified Property Fund
                                                                                                                                                                                                                      (ADPF) for over $800.0 million

6 I JLL                                                                                                                                                                                                                                 Shopping Centre Investment Review & Outlook 2018 I 7
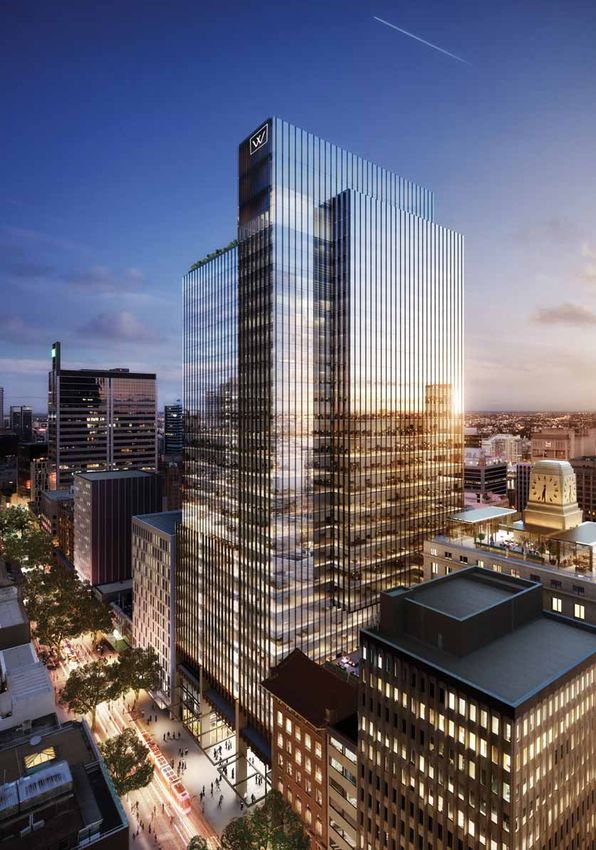
Australian Shopping Centre Investment Review & Outlook 2018 - April 2018 - JLL
Capital sources
 – Unlisted funds were the dominant source of capital in 2017

Investors were clearly very active on both the buy and sell          AREITs were net buyers in 2017, after having been a net seller               accounting for 16% of total sales in 2017. While there continues   been most impacted by the change to-date, particularly for
side in 2017, given the near-record level of activity. Unlisted      of assets in the five years prior. Vicinity Centres REIT was a net           to be significant demand from overseas institutional investors     assets with vacancy risk or high levels of competition and/
funds dominated acquisitions, but AREITs were also active,           buyer (of just $16.3 million), but was a net seller as a Group               for Australian retail assets, the focus is on prime quality core   or new supply. While access to debt has become somewhat
albeit on both sides of transactions, as net buyers of $500          (including asset sales by Vicinity-managed unlisted funds).                  and core-plus opportunities. Although direct acquisitions by       harder, demand from private investors has remained firm.
million in 2017.                                                     Vicinity Centres, Charter Hall and Aventus accounted for 84% of              offshore investors declined, offshore investors contributed        Some buyers have been using equity to acquire assets, with the
                                                                     acquisitions by AREITs in 2017 (excluding the retail component               strongly to activity by investing indirectly into domestically-    view to borrow against the property post-acquisition.
Unlisted funds were the biggest buyer group in 2017 by a             of MLC Centre acquired by Dexus). SCA Property Group and                     managed wholesale funds.
significant margin, acquiring $3.0 billion or 34% of total           Mirvac Group also acquired assets in 2017, although less than                                                                                   The ‘other’ owner category primarily includes corporates
transactions. AMP Capital and GPT accounted for over                 in previous years (by value). SCA Property Group purchased                   Private investors are still very active in terms of new            (Woolworths and Wesfarmers), developers and syndicates.
three quarters of the activity (73%), with a range of major          two Gold Coast assets, Mudgeeraba Market and Worongary                       acquisitions and divestments. However, banks have tightened        Woolworths and Wesfarmers (including Coles Group and
investments, including a 50% share in Indooroopilly Shopping         Town Centre, as well as Sugarworld Shopping Centre in Cairns.                lending to this buyer cohort to some extent. Loan-to-value         Bunnings) have been a major source of investment product
Centre for approximately $800 million (ASCF/ADPF), a 25%             Mirvac acquired the remaining 50.1% share in East Village,                   ratios have decreased to approximately 50-55% from 60-65%          in the retail sector over the last decade, particularly with the
share in Highpoint Shopping Centre for $680 million (GWSCF)          Zetland for $155.3 million and the 50% share in the proposed                 previously. Banks have also become much more selective             development and sale of supermarkets, neighbourhood
and a 50% share in Rockingham Shopping Centre for                    South Village Shopping Centre.                                               about who they lend to and the characteristics of the              centres and hardware warehouses. Combined, the two groups
approximately $305 million (ASCF).                                                                                                                underlying asset. We see this potentially impacting yields in      have sold approximately $3.7 billion worth of direct real estate
                                                                     Offshore investors accounted for a much smaller proportion                   the neighbourhood shopping centre market given the high            over the last ten years.
AMP Capital was the biggest buyer of retail assets in 2017,          of transaction activity in 2017 than the previous year.                      participation rate of private investors. Private investors have
acquiring approximately $1.5 billion (excluding Gasworks             Acquisitions by offshore investors declined to $1.4 billion in
Plaza). However, Vicinity Centres was the most active group          2017, from $2.5 billion in 2016. Despite the 46% decrease in
over the course of the year, completing approximately $1.9           offshore investment in 2017, volumes were in line with the
billion in transactions (including divestments and acquisitions).    10-year average in percentage terms, with offshore investors

 Figure 3: Buyer profile                                                                                                                                                                                                   Rockingham Shopping Centre, WA (50%)
                                                                                                                                                                                                                           Transacted by JLL on behalf of Vicinity Retail Partnership
                                                                                                                                                                                                                           (VRP) to AMP Capital Shopping Centre Fund (ASCF)
                               2016                                                                              2017                                                                                                      $305.0 million

                             8%         12%                                                              12%
                 7%          Other   Unlisted Funds
                                                                                       3%                Other
            Superannuation
                                                                                  Superannuation
                Funds
                                                                                      Funds
                                                                                                                                    34%
                                                                                                                                 Unlisted Funds
                                                            17%
                                                            AREITs
                                                                         Offshore
                                                                         Invсtors         16%
Offshore
Invсtors        34%
                                                      22%                                14%
                                               Private Investors
                                                                                     Private Investors                  21%
                                                                                                                        AREITs

Source: JLL Research

8 I JLL                                                                                                                                                                                                                                    Shopping Centre Investment Review & Outlook 2018 I 9
Australian Shopping Centre Investment Review & Outlook 2018 - April 2018 - JLL
Figure 4: Net buyer analysis

           MLC Centre, NSW (50%) - office
           and retail complex                                                              $2.0
           Transacted by JLL with co-agent on behalf of QIC

                                                                      AUD Billions
           to Dexus for $722.5 million                                                     $1.5

                                                                                           $1.0

                                                                                           $0.5

                                                                                           $0.0

                                                                                           -$0.5

                                                                                           -$1.0

                                                                                           -$1.5

                                                                                           -$2.0   Unlisted Funds       AREITs           Private       Offshore         Superannuation                  Other
                                                                                                                                        Investors      Investors            Funds

                                                                      Source: JLL Research                                  „
                                                                                                                             2013    „
                                                                                                                                      2014   „
                                                                                                                                              2015    „
                                                                                                                                                       2016     „
                                                                                                                                                                 2017

                                                Artist’s impression

                                                                               Figure 5: Annual retail transactions (divestments) by Woolworths and Wesfarmers

           The Station Oxley, QLD
           Transacted by JLL on behalf of Folkestone to Savills                             $900
           Investment Management for $43.5 million
                                                                                            $800
                                                                                            $700

                                                                            AUD Millions
                                                                                            $600
                                                                                            $500
                                                                                            $400
                                                                                            $300
                                                                                            $200
                                                                                            $100
                                                                                              $0
                                                                                                                      Wesfarmers                                           Woolworths

                                                                                                          „
                                                                                                           2008     „
                                                                                                                     2009    „
                                                                                                                              2010   „
                                                                                                                                      2011   „
                                                                                                                                              2012   „
                                                                                                                                                      2013    „
                                                                                                                                                               2014       „
                                                                                                                                                                           2015        „
                                                                                                                                                                                        2016        „
                                                                                                                                                                                                     2017
                                                                      Source: JLL Research

10 I JLL                                                                                                                                                           Shopping Centre Investment Review & Outlook 2018 I 11
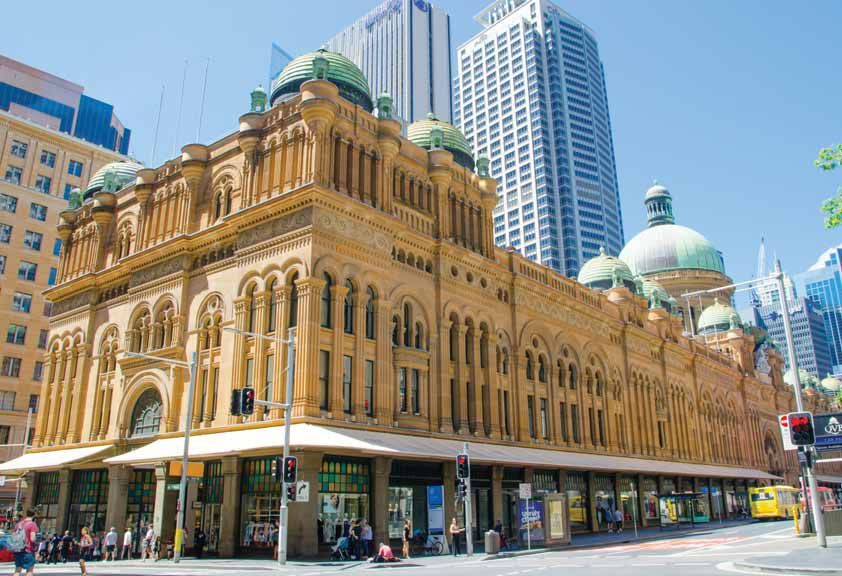
Australian Shopping Centre Investment Review & Outlook 2018 - April 2018 - JLL
Around the country
– Record volumes reached in New South Wales and Queensland in 2017

           New South Wales                                             Figure 6: 2017 national                                          CT
                                                                                                                                  SA
                                                                                                                                                                                                     Victoria

                                                                                                                                        A
                                                                       retail transactions
                                                                                                                   WA                       2
           New South Wales recorded $3.4 billion of retail                                                                                                                                           Victoria recorded a decline in investment activity to $1.5
                                                                                                                                                %
           transactions in 2017, the highest figure ever recorded      breakdown by state
                                                                                                                                   3%                     /GIC                                       billion in 2017 from $1.9 billion in 2016, despite the sale

                                                                                                                   4%                                     13 %

                                                                                                                                                    VCX
                                                                                                         Rest of
           for the state. However, the top two transactions                                                                                                                                          of a 25% share in Highpoint Shopping Centre for $680
           accounted for nearly half (46%) of the total (by value).                                                                                                                                  million in July 2017. However, the lack of transactions is
           The largest of which was the asset swap between GIC                                  am                                                                                                   not reflective of investor sentiment in the state. Victorian

                                                                                          ockingh
                                                                                                    4%
           and Vicinity Centres for approximately $1.1 billion – all                                                                                                                                 retail assets are typically tightly held, particularly
           four assets in the transaction are located in Sydney.                                                                                                                                     by private investors, given their scarcity relative to
           The sale of Home Hub Castle Hill and Home Hub                                       R                                                                                                     other states. Shopping centres in Victoria are highly
           Marsden Park for $436 million also boosted the states                                                                                                                                     sought after at present because of the very high rate
           volume in 2017.                                                                                                                                                  e Hub                    of population growth relative to other states (2.3% as

                                                                                                                                                                      Hom
                                                                                                                                                                            5%
                                                                                                                                                                                                     at June 2017). The high rate of growth provides a solid

                                                                                  LD
           Queensland                                                                                                                                                                                baseline for future retail turnover growth. Investors will
           Queensland remains a very liquid market and
           continues to receive a disproportionate share                      f
                                                                                Q                                                                                                                    be aiming to capitalise on the fast population growth by
                                                                                                                                                                                                     seeking assets that are positioned in close proximity to
           of activity. The attractive yield spread between                   o                                                                                                                      clusters of residential development.

                                                                                                                                   WA

                                                                            20
                                                                          t
                                                                       Res

           Sydney/Melbourne and S.E Queensland has
           resulted in investors seeking opportunities in the
           Queensland retail market in the last few years. In
                                                                                              %                                                                                                      Western Australia

                                                                                                                                                    NSW
           the neighbourhood sub-sector for example, the S.E                                                                                                                                         Western Australia is gaining renewed investor
           Queensland to Sydney yield spread has been around                                                                                                                                         interest, with a growing view that market conditions
           30 bps historically (10-year average). At its widest,                                                                                                                                     have bottomed and an economic rebound will be

                                                                                                                    QLD
           it was 125 bps in 3Q16. Even though the spread                                                                                                                                            supportive of retail spending over the medium term.

                                                                                                                                                                      22
           has narrowed (to 75 bps at 4Q17), it remains wide                                                                                                                                         Investors with a long-term investment horizon will

                                                                                                                                                                                    %
           by historical standards. A very similar trend exists                                                                                                                                      be actively seeking opportunities in Perth for relative
           between S.E Queensland and Victoria.                                                                                                                                                      value, as opportunities arise. However, Perth has a
                                                                                                                                                                                                     number of major development projects in the pipeline
           Queensland is also attracting investor interest                                                                                                                                           between now and 2020. This predominantly includes
           because of the greater availability of investment

                                                                                                                                                                                       SW
                                                                                                                                                                                                     extensions to regional shopping centres, which may
           opportunities relative to other states. The relatively
           larger proportion of syndicates and private
                                                                                                                                        VIC                                                          increase competition in the leasing market if they

                                                                                                                                                                                         N
                                                                                                                                                                                                     progress as planned. Transaction volume was $633.4
           developers in Queensland enables greater liquidity.                                                                                                                                       million in 2017 and has been relatively stable at around
           Furthermore, Queensland has a larger asset base
           due to the state’s size and dispersion, with many
                                                                                                                                                                            R e st o f               $600 million per annum (p.a.) since 2013.
                                                                                            illy
           sub-cities, including the Gold Coast, Sunshine                                 op
                                                                                     Ind ro

                                                                                              9%
           Coast and Townsville. This larger pool of investment                                                                                                                                      South Australia
                                                                                        oo

           opportunity is contributing to the higher transaction
           volume. Queensland has approximately 34% more                                                                                                                                             South Australia has had no transactions above $50
           shopping centres (by number) than Victoria, and                                                                                                                                           million in the last two years. This is largely driven by a

                                                                                                                                  C                                                                  shortage of stock rather than subdued investor demand.
                                                                                                                             VI
           only 18% less than New South Wales. Queensland is

                                                                                                                                                          8%
           the second largest market by number of assets and                                                                                                                                         While South Australia is forecast to have a low rate of

                                                                                                                                  10%
           total floor area, despite being the third largest state                                                                                                                                   population growth, underpinning consumer demand

                                                                                                                                                                 nt
                                                                                                                        Rest of

           by population and having the third largest share of                                                                                                                                       over a longer time horizon, retail turnover growth has

                                                                                                                                                                 oi
                                                                                                                                                                                                     been relatively strong over the last few years, with 3.8%
           national economic output.                                                                                                                      Hig hp              Source: JLL Research   p.a. for 2017. Higher yields relative to other states are
                                                                                                                                                                                                     likely to be attractive to a range of buyers in the low-yield
                                                                                                                                                                                                     environment, despite the lower growth profile over the
                                                                                                                                                                                                     long-term.

12 I JLL                                                                                                                                                                                                          Shopping Centre Investment Review & Outlook 2018 I 13
Australian Shopping Centre Investment Review & Outlook 2018 - April 2018 - JLL
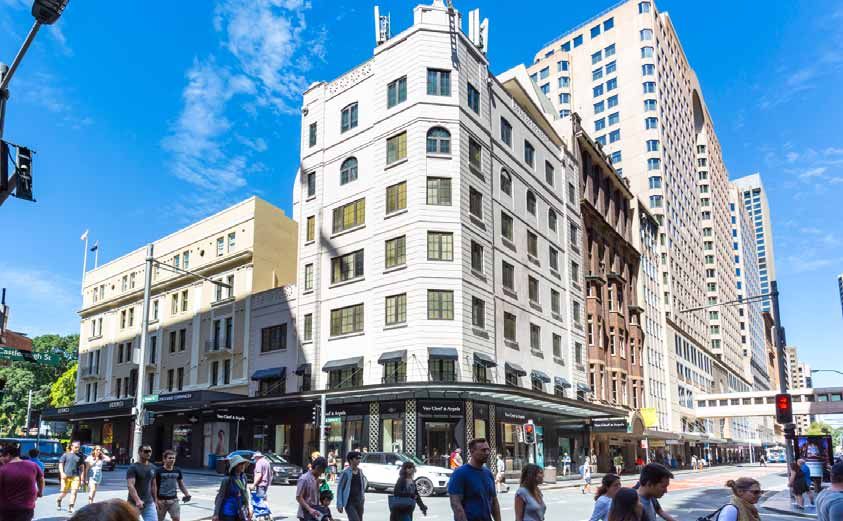
Wynyard Place, NSW (49.9%)
    Figure 7: Neighbourhood yield spread – South East Queensland to Sydney/Melbourne                                                         - office and retail complex
                                                                                                                                             Transacted by JLL on behalf of Brookfield Property
                  150                                                                                                                        Partners to AMP Capital Wholesale Office Fund
                                                                                                                                             (AWOF) & Uni Super for approximately $953.0 million

                  125
   Basis Points

                  100

                    75

                    50

                    25

                     0
                         Sep-16   Dec-16           Mar-17          Jun-17           Sep-17       Dec-17   10-Yr Hist
                                                                                                             Avg
                                           S.E. Qld - Sydney                   S. E. Qld - Melbourne
 Source: JLL Research

   Figure 8: Transactions by state – last five years

                  $3.5

                  $3.0

                  $2.5
AUD Billions

                  $2.0

                  $1.5

                  $1.0

                  $0.5

                  $0.0
                          NSW         VIC                   QLD              WA                SA          ACT

                                              „
                                               2013    „
                                                        2014      „
                                                                   2015     „
                                                                             2016    „
                                                                                      2017
Source: JLL Research

14 I JLL                                                                                                               Artist’s impression        Shopping Centre Investment Review & Outlook 2018 I 15
Australian Shopping Centre Investment Review & Outlook 2018 - April 2018 - JLL
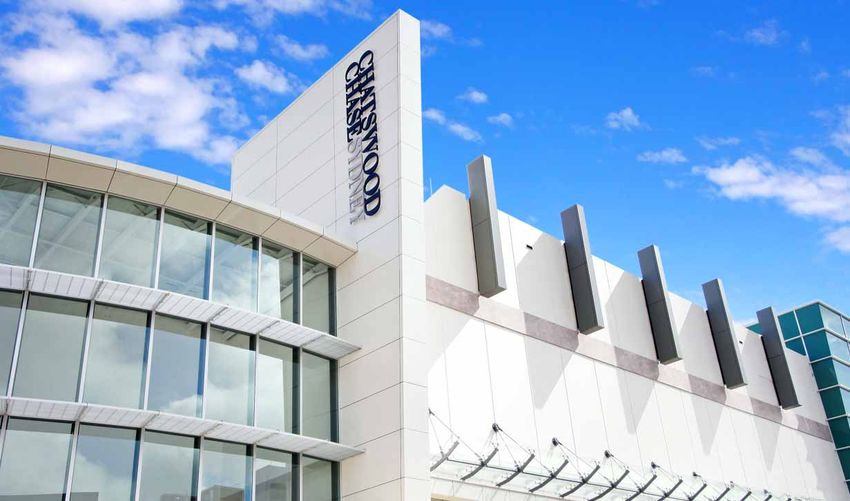
Diverгnce                                                                                                                            Queen Victoria Building, NSW (50%)
                                                                                                                                     Sold as part of the Vicinity Centres / GIC asset swap
– How to position in a divergent sector                                                                                              for $301.2 million

Divergence between high and low quality assets is a major         Shopping centres will need to be more intensively managed
theme in retail, in Australia and globally. The changing retail   in the changing retail environment to preserve and drive asset
environment is creating risks and opportunities, which is         value. Owners with specialised retail management expertise
encouraging transaction activity – as varying opinions towards    will have a competitive advantage in this regard. This has
the outlook for retail market conditions, combined with varying   been a major driver of the co-investment trend as investors
thresholds for risk tolerance, influence investment decisions.    seek joint ventures with high quality managers. A more active
There is a significant cohort of the investment community that    approach to portfolio management will be required to reduce
believes physical retail can continue to thrive with the right    exposure to underperforming assets and re-weight their
tenant mix, solid catchment demographics and initiatives          portfolio towards better quality retail assets.
tailored to consumer trends for the next generation.
                                                                  More challenging trading and leasing conditions will see
The retail sector is going through a period of adjustment as      demand for secondary grade retail assets ease across all
retailers continue to revise their business models to reflect     sub-sectors. The wide variation in individual retailer and asset
the globalisation of retail, changes in technology, changing      performance is now well-understood by owners and investors.
preferences and trends between generations. Shopping              Investors are beginning to price assets accordingly. Asset
centre owners are acutely aware of the changes in the retail      selection will be even more important in the next few years.
industry and the impact that it is having on retailer decision-
making. Centre owners are taking a proactive approach to
retailer engagement strategies to ensure occupancy rates are
maintained.

                                                                                                                                     The Galeries, NSW (50%)
                                                                                                                                     Sold as part of the Vicinity Centres / GIC asset swap
                                                                                                                                     for $143.1 million

16 I JLL                                                                                                                                     Shopping Centre Investment Review & Outlook 2018 I 17
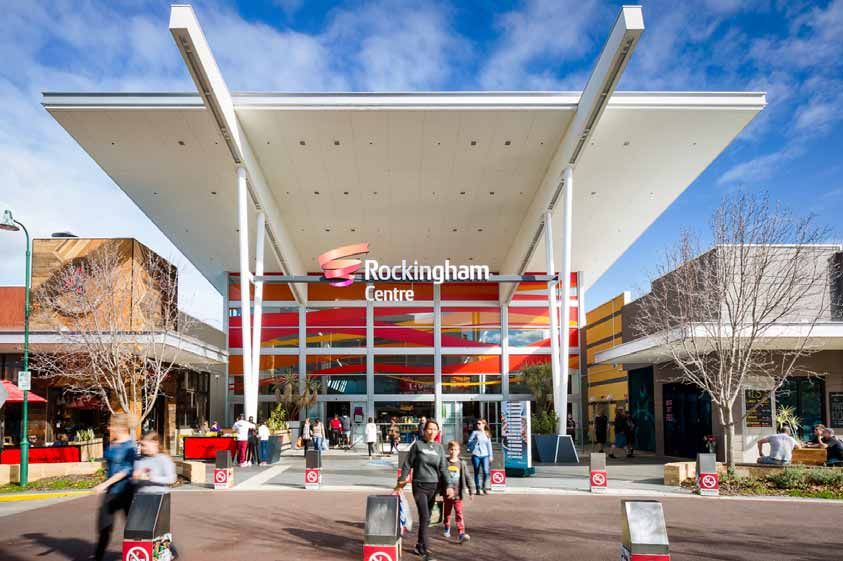
Australian Shopping Centre Investment Review & Outlook 2018 - April 2018 - JLL
Pricing
      – Yields are starting to adjust                                                                                                                          Figure 10: Regional yield spread to 10-year inflation-indexed Government bond rate profile

The divergence theme is starting to be reflected in pricing. The              Investor risk appetite faded through 2017 and demand for
first signs of yield decompression in this cycle have emerged.                secondary assets softened. Book values and yields for non-
We recorded softening at the lower end of the yield range in                  core assets were being held at a level which was unsustainable
                                                                                                                                                                600
4Q17, yet continued to record further compression at the upper                relative to purchaser demand for that type of product and the
end of the yield range for prime assets in certain sub-sectors.               risks associated with that asset class. A number of assets were
We expect this trend to extend to other markets across multiple               offered for sale but withdrawn as the vendor/buyer price-                         550
sub-sectors from early 2018.                                                  expectation gap widened.
                                                                                                                                                                500
There continues to be robust demand for prime assets                          We have analysed yields for approximately 120 sub-regional

                                                                                                                                                Basis points
primarily from domestic unlisted funds and offshore investors.                shopping centres over the last 11 years to assess the yield                       450
These investors are attracted to prime assets for their ability               profile at different points in time. The dispersion of yields
to retain tenants, grow market share within their catchments,                 (around the average) was lower in 2017 than in the previous                       400
and ultimately, deliver attractive returns for investors. We                  market upturn in 2007. In 2007, the overall yield range was
expect competition for prime retail assets to remain strong,                  between 5.50%-7.75%, although yields for individual assets                        350
with yields for core assets in most retail sub-sectors likely                 were highly concentrated within a very narrow range. Of
to stabilise at their current levels, at least through 2018 and               these assets, 83% were within 6.00%-6.75% (75 basis points).                      300
potentially extending into 2019. Positive returns are likely to               However, in 2017, the overall range was not only wider
be disproportionately skewed towards quality assets. Quality                  (at 5.25%-8.00%), but properties were also more evenly                            250
assets are generally those with strong demographics and/or                    distributed within the range this time around, with 83% of the
a growing trade area, inner-urban and metropolitan-located                    assets spread out across 150 bps (5.50%-7.00%).                                   200
assets or assets that dominate their catchment.
                                                                                                                                                                      Dec-01        Dec-03          Dec-05          Dec-07        Dec-09       Dec-11         Dec-13             Dec-15            Dec-17

                                                                                                                                                                                  Spread                Historical benchmark                Spread post reversion in real bond rate to 2%

                                                                                                                                                               Source: RBA, JLL Research
       Figure 9: Sub-regional shopping centre yield profile

                       30                                                                                                                                      The flatter yield profile is evidence of investors being more        There is likely to be a gradual process of adjustment in capital
                                                                                                                                                               discriminating towards pricing for individual assets and is          markets as central banks globally move into a tightening
                                                                                                                                                                                                                                    cycle. If the inflation-indexed Australian 10-year government
Number of Properties

                       25                                                                                                                                      reflective of the divergence in the performance of underlying
                                                                                                                                                               assets. The sub-regional vacancy rate, for example, was 1.8%         bond rate were to continue to rise from 1.1% in February
                                                                                                                                                               in December 2007 compared with 3.2% in December 2017.                2017 to 2.00%, but remained below the historical average
                       20                                                                                                                                                                                                           of 2.75%, the spread across each retail sub-sector would
                                                                                                                                                               Owners and investors may adopt a more defensive retail               narrow to unsustainably low levels. In this scenario, the spread
                       15                                                                                                                                      strategy in 2018 given the competitive retail environment            would be well below the historical benchmark and would
                                                                                                                                                               and subdued outlook for income growth. Our view is that              be approximately in line with 2007 levels. Assuming a rise
                       10                                                                                                                                      average yields will likely soften across all real estate sectors     in the real bond rate to 2.00%, the spread for regional, sub-
                                                                                                                                                               as long-term interest rates begin to move higher from the            regional and large format retail shopping centres would each
                       5                                                                                                                                       exceptionally low current levels. The risk premium for retail        be approximately 75 bps below their historical benchmark.
                                                                                                                                                               assets (spread between property yield and the inflation-             Neighbourhood yields would be 136 bps below the historical
                                                                                                                                                               indexed 10-year government bond rate, i.e. risk-free rate) is        benchmark and CBD retail would be 95 bps below. We reiterate
                       0                                                                                                                                                                                                            that core shopping centre yields within each category are likely
                            5.00 5.25 5.50 5.75 6.00 6.25 6.50 6.75 7.00 7.25 7.50 7.75 8.00 8.25 8.50 8.75 9.00 9.50 10.00 10.25                              currently slightly above the historical benchmark across all
                                                                                                                                                               of the retail sub-sectors (except neighbourhood shopping             to remain resilient given the increased investor demand for
                                                                             Yield %                                                                           centres), suggesting that retail assets are still attractively       quality assets.
                                                         2007         2009             2013        2017                                                        priced. We adopt the ten years to 2011 as the historical
                                                                                                                                                               benchmark, reflecting the period before exceptionally low
   Source: JLL Research                                                                                                                                        interest rates.

18 I JLL                                                                                                                                                                                                                                                Shopping Centre Investment Review & Outlook 2018 I 19
Discount ratс trending down
                                                                                Discount rates for all commercial property sectors have                    discount rates over time. Figure 12 shows the spread between
                                                                                compressed significantly since 2013, by approximately 181                  the discount rate and capitalisation rate.
                                                                                basis points, reflecting the adjustment in return expectations
           “ The retail investment market has moved to a two-tier               and the low-growth environment (Figure 11). The “lower-                    Super and major-regional centres have seen the greatest
                                                                                for-longer” thesis has driven a structural shift towards lower             downward revision in the capital growth component across the
           position where yields for high quality retail assets have            capitalisation rates and lower income growth for property                  real estate sectors. However, in absolute terms, this sub-sector
           shown further compression over the past 12 months,                   over the long term. The combination of these adjustments has
                                                                                resulted in a reduction in the capital growth component of
                                                                                                                                                           is still expected to have the highest annual capital growth on a
                                                                                                                                                           long-term view across retail, office and industrial.
           particularly in the regional shopping centre sector, while
           weaker performing retail properties are being priced at               Figure 11: Average discount rate by real estate sector and sub-sector

           discounts. Equally, discount rates for the better quality retail     10.50     % p.a.

           assets have compressed as return expectations shift lower.           10.00

           There appears potential for further yield softening for non-         9.50

           core assets, coinciding with an increase in stock (supply) as        9.00

           owners seek to rebalance portfolios. Interestingly, average          8.50

           neighbourhood shopping centre yields tightened in 2018 and           8.00
                                                                                7.50
           are now below sub-regional centre yields for the first time on
                                                                                7.00
           record, reflecting a re-rating of the relative risk profile of the
                                                                                6.50
           two asset classes. The subdued sales performance of discount                 2007        2009         2011     2013       2015        2017             2007       2009          2011          2013         2015         2017
           department stores and greater weighting of apparel stores                           Super and Major-regional            Neighbourhood                         Industrial Warehouse                       Office - Non-CBD

           (and increased activity of digital disruptors) has weighed on                       Regional                            Large Format Retail                   Industrial Distribution Centre             Office - CBD
                                                                                               Sub-regional
           the sub-regional sector, while non-discretionary supermarket-
                                                                                Source: MSCI, JLL Research
           anchored centres have performed well. ”
                                                                                 Figure 12: Growth expectations – spread between discount rate and capitalisation rate

           John Burdekin                                                        3.0

                                                                                2.5
                                                                                         % p.a.

           Head of Retail Valuations & Advisory,                                2.0

           Australia                                                            1.5

                                                                                1.0

                                                                                0.5

                                                                                0.0

                                                                                -0.5

                                                                                -1.0

                                                                                         Super and            Regional    Sub-regional    CBD Office        Non-CBD        Neighbourhood          Industrial        Industrial
                                                                                        Major-regional                                                       Office                              Distribution       Warehouse
                                                                                                                                                                                                    Centre
                                                                                                                               10-Year Average           Dec-17             Spread
                                                                                Source: MSCI, JLL Research
20 I JLL                                                                                                                                                                             Shopping Centre Investment Review & Outlook 2018 I 21
Macro outlook
– Wages will be the catalyst for stronger leasing market conditions                                                                     Figure 14: Business investment

The Australian economy is in relatively good shape moving           household debt – from 161% of annual household disposable
into 2018. The labour market is strong, business investment         income in December 2012 to 188% in September 2017.                    15.0%
is picking up and the risks to retail spending posed by the         However, the household debt-to-assets ratio has fallen slightly
housing market have subsided to some extent.                        since 2013, suggesting that the risks to retail spending are not
                                                                    necessarily driving pressure on household balance sheets, but         10.0%
Nevertheless, the housing market still presents a persistent,       on household budgets.
albeit more subdued, risk to the outlook for retail spending
growth. The Australian Prudential Regulation Authority (APRA)       The impact of policies implemented by APRA has already
moved swiftly to ensure financial stability in the economy by       raised mortgage rates for some borrowers, primarily for                5.0%
reducing risks in the housing market. Subsequent changes            interest-only owner-occupier loans and investment loans.
in lending criteria by the major banks helped to manage             The average variable mortgage rate for owner-occupiers has
an orderly slowdown in house price growth. Such changes             remained stable but for investor loans has increased by 30
have had the effect of reducing the risk of a more substantial      basis points since November 2016. The official cash rate has           0.0%
contraction in house prices by shortening the cycle, tempering      been unchanged at 1.5% since August 2016, but financial
investor demand and reducing potential for oversupply. As           markets are pricing in a 100% chance of a 25 basis point
a result, there is less chance of an imminent drag on retail        increase in the official cash rate by April 2019 and a 50%
spending growth from a reduction in household wealth and            chance of a further 25 basis point rate rise by July 2019 (as at      -5.0%
consumer confidence.                                                February 2018).

Growth in household debt poses some risk to the outlook for
                                                                                                                                         -10.0%
the retail sector, should interest rates begin to rise. The rise
in house prices since 2012 has meant substantial growth in

                                                                                                                                         -15.0%
                                                                                                                                                  Dec-2013                    Dec-2014                   Dec-2015                   Dec-2016                          Dec-2017
 Figure 13: Labour market conditions
                                                                                                                                                                                   Private Business Investment (annual %)
6.6%                                                                                                                           4.0%    Source: ABS, JLL Research

6.4%                                                                                                                           3.5%

6.2%
                                                                                                                               3.0%    In terms of the medium and long-term outlook for the macro        We see the recovery in wage growth as an important driver
6.0%                                                                                                                                   retail environment, the ingredients are there for a recovery in   of a recovery in retail spending growth. While the growth in
                                                                                                                               2.5%    retail spending. Private sector wage growth has been subdued      the number of people employed (+403,000 people in 2017) is
                                                                                                                                       for some time now (1.9% p.a. as at December 2017), but some       certainly supportive of retail spending, a broad-based recovery
5.8%
                                                                                                                                       of the lead indicators of wage growth point to a recovery.        in wage growth impacts a much wider group of consumers –
                                                                                                                               2.0%
                                                                                                                                       Employment growth is strong, the unemployment rate has            the 12.4 million people in the Australian labour force.
5.6%                                                                                                                                   been trending down and business investment has begun to
                                                                                                                               1.5%    recover.                                                          In terms of the outlook for Australian economic growth, the
5.4%                                                                                                                                                                                                     RBA forecasts above-trend GDP growth of 3.25% p.a. in 2018
                                                                                                                                       Employment growth accelerated in 2017 and grew at 3.3%            and 2019. The recovery is expected to be driven by non-mining
                                                                                                                               1.0%
5.2%                                                                                                                                   p.a. in December 2017, more than double the 10-year annual        business investment, tight labour market conditions and an
                                                                                                                                       average of 1.6%. The unemployment rate has been trending          accommodative interest rate environment. While there are
5.0%                                                                                                                           0.5%    down since 2014 to 5.5%, as at December 2017. Business            some risks to the outlook for retail turnover growth, the overall
                                                                                                                                       investment is typically a precursor to employment, which          macro-economic backdrop is supportive of a recovery.
                                                                                                                                       will begin to absorb some of the spare capacity in the labour
4.8%                                                                                                                         0.0%
                                                                                                                                       market, and is likely to stimulate a rebound in wage growth in
   Dec-2013                      Dec-2014                      Dec-2015                  Dec-2016                     Dec-2017         the short to medium-term.

                             Unemployment rate [LHS]                       Employment growth [RHS]

Source: ABS, JLL Research

22 I JLL                                                                                                                                                                                                                      Shopping Centre Investment Review & Outlook 2018 I 23
Figure 15: Wage growth (private sector)

      5.0%

      4.5%

      4.0%

      3.5%

      3.0%
p.a

      2.5%

      2.0%

      1.5%
                                                                                                                   “ The Reserve Bank of Australia is
      1.0%
                                                                                                                   confident that the domestic economy
      0.5%
                                                                                                                   is heading back towards trend growth
      0.0%                                                                                                         in 2018 (3.0%) with an acceleration
             1999      2001    2003        2005   2007   2009   2011        2013         2015        2017
                                                                                                                   in GDP growth to 3.25% in 2019.
Source: ABS, JLL Research
                                                                                                                   A return to trend growth will be
                                                                                                                   accompanied by a tightening in
                                                                                                                   monetary policy and an increase in
                                                                                                                   standard variable mortgage rates.
                                                                                                                   While an increase in mortgage rates
                                                                Chatswood Chase, NSW (49%)                         will negatively impact disposable
                                                                Sold as part of the Vicinity Centres / GIC asset   income, only 34.5% of Australian
                                                                swap for $562.3 million
                                                                                                                   households have a mortgage with the
                                                                                                                   balance of households owning a house
                                                                                                                   outright (31.0%) or renting (30.9%).”

                                                                                                                   Andrew
                                                                                                                   Ballantyne
                                                                                                                   Head of Research, Australia

24 I JLL                                                                                                                       Shopping Centre Investment Review & Outlook 2018 I 25
Re-leasing spreads                                                                                                                 Figure 17: Implied re-leasing spread (specialty stores)

                                                                                                                                                                                                             1.7%
                                                                                                                                                                                                1.5%
– Likely to turn negative, but still delivers growth                                                                                                                                     0.8%

Our view is that re-leasing spreads for specialty stores will be   the last few years. The difference is likely reflective of                                                                                             - 0.5%
                                                                                                                                     - 0.6%
under pressure in 2018 (-0.5%) as a result of the downward         the upgrade in REIT portfolio quality through the sale of
trend in retail sales growth, and will remain negative to 2020     non-core assets, the acquisition of better quality assets
(-3.5%). Total retail turnover growth for specialty stores was     and the impact of development programs and/or asset                                                                                                                   - 2.2%
approximately 3.0% p.a. as at December 2017, compared              enhancement and tenant mix initiatives. Our estimates
with annual passing rent increases of approximately 3.2%           for re-leasing spreads are based on a very mild recovery                                                                                                                             - 3.5%
p.a. at present (CPI+1.25%). However, net income growth for        in specialty retail turnover growth from 3.0% p.a. as at                                                   - 4.0%
                                                                                                                                                          - 4.4%
specialty stores is likely to remain positive at 2.5% in 2018,     December 2017 to 3.5% p.a. in 2020, although remaining
2.2% in 2019 and 1.9% in 2020 (factoring in annual rent            below the 10-year average of 3.7% p.a.
increases and re-leasing spreads for expiring leases).
                                                                   Occupancy cost ratios broadly stabilised in the last few
It is important to note that a negative re-leasing spread of       years. A reset in rents will be necessary to avoid upward                                       - 7.3%
                                                                                                                                                 - 7.5%
-3.5% at lease expiry in 2020 still implies cumulative rent        pressure on occupancy cost ratios. We believe that retailers
growth of 13.5% over five years, which equates to 2.6% p.a.        will continue to seek more sustainable occupancy cost
                                                                   ratios at lease expiry, given cash flow pressures in terms of     2010        2011     2012     2013       2014      2015    2016         2017         2018           2019          2020
The re-leasing spreads reported by A-REITs have generally          competition-led discounting, slowing sales growth and a
outperformed our implied re-leasing spread model in                rising cost base.                                               Source: JLL Research

  Methodology: The implied re-leasing spread is the difference between the cumulative growth in retail turnover growth
  per square metre and the cumulative growth in rents at expiry of a 5-year lease.

  ABS Retail Trade figures were adopted excluding spending in the major tenant categories of supermarkets and
  department stores to accurately reflect sales for specialty tenants. JLL total stock and supply estimates (for regional,
  sub-regional and neighbourhood shopping centres) were used to assess the retail sales growth on a per square metre
  basis – an assumption was made for the specialty retail floorspace component of the additional supply. Rent escalations                                                                              112 Castlereagh Street Sydney, NSW
  were calculated as CPI+1.25% p.a. based on a standard 5-year lease. We assumed CPI rises to 2.25% by 2020, but
  remains closer to the lower end of the RBA target range.                                                                                                                                             Transacted by JLL on behalf of a Private Investor to a
                                                                                                                                                                                                       Private Investor for approximately $59.0 million

 Figure 16: Annual net income growth (specialty stores)

3.50%

3.00%

2.50%

2.00%

1.50%

1.00%

0.50%

0.00%
               2014              2015              2016            2017            2018             2019             2020

                              Annual Increases (CPI+1.25%)                     Net income (including reversions)

Source: JLL Research

26 I JLL                                                                                                                                                                                                       Shopping Centre Investment Review & Outlook 2018 I 27
Home Hub Castle Hill, NSW
Transacted by JLL with co-agent on behalf of
LaSalle to Aventus Property Retail Fund for
$336.0 million and formed part of the LaSalle Large
Format Portfolio sale of $436.0 million

                                                      Tweed Hub, NSW
Home Hub Marsden Park, NSW                            Transacted by JLL on behalf of Aventus Retail
Transacted by JLL with co-agent on behalf of          Property Fund to MPG Funds Management for
LaSalle to Aventus Property Retail Fund for           $40.1 million and formed part of the Aventus
$100.0 million and formed part of the LaSalle         Large Format & Convenience Retail Portfolio sale
Large Format Portfolio sale of $436.0 million         of $60.1 million

     28 I JLL                                            Shopping Centre Investment Review & Outlook 2018 I 29
Amazon
and the e-commerce trend

Amazon’s launch in Australia was widely anticipated and              Physical retail space will remain critical in the customer
well-documented throughout 2017. It was certainly the major          purchase and decision-making process. We believe that
focal point of the year for the retail industry and retail real      physical retail has a strong role to play in the new retail
estate sector. Retailer sentiment was negatively impacted            environment as retailers gradually adjust their business models
during the year by speculation about the potential impact on         to adapt. There are a number of tactics which landlords are
existing retail businesses. Amazon’s local operation will create     using to combat the impact of online retailing, including:
competition for retailers in a range of segments, and is likely to
depress price growth and compress profit margins.                    •   Increase the floorspace dedicated to Food and
                                                                         Beverage (F&B), grocery and non-retail uses – the
Amazon’s initial launch into Australia was arguably over-                strong consumer trend towards dining out supports the
hyped, based on the limited range offered and less significant           need for revitalised and expanded dining precincts in
discounting than consumers and the retail industry were                  shopping centres.
expecting. However, the implications of Amazon’s medium and
                                                                     •   Offer entertainment, experiences and events – the
                                                                                                                                        “ Owners are concentrating
long-term impact on retailers should not be underestimated.
The impact may just be more of a gradual accumulation
                                                                         social aspect of retail has become more important as           on upgrading shopping centre
                                                                         millennials seek a different shopping experience than
of market share rather than an initial surge as some were
                                                                         previous generations.                                          environments to improve customer
anticipating.
                                                                     •   Introduce new cutting-edge retailers and online                experience and drive foot traffic
Over the next five years, Amazon could take approximately
0.5% p.a. from bricks and mortar retail turnover growth, in our
                                                                         retailers – in the United States, what were traditionally
                                                                         pure-play online retailers have now become a source of
                                                                                                                                        and sales productivity. Although a
view. Our main assumptions are:                                          leasing demand, such as Warby Parker and Bonobos, as           number of national retail chains
                                                                         they begin to build their physical presence to continue to
•   Total retail turnover in Australia grows at 3.5% p.a.;               expand and maintain their growth trajectory.                   have increased pressure on landlords
•   Amazon retail revenue in Australia reaches $10.5 billion         •   Refurb and redevelop centres to remain competitive             with respect to lease negotiations,
    within five years – equal to 24% of the online retail market;        – redevelopment has become crucial given the growing
    and                                                                  competition, not just with competing shopping centres          occupancy rates have held up
•   Online retail spending growth accelerates to account for
                                                                         but with e-commerce as well.                                   relatively well. Landlords will
    11.5% of total retail turnover in Australia (from 7.7% as at
    November 2017).
                                                                     •   Explore mixed-use or change-of-use opportunities
                                                                         – many shopping centres are exploring opportunities            continue to invest in projects which
                                                                         to extract value from their sites by potentially adding        utilise the latest technologies and
                                                                         residential, commercial or hotels to utilise surplus land or
                                                                         air space above centres.                                       adapt centres to evolving consumer
                                                                                                                                        trends. Investors are increasingly
                                                                                                                                        utilising our market leading
                                                                                                                                        sustainability services in order to meet
                                                                                                                                        requirements and reduce the impact of
                                                                                                                                        rising electricity costs.”

                                                                                                                                        Tony Doherty
                                                                                                                                        Head of Retail Property & Asset
                                                                                                                                        Management, Australia

30 I JLL                                                                                                                                            Shopping Centre Investment Review & Outlook 2018 I 31
Quantifying the benefit
of tenant mix changes in sub-regional shopping centres
The sub-regional shopping centre tenant mix is changing. We      F&B increased from 13% of specialty floorspace in 2009 to           In a low-growth environment, and in a retail sub-sector where         Our key assumptions are:
estimate that further changes in the tenant mix towards Food     17% in 2017 (or 4 percentage points). Retail Services also          the leasing and retail sales risks are to the downside, the
Catering (F&B) and Retail Services can generate approximately    went up by 4 percentage points over the same period to 14%.         shifting tenant mix primarily reduces risk to some extent, in our     •   F&B and Retail Services continue to grow as a proportion
0.6% p.a. rental income growth in addition to organic market     The biggest contractions were in Homewares and Leisure              view. While F&B is still discretionary spending and subject to            of floorspace, and Apparel, General Retail and Leisure
rental growth.                                                   which each declined (as a share of specialty floorspace) by 3       cyclicality, we see it as less at-risk than Apparel, which is more        contract as a proportion of floorspace – shown in the
                                                                 percentage points.                                                  of a long-term challenge for sub-regional centres. In addition,           chart (Figure 18).
Furthermore, sub-regional specialty rents grew by                                                                                    changing the tenant mix also provides some upside potential           •   Specialty rents for all categories to grow at 2.1% p.a. (JLL
approximately 27% between 2009 and 2017 (or 3.0% p.a.) on        So, can re-mixing offset a structural slowdown in rental growth?    for rental growth.                                                        forecast) except F&B, which grows at 3.2% p.a.
a weighted average basis (Urbis). Approximately 4 percentage
points (or 0.3% p.a.) of the 27% growth can be directly          Three scenarios (overleaf) estimate the potential impact            The third scenario looks purely at the impact of changing the         •   F&B rents are assumed to outperform other categories
attributed to the change in the tenant mix.                      of tenant mix re-weighting on sub-regional specialty store          tenant mix while assuming rents remain the same as 2017                   based on the consumer trend to dining out and the
                                                                 rental growth over the next eight years, based on the previous      levels. It shows that the specialty rent uplift would be only             outperformance of retail turnover growth in this category
Figure 18 shows the increase in the proportion of sub-regional   eight years. Subsequently, changes in the tenant mix, shown         3.8% in total. Given the higher fit-out contributions (capex)             historically (5.5% p.a. 10-year average vs Total Retail at
floorspace towards higher-rent paying categories of Food         in Figure 18, could boost growth by 5.6 percentage points           required for F&B tenants, compared with other use types such              3.6% p.a.).
Catering (i.e. F&B outlets) and Retail Services between 2009     (from 19.9% to 25.5% cumulatively), between 2017 and                as Apparel or Homewares, it suggests that the benefits of re-         •   No adjustment has been made for the greater capital
and 2017. For example, F&B rents are approximately 48%           2025. Therefore, a 0.6% p.a. rental growth premium could be         mixing are more of a long-term play.                                      expenditure required to fit out an F&B tenancy (incentive)
higher than Apparel rents and 30% higher than General Retail.    generated across a typical sub-regional centre from 2.3% p.a.                                                                                 compared with other use types.
Rents for Retail Services are approximately 26% higher than      to 2.9% p.a., to be more in line with the historical rate of 3.0%
Leisure retailers and 50% higher than Homewares tenants. The     p.a., by extrapolating the trend in the changing tenant mix.
motivation for the change in the use type is therefore clear.
                                                                                                                                      Figure 19: Specialty rent relativity – sub-regional centres

                                                                                                                                             200
                                                                                                                                             180

 Figure 18: Proportion of specialty floorspace by use type                                                                                   160
                                                                                                                                             140
                                                                                                                                             120

                                                                                                                                     Index
                Food catering                                                                                                                100
(take-away, cafes, restaurants)           13%                                   17%                                          25%
                                                                                                                                             80
                Retail Services          10%                                  14%                                     17%                    60
                Phone/Mobile        3%                                3%                                   3%                                40
                                                                                                                                             20
                       Apparel                           33%                                32%                               27%
                                                                                                                                              0
                      Jewelry       4%                                4%                                    4%                                     Jewellery   Phone/     Food Catering      Retail        Food         General         Leisure         Apparel       Homewares
                                                                                                                                                               Mobile      (take away,      Services      (fresh)        Retail
                                                                                                                                                                        cafes, restaurants)
                General Retail           12%                                 11%                               7%                    Source: Urbis, JLL Research

                  Homewares              8%                            5%                                   4%

                         Food            10%                               9%                                    9%                   Figure 20: Rental growth impact from tenant re-mixing – sub-regional centres

                       Leisure           9%                             6%                                  4%                                                                                                                            Increase in specialty rent
                                                                                                                                      Scenario
                                                                                                                                                                                                                                          Total                   Per annum
                                                                                                                                      Historical change 2009-2017                                                                        26.9%                        3.0%
                                                                                                                                      Change in tenant mix with rental growth 2017-2025                                                   25.5%                       2.9%
                                                                                                                                      No change in tenant mix, with rental growth 2017-2025                                               19.9%                       2.3%
Source: Urbis, JLL Research                                                                                                           Change in tenant mix, static rents (immediate change – development scenario)                        3.8%                         n.a.

                                                                                                                                     Source: JLL Research

32 I JLL                                                                                                                                                                                                                          Shopping Centre Investment Review & Outlook 2018 I 33
Department storс                                                                                                                             Long lease terms clearly provide some buffer for landlords in
                                                                                                                                             the case of controlled rationalisation, but in the event of further
                                                                                                                                             deterioration in trading conditions and if one department store
                                                                                                                                             chain were to close, there would be some vacancy risk for
- Revising business strategies                                                                                                               landlords. The competitive landscape for department stores
                                                                                                                                             could change substantially in 2018 given the sales trajectory,
                                                                                                                                             with the potential for new or revised business strategies and the
Department stores (including discount department stores)              to reverse the structural decline of the sector via a number of        potential for a business sale or takeover.
have faced structural headwinds at a global level for some            strategies:
time, especially in the United States where department store
closures have been significant in the last few years. In Australia,   1) Improve the product range and merchandise to make it
department store closures have been much more resilient                  more appealing to customers and millennials in particular;           Figure 23: Store count of major department stores
to-date, with only limited impact from store closures and space
                                                                      2) Improve the in-store environment by investing in store               70
handbacks. Myer announced a further three store closures in
                                                                         refurbishments;
September 2017, while the other groups have been less actively                                                                                65
shrinking their store numbers. Nevertheless, we are becoming          3) Improve the customer service experience; and
                                                                                                                                              60
                                                                      4) Grow online distribution channels.
                                                                                                                                              55
 Figure 21: Department store share of total retail sales              The optimal scenario for owners is if these revised business            50
                                                                      strategies begin to gain traction and improve sales and
                                                                      profitability. The realistic scenario is that store network             45
14%                                                                   rationalisation and space handbacks will continue to occur in           40
                                                                      the least profitable locations as leases expire. The downside risk
12%                                                                   scenario is if there is consolidation in the sector or if one of the    35
                                                                      five department store chains (Myer, David Jones, Kmart, Target          30
10%                                                                   or Big W) were to close or go into voluntary administration.
                                                                                                                                              25

 8%                                                                                                                                           20
                                                                       Figure 22: Department store retail sales index                                                                 Myer                                                   David Jones

 6%
                                                                                                                                                       FY13          FY14             FY15               FY16             FY17          FY18*             FY19*                 FY20*
                                                                      200
 4%                                                                                                                                          * Estimate
                                                                      180                                                                    Source: Company Reports, JLL Research
 2%                                                                   160
                                                                      140
 0%
                                                                      120                                                                     Figure 24: Store count of discount department stores
       1992      1997       2002       2007       2012       2017
                                                                      100
                                                                                                                                              350
                        Australia         US                           80
Source: ABS, United States Census Bureau, JLL Research                 60                                                                     300

                                                                       40                                                                     250
increasingly cautious around the outlook for department stores         20
in Australia and the potential impact it may have on landlords if                                                                             200
there were to be consolidation in this segment.                          0
                                                                             1992     1997       2002        2007       2012        2017      150
In the US, department stores now account for just 3.4% of
total retail sales (as at December 2017), compared with 5.9% in                              Australia          US                            100
Australia. Total department store sales in Australia have been
relatively stable since 2009, compared with a persistent decline         Source: ABS, United States Census Bureau, JLL Research
                                                                                                                                               50
in the US since 1997.
                                                                                                                                                0
Retail sales growth for department stores in Australia has            Kmart is likely to continue to expand its store network via store                              Big W                                          Kmart                            Target (inc. Target County)
remained subdued despite revised business strategies and              conversions and new store commitments. David Jones has pre-
management restructures. Kmart has been the exception,                committed to three new stores, but expansion is likely to be fairly
having grown sales and market share substantially in the last         limited beyond those commitments. Myer and Target are likely                                           FY11       FY12         FY13          FY14          FY15     FY16          FY17
few years and continuing to expand their store network (Figure        to continue to rationalise their store networks, with potential for
                                                                                                                                             Source: Company Reports, JLL Research
24). Department stores are generally trying to work out how           some contraction from Big W as well, as leases expire.

34 I JLL                                                                                                                                                                                                                                   Shopping Centre Investment Review & Outlook 2018 I 35
Outlook
Sydney and Melbourne retail markets will continue to benefit         well in terms of fundamentals but tight yields in the sub-          “ A range of buyer groups will be acquisitive this year, with
from strong economic conditions. Sydney’s infrastructure             sector will restrict some institutional players from acquiring.
boom has flowed through to multiple sectors of the economy                                                                               offshore and unlisted wholesale funds being the key driver
and business conditions remain positive. In Melbourne,               Retail market fundamentals are expected to be relatively
strong population growth will be a key driver underpinning           stable in 2018. The macroeconomic backdrop will be                  of demand for major assets. Australia continues to be a key
retail spending growth and demand for retail space. While            supportive of retail spending growth with the economy
                                                                     forecast to strengthen and wage growth set to recover. We
                                                                                                                                         investment destination in the Asia Pacific region for core
slightly more opportunistic, Brisbane presents an opportunity
to capitalise on a decade-wide house price spread between            expect shopping centre occupancy rates to remain resilient          and core-plus capital. Liquidity in the sector remains high
Sydney and Brisbane, which will fuel further interstate              in 2018. However, the leasing market will continue to be
migration and a recovery in retail spending growth over the          somewhat challenging as landlords take the opportunity to           but investor selection criteria has tightened. Transaction
medium term. Conditions in the Perth retail market are likely        replace underperforming retailers and bring in new retailers
                                                                     to evolve the tenant mix to reflect new consumer preferences.
                                                                                                                                         activity is likely to be strong in 2018, and above the long-term
to begin to recover, but from a relatively low base. The swing
factor for Perth will be the level of supply which is in the                                                                             average, but may not be as strong as previous years. Owners
pipeline as centres are potentially expanded. Adelaide will          Owners will look to more actively manage their portfolios,
continue to be a relatively stable market but the above-trend        as well as their assets, in order to outperform in this evolving    of retail assets will take a more active approach to portfolio
retail spending growth is likely to moderate.                        retail environment. In addition to exploring mixed-use
                                                                     opportunities and intensive retail asset management to
                                                                                                                                         management moving forward in terms of transactions and
While retail market conditions vary within each sub-sector,          extract value, a number of risk mitigation strategies are           development in order to reduce risk and ensure exposure to
CBD retail is poised to outperform – particularly in Sydney and      likely to be employed. Some include; diversifying portfolio
Melbourne. Infrastructure upgrades, residential supply, robust       exposure by retail sub-sector and state, reducing exposure          strong or stable assets. ”
international tourism growth and strong CBD employment               to non-core/underperforming assets and re-investing capital

                                                                                                                                         Simon Rooney
will be supportive of CBD retail market fundamentals. Super-         into assets which can deliver growth. Reducing exposure
regional shopping centres will continue to attract customers         to large single assets will also provide opportunities for
and retailers in the competitive retail environment, while sub-      capital redeployment either into accretive development or
regional centres will continue to refine the tenant mix to remain    acquisition opportunities. The key strategy for acquisitions in
competitive. Neighbourhood centres will continue to perform          2018 will be careful asset selection.
                                                                                                                                         Head of Retail Investments, Australasia
 Key Retail Drivers

                            Population growth
                            (10yr forecast p.a.)    1.3%              Globally, second highest for an advanced economy

                            Business investment
                            (p.a. as at Dec-17)     7.4%              A precursor to wage growth

                            Labour market growth
                            (p.a. as at Feb-18)     3.5%              Double the 10-year average

                            Wages
                            (3yr forecast p.a.)     2.6%              Recovery from 2.1% p.a. avg 3-yrs to 2017

                            Tourist arrivals
                            (3yr forecast p.a.)     6.6%              Remains a supportive driver

                                                                 Source: JLL Research, ABS,Deloitte Access Economics, Oxford Economics

36 I JLL                                                                                                                                                                             Shopping Centre Investment Review & Outlook 2018 I 37
Authors

                                                                   Simon                                                               Andrew
                                                                   Rooney                                                              Quillfeldt
                                                                   International Director                                              Director
                                                                   Head of Retail Investments                                          Strategic Research
                                                                   Australasia                                                         Australia
                                                                   +61 2 9220 8497                                                     +61 2 9220 8728
                                                                   simon.rooney@ap.jll.com                                             andrew.quillfeldt@ap.jll.com

                                                                   Simon has worked with JLL for over twenty years and leads a         Andrew is responsible for JLL’s retail research across
                                                                   specialist team that focuses on major retail acquisitions and       Australia. His primary responsibilities include: analysis of key
                                                                   disposals across Australia. Simon is the recognised market          trends and drivers of the retail sector, reporting on market
                                                                   leader in this field, having transacted over AUD 15 billion since   performance and providing strategic advice to the national
                                                                   2012 with a national market share of over 75% for agency            Retail Investments and Management teams. He also has an
                                                                   negotiated transactions over AUD 100 million.                       active role in the Real Estate Intelligence Service (JLL’s research
                                                                                                                                       subscription service) and has contributed to a wide range of
                                                                                                                                       research publications on behalf of the firm. Andrew has ten
                                                                                                                                       years’ experience with JLL and holds a degree in Property
                                                                                                                                       Economics from the University of Technology, Sydney.

                                                                   Contributors

                                                                   Lara                               Jamс                             Fiona                                Annabelle
                                                                   Britton                            Sherley                          Ellender                             Atkins
                                                                   Associate Director                 Associate Director               Analyst                              Senior Analyst
                                                                   Retail Investments                 Retail Investments               Retail Investments                   Research
                                                                   Australia                          Australia                        Australia                            Australia
                                                                   +61 2 9220 8678                    +61 2 9220 8425                  +61 2 9220 5919                      +61 2 9220 8610
                                                                   lara.britton@ap.jll.com            james.sherley@ap.jll.com         fiona.ellender@ap.jll.com            annabelle.atkins@ap.jll.com

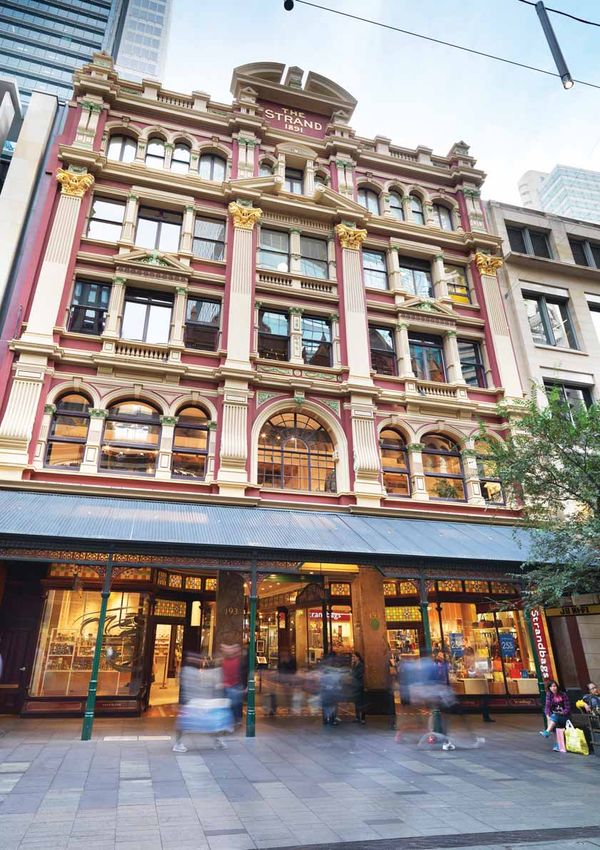
           The Strand Arcade, NSW (50%)
           Sold as part of the Vicinity Centres / GIC asset swap
           for $111.7 million

38 I JLL                                                                                                                                                    Shopping Centre Investment Review & Outlook 2018 I 39
2017 Retail Transactions (Over $20 million)                                                                                                                                                                                                           2017 Retail Transactions (Over $20 million)
                                                                              Sale Price     Indicative       Indicative      GLA                                                                                                                                                                                                Sale Price     Indicative       Indicative      GLA
 Property name                             Suburb           State    Date       (AUD)       Initial Yield    Initial Yield   (SQM)     Price/sqm Vendor                                                Buyer                                           Property name                         Suburb             State    Date      (AUD)       Initial Yield    Initial Yield   (SQM)    Price/sqm Vendor                                              Buyer
                                                                                              (Passing)     (Fully Leased)                                                                                                                                                                                                                       (Passing)     (Fully Leased)
CBD                                                                                                                                                                                                                                                   Mango Hill Market Place2               Mango Hill         QLD     Oct-17   $61,000,000      5.55%           5.55%         7,851     $7,770   Horizon Capital Management                          ISPT Retail Australia Property Trust (IRAPT)
                                                                                                                                                                                                       DEXUS Property Group/Dexus Wholesale           Albany Creek Square                    Albany Creek       QLD     Nov-17   $55,880,000      6.96%              -          10,068    $5,550   Charter Hall Retail REIT (CQR)                      Fortius Funds Management
MLC Centre (50%)   1
                                           Sydney           NSW     Jun-17   $722,500,000      4.30%           4.70%         77,720     $18,592   QIC Global Real Estate
                                                                                                                                                                                                       Property Fund (DWPF)
                                                                                                                                                                                                                                                      Bluewater Square                       Redcliffe          QLD     Sep-17   $55,250,000      7.07%           7.72%         10,004    $5,523   Alceon Group/CP Retail                              Elanor Investors Group
Queen Victoria Building (50%) (P)2         Sydney           NSW     Nov-17   $301,200,000      5.25%           5.25%         13,668     $44,074   GIC                                                  Vicinity Centres
                                                                                                                                                                                                                                                      Benowa Village                         Benowa             QLD     Oct-17   $49,500,000      5.08%           5.08%         6,318     $7,835   Coles Group Property Developments                   Private Investor
The Galeries (50%) (P)2                    Sydney           NSW     Nov-17   $143,100,000      5.00%           5.00%         14,849     $19,274   GIC                                                  Vicinity Centres
                                                                                                                                                                                                                                                      Arena Shopping Centre                  Officer            VIC     Jun-17   $48,100,000      5.42%           5.42%         8,141     $5,908   Parklea Developments                                Private Investor
The Strand Arcade (50%) (P)   2
                                           Sydney           NSW     Nov-17   $111,700,000      4.75%           4.75%          5,797     $38,537   GIC                                                  Vicinity Centres
                                                                                                                                                                                                                                                      Worongary Town Centre                  Worongary          QLD     Jun-17   $46,300,000      6.26%           6.26%         7,097     $6,524   AHC                                                 SCA Property Group
112 Castlereagh Street, Sydney1            Sydney           NSW     Jun-17   $59,000,000       3.76%           3.76%          1,561     $37,808   Private Investor (Karen Beck)                        Private Investor
                                                                                                                                                                                                                                                      Woodcroft Village                      Woodcroft          NSW     Sep-17   $43,850,000      5.46%           5.81%         4,652     $9,426   The Trust Company (Australia)                       Private Investor
Country Road Building1                     Brisbane         QLD     Nov-17   $53,950,000       5.72%           6.22%          3,529     $15,288   Abacus Property Group                                Deutsche Bank
                                                                                                                                                                                                                                                      The Station Oxley                      Oxley              QLD     Feb-17   $43,500,000      6.50%           6.68%         7,093     $6,133   Folkestone                                          Savills Investment Management
Buckley's Bar, Opera Quays                 Sydney           NSW     Aug-17   $21,500,000       4.10%           4.10%          408       $52,696   Kazal Family                                         Well Glory Investment
                                                                                                                                                                                                                                                      Peregian Springs Shopping Centre       Sunshine Coast     QLD     Aug-17   $41,500,000      5.35%           5.40%         4,772     $8,697   Alceon Group                                        Private Investor
Regional
                                                                                                                                                                                                                                                      Entrada Centre                         North Parramatta   NSW     Aug-17   $41,325,000      5.79%           5.79%         5,570     $7,419   Centennial Property Group                           Cook Property Group
                                                                                                                                                                                                       AMP Capital Shopping Centre Fund (ASCF)/
Indooroopilly Shopping Centre (50%)  2,3
                                           Indooroopilly    QLD     Nov-17   $800,000,000      4.25%           4.25%         116,447    $13,740   Commonwealth Superannuation Corporation (CSC)                                                                                                                                                                                                                                                        Charter Hall Retail Management Limited
                                                                                                                                                                                                       AMP Capital Diversified Property Fund (ADPF)   Highfields Village Shopping Centre     Highfields         QLD     Jul-17   $41,000,000     6.00%            6.00%         7,928     $5,172   Lauder
                                                                                                                                                                                                                                                                                                                                                                                                                                                       (CHRML)
                                                                                                                                                                                                       GPT Wholesale Shopping Centre Fund
Highpoint Shopping Centre (25%)            Maribyrnong      VIC     Jul-17   $660,000,000         -            4.21%         149,576    $17,650   Highpoint Shopping Centre (Besen Family)                                                            Illawong Village                       Illawong           NSW     Sep-17   $40,000,000         -            6.30%         6,471     $6,181   Private Investor                                    Private Investor
                                                                                                                                                                                                       (GWSCF)
                                                                                                                                                                                                                                                      Centrepoint Tamworth                   Tamworth           NSW     Jan-17   $38,500,000     7.55%            7.76%         9,173     $4,197   Private Investor                                    Intergen Property Group
Chatswood Chase (49%) (P)2                 Chatswood        NSW     Nov-17   $562,300,000      4.75%           4.75%         63,715     $18,011   Vicinity Centres                                     GIC
                                                                                                                                                                                                                                                      Clifton Village Shopping Centre        Clifton Beach      QLD     Nov-17   $36,000,000     6.50%               -          7,900     $4,557   Arkadia                                             Indigenous Business Australia (IBA)
Sub-regional
                                                                                                                                                                                                                                                      Mudgeeraba Market Shopping Centre
Rockingham Shopping Centre (50%)           Rockingham       WA      Nov-17   $305,000,000         -               -          61,610     $9,901    Vicinity Retail Partnership (VRP)                    AMP Capital Shopping Centre Fund (ASCF)                                               Mudgeeraba         QLD     Apr-17   $35,800,000     6.31%            6.31%         6,093     $5,876   Property Syndicate                                  SCA Property Group
                                                                                                                                                                                                                                                      and Franklin Square
Kawana Shoppingworld (50%)2                Buddina          QLD     Dec-17   $186,000,000      5.50%           5.50%         38,401     $9,687    Mirvac Group                                         ISPT
                                                                                                                                                                                                                                                      Park Village Shopping Centre           Middle Park        QLD     Apr-17   $35,200,000     5.81%            6.48%         6,441     $5,465   Undisclosed (Reciever and Manager - Lucas & Co.)    Private Investor
Salamander Bay Centre2                     Salamander Bay   NSW     May-17   $174,500,000      6.00%           6.00%         24,000     $7,271    Vicinity Retail Partnership (VRP)                    Charter Hall Retail REIT (CQR)
                                                                                                                                                                                                                                                      Torquay Village                        Torquay            VIC     Dec-17   $35,000,000     5.89%               -          6,780     $5,162   Coles Group Property Developments                   Private Investor
Marketown Shopping Centre                  Newcastle West   NSW     Jul-17   $163,250,000      5.37%           6.26%         26,011     $6,276    Private Investor (Cartier Holdings)                  AMP Capital (Sun Super)
                                                                                                                                                                                                                                                      Northcote Central                      Northcote          VIC     Nov-17   $34,000,000     3.47%            3.91%         6,657     $5,107   Private Investor                                    Private Investor
Toormina Gardens                           Toormina         NSW     Dec-17   $83,300,000       6.70%           6.95%         21,200     $3,929    Vicinity Centres/Challenger                          Fort Street Real Estate Capital Fund III
                                                                                                                                                                                                                                                      Highpoint Plaza                        Ashgrove           QLD     Jun-17   $33,500,000     7.47%            7.47%         5,079     $6,596   Trident                                             Aviator Capital
Wodonga Plaza                              Wodonga          VIC     Jun-17   $43,500,000       8.50%              -          17,560     $2,477    Vicinity Centres                                     M Group
                                                                                                                                                                                                                                                                                             Raymond
Mowbray Marketplace and Target Centre      Mowbray          TAS     Aug-17   $38,550,000       7.22%           7.52%         12,052     $3,199    Highbrand                                            Real Asset Management Group (RAM)              Terrace Central Shopping Centre                           NSW     Jun-17   $33,500,000     6.55%            6.96%         7,236     $4,630   Vicinity Centres                                    Panthera Property Group
                                                                                                                                                                                                                                                                                             Terrace
Muswellbrook Marketplace                   Muswellbrook     NSW     May-17   $34,250,000       6.87%           8.38%         12,836     $2,668    Lederer Group                                        Muswellbrook Shire Council                                                                                                                                                                                                                      Private Investor (Chin Yuan International
                                                                                                                                                                                                                                                      Eli Waters Shopping Centre             Eli Waters         QLD     May-17   $33,180,000     6.25%            6.44%         6,334     $5,238   Karmah Developments (Greg Karedis)
Hastings Central Shopping Centre           Hastings         VIC     Apr-17   $32,100,000       5.97%           6.08%          8,015     $4,005    Payton Capital                                       Henkell Bros                                                                                                                                                                                                                                    Enterprise)

Port Pirie Plaza Shopping Centre           Port Pirie        SA     Sep-17   $32,050,000       7.88%           7.88%         11,027     $2,907    Private Investor                                     Primewest                                      Big W and Woolworths Shopping Centre   Gawler              SA     Jul-17   $32,050,000     6.87%            6.87%         11,071    $2,895   Gawler Property Holdings                            Harmony Property Syndication
Renmark Square                             Renmark           SA     Nov-17   $24,700,000       8.42%              -          12,024     $2,054    Charter Hall Retail REIT (CQR)                       Revelop Building and Development               Gladstone Square Shopping Centre       Gladstone          QLD     Jun-17   $31,500,000     7.50%            7.50%         6,897     $4,567   Charter Hall Retail REIT (CQR)                      Elanor Retail PropertyFund (ERF)
Wharflands Plaza                           Port Augusta      SA     Jul-17   $21,000,000       8.74%           8.74%         10,215     $2,056    Charter Hall Retail REIT (CQR)                       Private Investor                               Lakeside Square Shopping Centre        Pakenham           VIC     Jul-17   $30,380,000     6.29%            6.35%         6,270     $4,845   Private Investor                                    Private Investor
Neighbourhood                                                                                                                                                                                                                                         Market Plaza                           Chipping Norton    NSW     Jun-17   $30,350,000     5.52%            5.63%         4,358     $6,965   Private Investor                                    Private Investor
East Village (50.1%)                       Zetland          NSW     Aug-17   $155,300,000         -               -          32,778     $9,457    PAYCE Consolidated (PAYCE)                           Mirvac Group                                   Lisarow Plaza                          Lisarow            NSW     Jan-17   $29,100,000     6.10%            6.10%         5,248     $5,545   Private Investor                                    Primewest

                                                                                                                                                                                                       QIC Global Real Estate (QIC Australian Core    Lane Cove Central                      Lane Cove          NSW     Dec-17   $29,000,000     5.34%            5.34%         3,696     $7,846   Private Investor                                    Private Investor
Pittwater Place3                           Mona Vale        NSW     Oct-17   $98,000,000       5.35%           5.65%         11,890     $8,242    Deutsche Asset Management
                                                                                                                                                                                                       Plus Fund)                                     Casuarina Village Shopping Centre      Casuarina          NSW     Aug-17   $27,400,000     5.83%            5.86%         3,979     $6,886   CVS Lane Capital Partners                           Whistle Funds Management
MarketPlace Warner                         Warner           QLD     Sep-17   $78,350,000       5.18%           5.70%         11,477     $6,827    Warner Village                                       AMP Capital (Swiss Pillar Investments AG)      Moranbah Fair Shopping Centre          Moranbah           QLD     Sep-17   $25,000,000     8.83%               -          7,054     $3,544   Charter Hall Retail REIT (CQR)                      Elanor Investment Nominees
Bathurst City Centre2                      Bathurst         NSW     Dec-17   $71,150,000       6.50%           6.50%         12,560     $5,665    Vicinity Enhanced Retail Fund (VERF)                 QIC Global Real Estate (QARP)                                                                                                                                                               ISPT (75%)/Coles Group Property Developments
                                                                                                                                                                                                                                                      Sugarworld Shopping Centre             Edmonton           QLD     Oct-17   $24,750,000     5.57%            6.76%         4,758     $5,202                                                       SCA Property Group
Stockland Corrimal                         Corrimal         NSW     Oct-17   $69,250,000       7.28%           7.51%          9,692     $7,145    Stockland                                            Lederer Group                                                                                                                                                                               (25%)

Chester Square                             Chester Hill     NSW     Sep-17   $68,500,000       3.78%           3.78%          8,270     $8,283    Keystar                                              Private Investor                               Springfield Fair                       Springfield        QLD     Dec-17   $23,500,000     7.05%            7.05%         5,132     $4,579   Charter Hall Retail REIT (CQR)                      RAM Australia Retail Property Fund

40 I JLL                                                                                                                                                                                     Shopping Centre Investment Review & Outlook 2018 I 40    41 I JLL                                                                                                                                                                               Shopping Centre Investment Review & Outlook 2018 I 41
You can also read