AUTOMATED LAND COVER CHANGE DETECTION AND FOREST SUCCESSION MONITORING USING LIDAR POINT CLOUDS AND GIS ANALYSES - MDPI
←
→
Page content transcription
If your browser does not render page correctly, please read the page content below
geosciences
Article
Automated Land Cover Change Detection and Forest
Succession Monitoring Using LiDAR Point Clouds
and GIS Analyses
Marta Szostak
 Department of Forest Resources Management, Faculty of Forestry, University of Agriculture in Krakow,
 al. 29 listopada 46, 31-425 Kraków, Poland; m.szostak@ur.krakow.pl; Tel.: +48-126625076

 Received: 30 June 2020; Accepted: 10 August 2020; Published: 17 August 2020

 Abstract: This paper investigates the possibility of applying light detection and ranging (LiDAR) point
 clouds and geographic information system (GIS) analyses for land use and land cover (LULC) change
 detection, mainly with a view to monitoring uncontrolled forest succession occurring on postagricultural
 lands. The research was conducted in a part of the administrative district of Milicz (in the central-west
 area of Poland). The areas of interest were parcels in which agricultural use has been abandoned
 and forest succession processes have progressed. The airborne laser scanning (ALS) data (acquired
 in 2007, 2012, and 2015) revealed detailed changes in land cover as a result of the progression in the
 forest succession process. Using the ALS data, the LULC changes and the progress of secondary forest
 succession are shown, and the vegetation parameters (LiDAR metrics) are presented.

 Keywords: airborne laser scanning; LiDAR metrics; secondary forest succession; land abandonment;
 LULC changes

1. Introduction
     The introduction of light detection and ranging (LiDAR) technology in environmental management
has enabled ground and vegetation cover models such as the digital surface model (DSM) and the
normalized DSM (nDSM) to represent the relative height of trees and shrubs from the ground surface.
These are in addition to ground topography models such as the digital terrain model (DTM).
     Airborne laser scanning (ALS), a type of LiDAR, collects 2D and 3D information useful for the
identification of the spatial characteristics of vegetation [1–8] and the assessment of forest succession
areas, according to the National Program for Increasing Forest Cover. It is also highly important in
conducting inventories and monitoring of noncontrolled forest succession areas to assess vegetation
biomass [9], ensure human safety, and protect the environment; for example, monitoring fire hazards
to prevent fire spreading to forest complexes or protected areas.
     The succession of communities of forest plants on postagricultural ground is common.
This phenomenon occurs at a global scale of tens of millions of hectares. Secondary forest succession
is currently underway at a significant scale, and is being enhanced by intensifying economic and
demographic processes. Land abandonment and land exclusion from agricultural production is
influenced by many factors, both natural (for example, the distance to forest complexes) and non-natural
(mainly the structure of agricultural plots and changes in the demographics of rural residents, often due
to migration to cities) [10–15]. Land excluded from agricultural production is subject to secondary
succession, which affects land still used for agriculture or adjacent forested areas. Monitoring of
land use/land cover (LULC) changes is also important in terms of global programs, including land
management and the granting of direct subsidies to agriculture. The European Commission accepted
new rules in 2018 that, for the first time, permitted the application of remote sensing technologies in the

Geosciences 2020, 10, 321; doi:10.3390/geosciences10080321                  www.mdpi.com/journal/geosciences
Geosciences 2020, 10, 321                                                                              2 of 19

control of subsidies for farms and agricultural holdings. As a positive effect, it should be noted that the
secondary forest succession process makes an essential contribution to biodiversity monitoring [16].
     Automation in the monitoring of the biocenosis formation process and forest succession mapping
is the main aspect of the application of modern geoinformatics methods, and obtaining objective
information on the ambient environment requires the use of spatial data derived from photogrammetry
and remote sensing. As researchers [17] have stated, there is a perceived need to create a methodology
for the monitoring of vegetation succession by airborne remote sensing, both from quantitative (area,
volume) and qualitative (plant species) perspectives. Currently available data and techniques, such as
LiDAR data processing, can be used to study the secondary succession process. Using these techniques,
information about the spatial extent and the height of research objects—i.e., trees and shrubs—can be
obtained [18]. Generating the spatial characteristics of vegetation in an automated way undoubtedly
provides new possibilities in modeling the structure of vegetation, including defining biometric features
and biomass, which determines the developmental stage of trees and shrubs forming the succession
process. Information about the spatial structure of vegetation provides a base for studies of biodiversity,
or spatial analyses that require up-to-date and precise information about land cover classes. Remote
sensing technologies, particularly processing of LIDAR point clouds, provide precise information
about the forest succession processes, and significantly speed up the detection and assessment of
land cover change [19–22] and can contribute to the development of studies on the distribution, scale,
and dynamics of the biomass. The increasing availability of remote sensing data creates significant
possibilities for the automation of detecting LULC changes and spatial analyses for complex monitoring
of the development of forest vegetation. Airborne laser scanning technology has great potential for
conducting large-scale studies of the range and spatial structure of vegetation in the monitoring of
forest succession areas.
     In this research, parcels situated close to state forests were chosen for LULC change analyses
and forest succession monitoring. In these areas, which are directly adjacent to forests, examples of
agricultural production abandonment and the beginning of uncontrolled forest succession are often
observed. The aim of the presented research was to define the usage of LiDAR point clouds for
automated mapping of secondary forest succession areas. The general aim of this work is to demonstrate
the potential for automation in forest succession detection and monitoring on abandoned agricultural
lands using LiDAR technology and GIS (geographic information system) analyses. ALS point clouds
were used for collecting information (metrics) about vegetation, principally to obtain precise information
about the height of vegetation and the canopy cover. The study provides an example of the use of
multiyear airborne laser scanning acquisition to monitor the return to shrubland/forest of abandoned
agricultural fields.

2. Materials and Methods
     The study area is in the central-west of Poland (51◦ 280 30” N, 17◦ 120 30” E; Figure 1a), in the Milicz
District (Lower Silesia Voivodeship), and comprises land parcels in which agricultural production
transitions to uncontrolled forest succession [23,24]. The study area includes 68 plots (Figure 1b)
with a total area of 68.57 ha. The analyzed parcels are situated in close proximity to the State Forests
(administered by the State Forests National Forest Holding) and are not listed in the ground cadaster
as forests (F) or wooded areas (W), but as arable lands (A), meadows (M), or pastures (P) in which
forest succession starts. Built-up areas (B) were excluded from the study.
     According to Polish law (Ministry of the Environment in Poland), forest is defined as ground
covered with forest vegetation, with an area greater than 0.1 ha. This includes forest ground temporarily
deprived of forest vegetation and ground related to forestry (forest roads, etc.). The State Forests
National Forest Holding administers around 78.4% of all Polish forests and oversees forests owned by
the State Treasury of Poland. Private forests constitute about 17.4% of Polish forests and the remaining
forested areas are national parks and other public and communal forested grounds. In Polish official
cadastral databases, forested grounds are classified as either forests or wooded areas.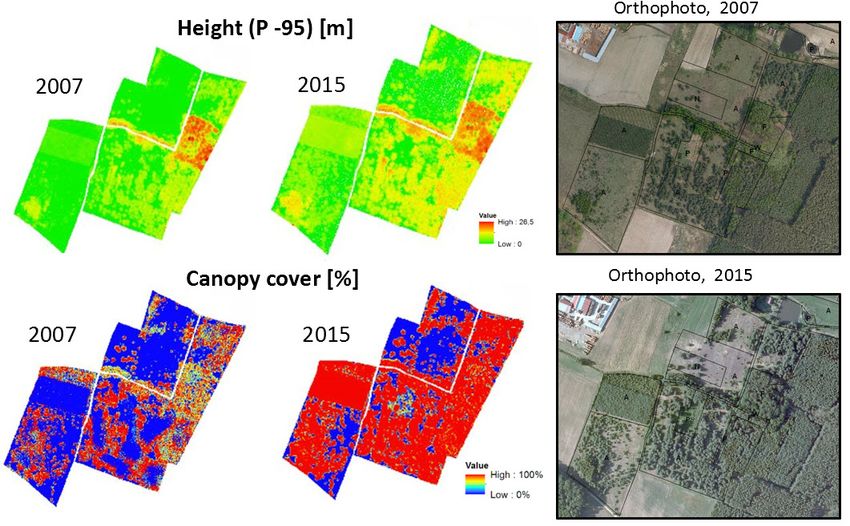
It is quite common in Poland that areas with secondary forest succession are not identified as
forested grounds in the cadastral databases. This is because land use inventories are made relatively
infrequently. Therefore, forest succession areas are frequently still classified as agricultural lands.
These parcels are usually directly adjacent to forests, where agricultural production has been
discontinued
Geosciences       and
            2020, 10, 321uncontrolled secondary forest succession has started.                    3 of 19

                  (a)
                                                                             (b)
                               (a) general
     Figure 1. The study area: (a) general map
                                           map of
                                               of Poland
                                                  Poland with
                                                         with study
                                                              study area
                                                                    area in
                                                                         in Milicz
                                                                            Milicz District;
                                                                                   District; (b)
                                                                                             (b) study
                                                                                                 study area:
                                                                                                       area:
     analyzed plots—marked red, plots of the State Forests—hatched area (background: orthophoto map
     2012; coordinates system: PL-1992).

      It is range
     The     quite of
                    common
                      the study in area
                                    Poland
                                         wasthat     areas with
                                                determined        secondary
                                                              by three         forest succession
                                                                        ALS campaigns                are and
                                                                                           (2007, 2012   not 2015).
                                                                                                              identified
                                                                                                                     The
as forested     grounds    in  the   cadastral    databases.
study was carried out based on the following materials:         This  is because   land   use   inventories   are  made
relatively infrequently. Therefore, forest succession areas are frequently still classified as agricultural
1. ALS
lands.       point
         These      clouds:
                 parcels  are usually directly adjacent to forests, where agricultural production has been
      •
discontinued 2007:and
                    General     Directorate
                       uncontrolled             of the
                                        secondary        State
                                                      forest    Forests has
                                                             succession   Poland   research project (14 points/m2,
                                                                              started.
             TopoSys
      The range         Falcon
                    of the  studyII scanner
                                     area was  [8,23,24]);
                                                   determined by three ALS campaigns (2007, 2012 and 2015).
      •
The study was carried out based on the Osłony
             2012: “Informatyczny       System             Kraju
                                                   following      (IT System for the Country’s Protection)”, ISOK
                                                               materials:
             project (6 points/m2, source: Main Office of Geodesy and Cartography, Poland);
1. •ALS 2015: point Remote
                    clouds: sensing-based assessment of woody biomass and carbon storage in forests
             (REMBIOFOR) project (10 points/m2, RIEGL LMS-Q680i laser scanning system [25–27]);
       •     2007: General       Directorate      of(coordinate
                                                     the State Forests                                                 2
2. Orthophoto         maps: 2007,     2012, 2015                 system: Poland
                                                                           PL-1992,research
                                                                                     GSD: 0.25  project
                                                                                                  m) (14 points/m ,
3. Cadastral TopoSys
                   data:Falcon   II scanner
                         2007, parcels    and[8,23,24]);
                                                land use; source: Geoportal and WebEWID portal for the Milicz
       •
      District (coordinate system: PL-1992).Osłony
             2012:   “Informatyczny       System               Kraju
                                                       Cadastral  data(IT  System
                                                                        were        forthe
                                                                              used as    theofficial
                                                                                              Country’s    Protection)”,
                                                                                                     information   about
             ISOK   project  (6 points/m   2 , source: Main Office of Geodesy and Cartography, Poland);
      LULC classes for the analyzed area.
       •     2015: Remote sensing-based assessment of woody biomass and carbon storage in forests
      Airborne laser point cloud processing was             carried out in FUSION Version 3.50 (RJ McGaughey,
             (REMBIOFOR) project (10 points/m2 , RIEGL LMS-Q680i laser scanning system [25–27]);
Pacific Northwest Research Station [28]. The first step was to generate the DTM and the DSM using
2.     Orthophoto maps: 2007,
the “GridSurfaceCreate”               2012, 2015 (coordinate
                                and “CanopyModel”                 system:
                                                           functions        PL-1992,[29].
                                                                       in FUSION      GSD:   0.25
                                                                                           The     m) (nDMS = DSM
                                                                                                 nDSM
3.
− DTM) Cadastral   data: 2007,
          was prepared      usingparcels
                                     “Mapand     land use;
                                            Algebra”       source:
                                                         and        Geoportal
                                                              “Raster            and functions
                                                                       Calculator”    WebEWID(ArcGIS,
                                                                                                   portal for the Milicz
                                                                                                            Esri).
       District  (coordinate   system:    PL-1992).    Cadastral  data  were  used  as the  official
      Forest succession areas in the study were defined as abandoned farmland areas with detected    information   about
       LULC    classes  for the  analyzed     area.
woody vegetation. To be in line with previous studies [23,24] and to capture the initial stages of
succession, we used the nDSM threshold for succession area determination. The forest succession
     Airborne laser point cloud processing was carried out in FUSION Version 3.50 (RJ McGaughey,
area (2D spatial range and occupied area in parcels) was determined by the reclassification of the
Pacific Northwest Research Station [28]. The first step was to generate the DTM and the DSM using
nDSM (“Reclassify” function in ArcGIS) using a threshold >1.0 m for the pixel value, which represents
the “GridSurfaceCreate” and “CanopyModel” functions in FUSION [29]. The nDSM (nDMS = DSM −
the height of vegetation above the ground. Previous studies [23,24,30–32] found that classifying
DTM) was prepared using “Map Algebra” and “Raster Calculator” functions (ArcGIS, Esri).
nDSM using the threshold of the height of vegetation >1.0 m (parameters nDSM >1.0 m, >2.0 m, and
     Forest succession areas in the study were defined as abandoned farmland areas with detected
woody vegetation. To be in line with previous studies [23,24] and to capture the initial stages of
succession, we used the nDSM threshold for succession area determination. The forest succession area
(2D spatial range and occupied area in parcels) was determined by the reclassification of the nDSM
(“Reclassify” function in ArcGIS) using a threshold >1.0 m for the pixel value, which represents the
height of vegetation above the ground. Previous studies [23,24,30–32] found that classifying nDSM
using the threshold of the height of vegetation >1.0 m (parameters nDSM >1.0 m, >2.0 m, and >3.0 m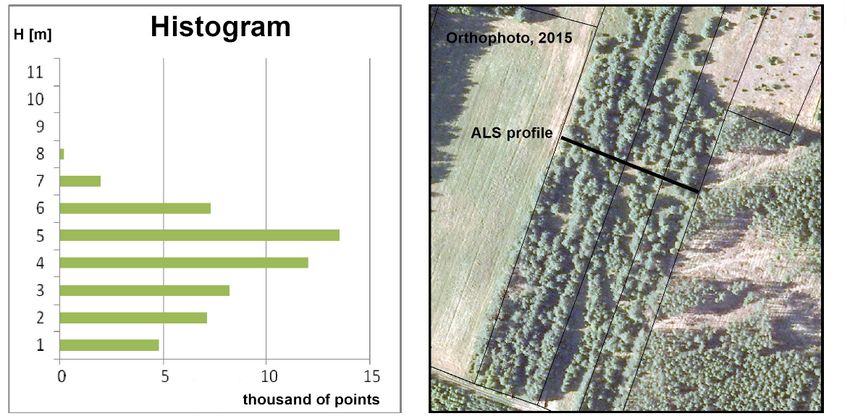
three periods: 2007, 2012, and 2015. This allowed for the analysis of LULC changes and the occurrence
of succession processes in the studied area. Specifically, it allowed for detailed analysis of areas of
progressive forestry succession or vegetation removal. To prepare an inventory of areas of forest
succession (nDSM > 1.0 m), both in terms of individual parcels and as the sum of the whole study
area, the2020,
Geosciences “Zonal Statistics as Table” function (ArcGIS, ESRI) was applied. The scheme for the4 of
10, 321 GIS
19
analyses [23,24] of individual plots according to land use is presented in Figure 2. In this study, the
“ModelBuilder” application (ArcGIS, Esri) was used to create, edit, and manage the model of nDSM
were tested)These
processing. produced resultswere
workflows similar
used to to
those
stringderived from
together the photointerpretation
sequences of geoprocessingand on-screen
tools, feeding
vectorization of orthophoto maps or from
the output of one tool into another tool as an input. geographic object-based image analysis (GEOBIA).
In this study,
Airborne laserthe reclassification
scanning results
point clouds wereforused
the nDSM >1.0
to obtain m were prepared
information about the and compiled
structure of for
the
three periods: 2007, 2012, and 2015. This allowed for the analysis of LULC
vegetation: height of vegetation and standard deviation (SD) of height (“GridMetrics” and changes and the occurrence
of succession processes
“CloudMetrics” in theinstudied
functions FUSION area.software),
Specifically, it allowed
canopy coverfor detailed
(“Cover”)analysis of areas of
and histograms
progressive forestry[28].
(“DensityMetrics”) succession or vegetation
The height of vegetationremoval. To prepareasan
was calculated theinventory of areasofofrelative
95th percentile forest
succession (nDSM > 1.0 m), both in terms of individual parcels and as the sum
altitude in the ALS point cloud (95% of the whole population of the analyzed ALS points were below of the whole study
area, the “Zonal
this height) Statisticscover
[5]. Canopy as Table” functionas(ArcGIS,
was defined a range ofESRI) was applied.
0%–100% Thepenetration
laser beam scheme for through
the GIS
analyses
the branches[23,24] of individual
to the ground. Forplots
eachaccording
pixel (sizetodefined
land useby is
thepresented
operator, in Figure
e.g., 2. the
1.0 m), In this
numberstudy,
of
the “ModelBuilder” application (ArcGIS, Esri) was used to create, edit, and manage
first echoes was counted in relation to all the registered echoes inside the analyzed cell of the raster. the model of
nDSM
Views andprocessing.
profiles These
from ALSworkflows were used
point clouds were to string together
obtained sequences of
using FugroViewer geoprocessing tools,
software.
feeding the output of one tool into another tool as an input.
Figure 2. Scheme for the analyses (normalized digital surface model (nDSM) > 1.0 m) of individual
Figure
plots 2. Scheme
according for the
to land use.analyses (normalized digital surface model (nDSM) > 1.0 m) of individual
plots according to land use [23,24].
Airborne laser scanning point clouds were used to obtain information about the structure
3. Results
of the vegetation: height of vegetation and standard deviation (SD) of height (“GridMetrics”
and “CloudMetrics” functions
Regarding the results of theinALS
FUSION software),
point clouds canopyfor
processing cover (“Cover”)area
the analyzed and[23,24,30–32],
histograms
(“DensityMetrics”)
nDSM values for the[28]. yearsThe height
2007, 2012,ofand
vegetation
2015 arewas calculated
presented as the3.95th
in Figure percentile
The figure of the
shows relative
area
altitude in the ALS point cloud (95% of the whole population of the analyzed ALS
of secondary forest succession over the analyzed period 2007–2015. Normalized models (nDSM) points were below
this height)
derived for [5].
yearsCanopy cover
2007 and 2015was defined as aorthophoto
(background: range of 0%–100%
map andlaser beamdata)
cadastral penetration through
for a part of the
the
studybranches to the ground.
area, chosen For each of
as an example pixel (size defined
increasing forestbysuccession
the operator, e.g., 1.0
(spatial m), the
range andnumber
height ofof
first echoes was
vegetation) counted ininrelation
are presented to all the registered echoes inside the analyzed cell of the raster.
Figure 4.
Views and profiles from ALS point clouds were obtained using FugroViewer software.
3. Results
Regarding the results of the ALS point clouds processing for the analyzed area [23,24,30–32],
nDSM values for the years 2007, 2012, and 2015 are presented in Figure 3. The figure shows the area of
secondary forest succession over the analyzed period 2007–2015. Normalized models (nDSM) derived
for years 2007 and 2015 (background: orthophoto map and cadastral data) for a part of the study
area, chosen as an example of increasing forest succession (spatial range and height of vegetation) are
presented in Figure 4.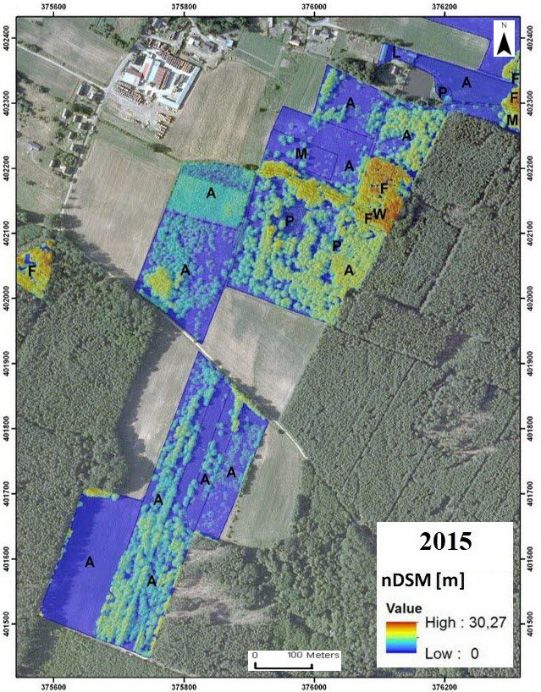
Geosciences 2020, 10, 321                                                                                       5 of 19
Geosciences 2020, 10, x FOR PEER REVIEW                                                                         5 of 19

                                                         (a)

                                                         (b)

                                                         (c)
             Figure
     Figure 3.       3. The graphic
                The graphic           results
                             results of        of airborne
                                        airborne            laser scanning
                                                   laser scanning          (ALS)
                                                                   (ALS) point    point
                                                                               cloud    cloud processing—
                                                                                     processing—nDSM:   (a) 2007;
     (b) 2012;nDSM:   (a) 2007; (b) 2012; (c) 2015.
               (c) 2015.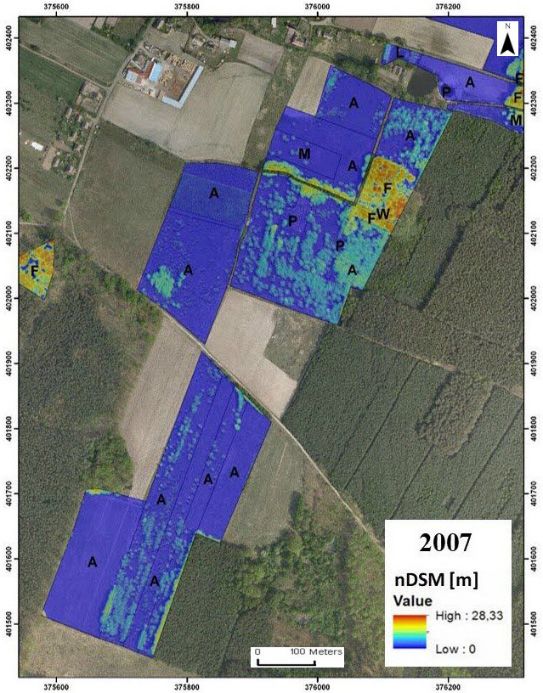
Geosciences 2020, 10, x FOR PEER REVIEW                                                                      6 of 19
Geosciences 2020, 10, 321                                                                                    6 of 19
Geosciences 2020, 10, x FOR PEER REVIEW                                                                      6 of 19

                                (a)                                              (b)
                               (a)area (nDSM) as an example of forest succession
     Figure 4. Part of the study                                             (b) area: (a) 2007; (b) 2015.
     Background:
     Figure    Partorthophoto
            4. Part of         map
                    of the study     and
                                  area   cadastral
                                       (nDSM)      data.
                                               as an                                     (a) 2007;
                                                     example of forest succession area: (a)  2007; (b)
                                                                                                    (b) 2015.
                                                                                                        2015.
     Background: orthophoto map and cadastral data.
     The graphical results of reclassification nDSM (height > 1.0 m; for the analyzed area in 2007, 2012
and The
     2015graphical
     The    [23,24,30–32],
           graphical results
                     resultsare
                              ofpresented
                              of             in Figure
                                 reclassification
                                 reclassification  nDSM
                                                   nDSM     We can>> observe
                                                        5.(height
                                                           (height   1.0    fora the
                                                                         m; for
                                                                     1.0 m;      general
                                                                                 the       increase
                                                                                      analyzed
                                                                                     analyzed   area in
                                                                                                area  in the
                                                                                                      in     spatial
                                                                                                          2007,
                                                                                                          2007, 2012
                                                                                                                2012
range
and    of
and 2015  forest succession
     2015 [23,24,30–32],
            [23,24,30–32], areareas. Removal
                            are presented
                                 presented in   of vegetation
                                             in Figure
                                                Figure 5.
                                                       5. We   has
                                                            We can also  occurred,
                                                               can observe           for
                                                                    observe aa general   example
                                                                                 general increase in
                                                                                           increase insome
                                                                                                    in the   parcels
                                                                                                         the spatial
                                                                                                             spatial
in the
range  western
       of forest part of  the
                 succession   analyzed
                              areas.     area.
                                     Removal    of vegetation  has also  occurred,  for  example  in
range of forest succession areas. Removal of vegetation has also occurred, for example in some parcelssome   parcels
in
in the
   the western
       western part
                 part of
                      of the
                         the analyzed
                              analyzed area.
                                         area.

                                                        (a)
                                                  Figure(a)
                                                         5. Cont.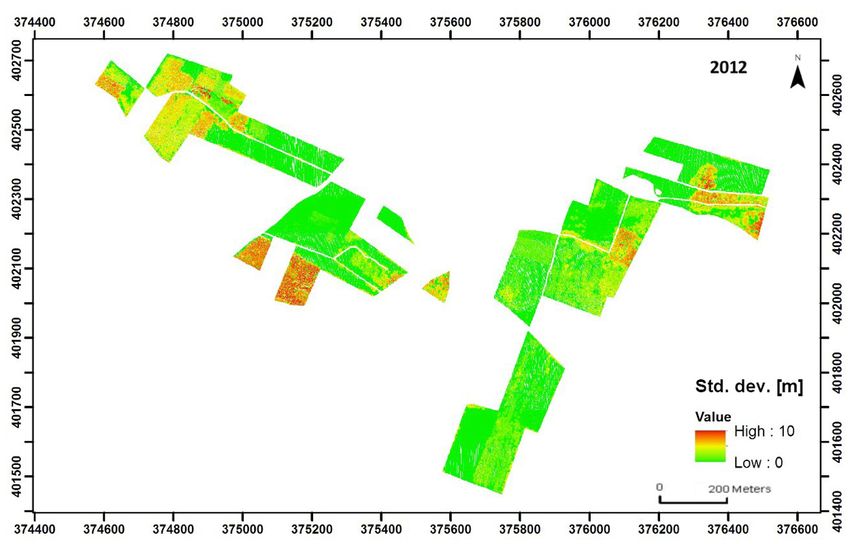
Geosciences
Geosciences 2020,
            2020, 10, x321
                        FOR PEER REVIEW                                                                          77 of
                                                                                                                    of 19
                                                                                                                       19

                                                          (b)

                                                          (c)
     Figure
     Figure 5.
             5. The
                 Thegraphic
                     graphicresults
                             resultsof
                                    ofALS
                                       ALSpoint
                                          pointcloud
                                                cloudprocessing—reclassification (nDSM > 1.0
                                                     processing—reclassification (nDSM   1.0 m):
                                                                                             m): (a)
                                                                                                  (a)2007;
                                                                                                      2007;
     (b) 2012; (c) 2015.

     Detailed information
     Detailed   information about
                               aboutland
                                       landuse
                                            useininthe study
                                                     the      area—cadastral
                                                          study  area—cadastral   data andand
                                                                                     data    the the
                                                                                                 results   of ALS
                                                                                                     results        data
                                                                                                                of ALS
processing
data         (reclassification
      processing                 of nDSM
                    (reclassification       > 1.0 m)
                                        of nDSM     > for
                                                       1.0 2007, 2012,
                                                            m) for  2007,and2012,
                                                                              2015 and
                                                                                    [23,24,30–32]—are        presented
                                                                                          2015 [23,24,30–32]—are
in Table 1.inInTable
presented        the analyzed    area, 32 plots
                      1. In the analyzed         with
                                           area, 32     a total
                                                     plots  witharea  of area
                                                                 a total  40.92ofha  comprise
                                                                                   40.92         a secondary
                                                                                         ha comprise              forest
                                                                                                          a secondary
succession   area.  For  these  parcels, we  can  observe    an increase   in the  spatial  range   of
forest succession area. For these parcels, we can observe an increase in the spatial range of forested forested    from
2007–2015.
from         The value
      2007–2015.          of the
                   The value   ofnDSM    >1.0>1.0
                                  the nDSM     m inm2007    waswas
                                                      in 2007   19.84  ha (48.5%
                                                                    19.84  ha (48.5%of the  research
                                                                                        of the researcharea),  21.14
                                                                                                           area),     ha
                                                                                                                  21.14
(51.7%)
ha      in 2012,
   (51.7%)        andand
            in 2012,   23.87  ha (58.3%)
                           23.87          in 2015.
                                  ha (58.3%)        According
                                              in 2015.          to the
                                                        According    to official cadastral
                                                                        the official         datadata
                                                                                      cadastral   (2007),   in this
                                                                                                        (2007),  in area
                                                                                                                    this
area forests and wooded areas occupied a total of 5.73 ha (14.0%), which is over three times smaller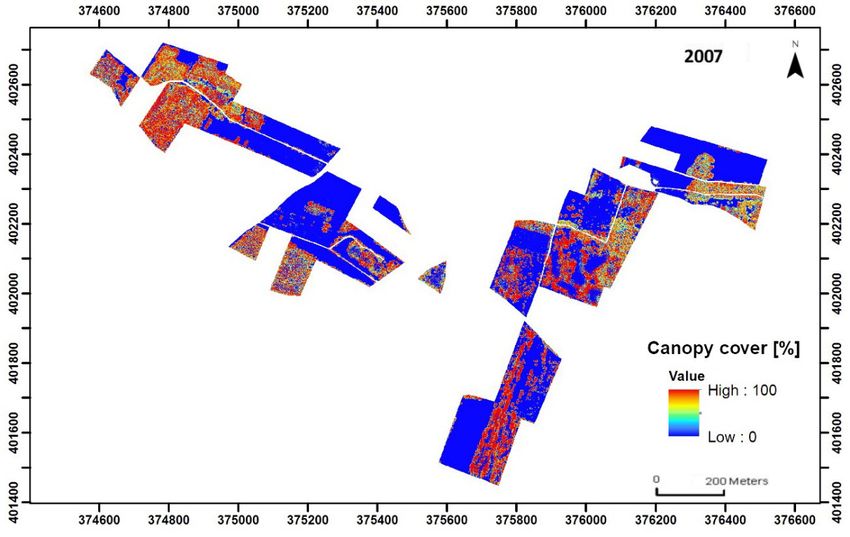
Geosciences 2020, 10, 321                                                                                     8 of 19

forests and wooded areas occupied a total of 5.73 ha (14.0%), which is over three times smaller than the
forested area identified using ALS data. Thus, the secondary forest succession area was 14.11 ha in
2007, and more in the next years.

      Table 1. Land use classes—area received based on ALS data (2007, 2012, 2015) processing, and differences
      from 2007–2012 and 2012–2015.

                                                 Land Use—Area [ha]
                                                   Percentage [%]
                            Cadaster         ALS          ALS         ALS            ALS            ALS
       LULC Classes
                              2007           2007         2012        2015        2007–2012       2012–2015
                               5.73          19.84       21.14        23.87          1.30            2.73
       Forested areas
                              14.00          48.5        51.7         58.3           3.2             6.6
                              27.53          16.91       14.91        13.51         −2.00           −1.40
        Arable lands
                              67.28          41.3        36.4         33.0          −4.9            −3.4
                              4.14           2.45         2.64        2.23           0.20           −0.41
          Pastures
                              10.12          6.0           6.5         5.5            0.5           −1.0
                               2.05           1.3         1.28        0.96          −0.02           −0.32
          Meadows
                               5.01           3.2          3.1         2.3           0.0            −0.8
                               1.45          0.42         0.93        0.35           0.52           −0.58
           Others
                               3.54           1.0          2.3        0.83            1.3           −1.4
             Total                                            40.92 ha/100%

     The results of analysis based on the processed ALS point clouds show an increase in the forested
areas for the period from 2007–2015 of 4.03 ha (9.8%). On the other hand, we can observe a decrease
during this time in the following classes: arable lands −3.40 ha (−8.3%), meadows −0.34 ha (−0.9%),
and pastures −0.22 ha (−0.5%). These results show an overall increase in the total forest succession area.
Some parts are no longer used agriculturally (land abandonment) and have become forested areas.
     The spatial range and the structure of vegetation in the forest succession areas were calculated
automatically using ALS point cloud statistics [30–32]. The mean values of height (95th percentile)
and canopy cover for forest succession areas are presented in Table 2. Detailed information about the
changes in the structure of vegetation for the analyzed areas shows a total increase in height of 3.06 m
and in canopy cover of 15.8% for period of 2007–2015. Figure 6 shows graphical results (raster plots) of
ALS data processing (point clouds from 2007, 2012, and 2015) with regards to the height of vegetation
(95th percentile).

                            Table 2. Vegetation parameters in the forest succession area.

                                       Mean Values                               Differences
          Parameter
                               2007       2012        2015        2012–2007       2015–2012       2015–2007
         Height [m]           11.91       12.20       14.97          0.29            2.77            3.06
      Canopy Cover [%]         39.5        40.6        55.3          1.1             14.7            15.8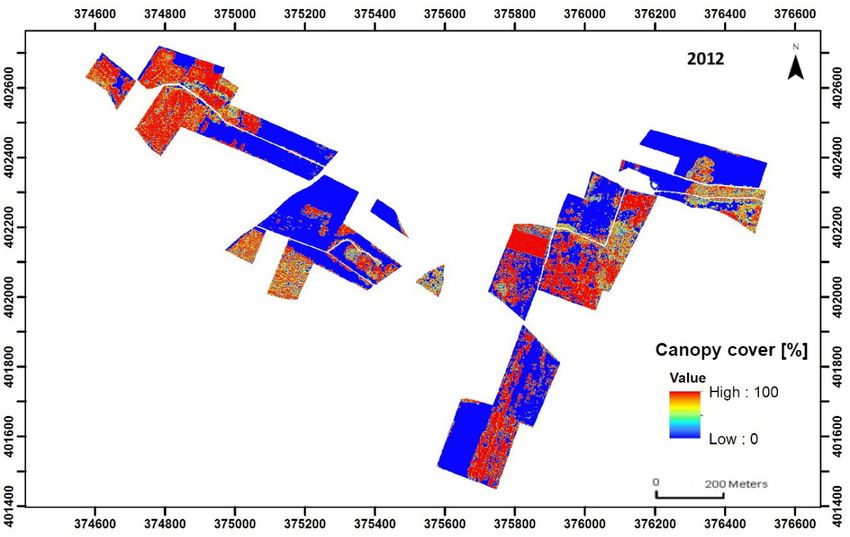
Geosciences 2020, 10, x FOR PEER REVIEW                     9 of 19
Geosciences 2020, 10, 321                                   9 of 19

                                                (a)

                                                (b)
                                          Figure 6. Cont.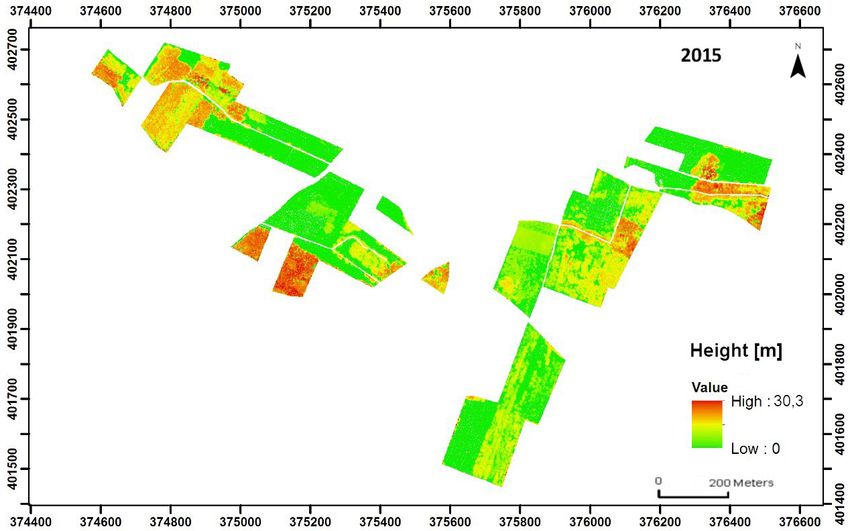
Geosciences 2020, 10, x FOR PEER REVIEW                                                                    10 of 19
Geosciences 2020,
Geosciences 2020, 10,
                  10, 321
                      x FOR PEER REVIEW                                                                    10 of
                                                                                                           10 of 19
                                                                                                                 19

                                                       (c)
                                                       (c)
      Figure 6. Vegetation parameters—height of vegetation (95th percentile): (a) 2007; (b) 2012; (c) 2015.
      Figure 6. Vegetation parameters—height
                           parameters—height of
                                             of vegetation
                                                vegetation (95th
                                                            (95th percentile):
                                                                  percentile): (a)
                                                                               (a) 2007;
                                                                                   2007; (b)
                                                                                         (b) 2012;
                                                                                             2012; (c)
                                                                                                   (c) 2015.
                                                                                                       2015.
     Figure
      Figure 7 presents the
                         the standard deviation
                                         deviation (SD) ofof height. For     point clouds   2007, 2012,  and 2015
      Figure 77 presents
                presents the standard
                              standard deviation (SD)(SD) of height.
                                                              height. For
                                                                       For point
                                                                             point clouds
                                                                                   clouds 2007,
                                                                                             2007, 2012,
                                                                                                   2012, and
                                                                                                         and 2015
                                                                                                               2015
the
the standard
    standard    deviation
                deviation of
                          of  height
                              height showed
                                      showed   very
                                               very   similar
                                                      similar values;
                                                               values;  therefore,
                                                                        therefore,   Figure
                                                                                     Figure   7
                                                                                              7 presents
                                                                                                presents  the
                                                                                                          the  ALS
                                                                                                               ALS
the standard deviation of height showed very similar values; therefore, Figure 7 presents the ALS
2012
2012  data
      dataasasananexample.
                   example.The   standard
                               The  standarddeviation
                                               deviationwaswas
                                                            found    to betolowest
                                                                 found              in theinlightly
                                                                              be lowest             thinned
                                                                                              the lightly    stand
                                                                                                           thinned
2012 data  as  an example.  The  standard   deviation   was found    to be lowest   in the lightly  thinned   stand
area.
stand  The LiDAR
       area. The     metrics,
                  LiDAR        height,
                          metrics,      and and
                                    height,  SD SDof height
                                                      of     help
                                                         height helptotounderstand
                                                                          understand   how
                                                                                        how   LiDAR
                                                                                               LiDAR   technology
                                                                                                       technology
area. The LiDAR metrics, height, and SD of height help to understand how LiDAR technology
measures/collects
measures/collects   information about
                                  about forest landscapes
                                                 landscapes [28].
measures/collects information
                    information about forest
                                          forest landscapes[28].
                                                              [28].

                Figure 7.
                Figure    Vegetation parameters—standard
                       7. Vegetation parameters—standard deviation
                                                         deviation of
                                                                   of height
                                                                      height (SD,
                                                                             (SD, 2012
                                                                                  2012 data).
                                                                                       data).
                Figure 7. Vegetation parameters—standard deviation of height (SD, 2012 data).
     Figure 8 presents the canopy cover data. The increase in the spatial range and changes in the
structure of vegetation in the forest succession area for the analyzed period (2007–2015) can be observed.
Geosciences 2020, 10, x FOR PEER REVIEW 11 of 19
Figure 8 presents the canopy cover data. The increase in the spatial range and changes in the
structure of vegetation in the forest succession area for the analyzed period (2007–2015) can be
observed.2020, 10, 321
Geosciences 11 of 19
(a)
(b)
Figure 8. Cont.Geosciences 2020, 10, x FOR PEER REVIEW 12 of 19
Geosciences2020,
Geosciences 2020,10,
10,321
x FOR PEER REVIEW 12 of
12 of 19
19
(c)
(c)
Figure 8. Vegetation parameters—canopy cover: (a) 2007; (b) 2012; (c) 2015.
8. Vegetation
Figure 8.
Figure Vegetation parameters—canopy
parameters—canopycover:
cover: (a)
(a) 2007;
2007; (b)
(b) 2012;
2012; (c)
(c) 2015.
2015.
Figure 9 shows some parts of the analyzed forest succession area (orthophoto maps from 2007
Figure
Figure 99 shows
shows sometheparts
some
and 2015), specifically, parts of
of the
detailed the analyzed forest
analyzedof
parameters forest succession
succession
vegetation area
area (orthophoto
as height (orthophoto
and maps
maps from
canopy cover. from 2007
2007
and
and 2015),
2015), specifically,
specifically,the
thedetailed
detailedparameters
parametersofofvegetation
vegetationas asheight
heightand
andcanopy
canopycover.
cover.
Figure 9. Part of the analyzed forest succession area—height of vegetation and canopy cover.
Figure 9. Part of the analyzed forest succession area—height of vegetation and canopy cover.
Figure 9. Part of the
Figure 10 presents, analyzed
as an forest
example of succession
the forest area—height of vegetation
succession area, and canopy
a histogram cover.
(numbers of points)
Figuregenerated
and profile 10 presents,
fromas an
theexample of the
ALS point forest
clouds fromsuccession
2015, in area,
orderatohistogram (numbers
present precise of points)
information
and Figure 10
profile presents,from
generated as an example
the ALS of the
point forestfrom
clouds succession
2015, area,
in ordera histogram
to present (numbers
precise of points)
information
about the vegetation’s spatial characteristics.
and profile
about generated from
the vegetation’s spatialthecharacteristics.
ALS point clouds from 2015, in order to present precise information
about the vegetation’s spatial characteristics.Geosciences2020,
Geosciences 2020,10,
10,321
x FOR PEER REVIEW 13 of
13 of19
19
(a)
(b)
Figure 10. Precise
Figure 10. Precise information
information about
about vegetation:
vegetation: (a) histogram;
histogram; (b)
(b) profile
profile from
from ALS
ALS point
point clouds.
clouds.
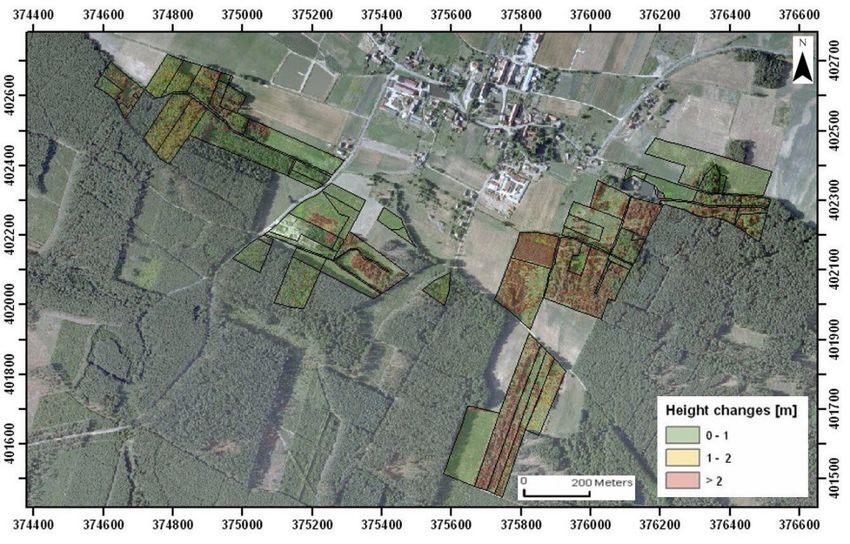
For
For the
the whole
whole analyzed
analyzed area,
area, aa map
map of
of height
height changes
changes (increase
(increase in
in height
height of
of vegetation)
vegetation) from
from
2007–2015 was prepared. In Figure 11 some parts of this map can be observed, as an illustration
2007–2015 was prepared. In Figure 11 some parts of this map can be observed, as an illustration of the
of
detailed information
the detailed that that
information can be
canobtained about
be obtained the forest
about succession
the forest process.
succession process.Geosciences 2020,
Geosciences 2020, 10,
10, 321
x FOR PEER REVIEW 14 of
14 of 19
19
(a)
(b)
Figure 11.
Figure 11. Height changes from 2007–2015: (a)
(a) whole
whole analyzed
analyzed area;
area; (b)
(b) example
example of chosen parts.
Background: orthophoto map and cadastral data (transparency
Background: (transparency in
in value:
value: 60%).
4. Discussion
4. Discussion
Automation
Automation inin the
the detection
detection and
and mapping
mapping ofof areas
areas of
of uncontrolled
uncontrolled forest
forest succession
succession is is vital
vital
because
because of the problem of discrepancies between the range of official cadastral LULC classes and and
of the problem of discrepancies between the range of official cadastral LULC classes real
real
landland
use. use. Cadastral
Cadastral databases
databases are outdated
are outdated and
and do notdoreflect
not reflect the of
the scale scale
theof the process
process of treeof tree
and and
shrub
invasion on land where agricultural use has stopped. Creating an inventory of LULC changes isGeosciences 2020, 10, 321 15 of 19
shrub invasion on land where agricultural use has stopped. Creating an inventory of LULC changes is
important in terms of the implementation of EU programs and can significantly improve the updating
of cadastral databases. Improvements in reliability and comparability, together with an increase in
efficiency, are an advantage of using automated procedures for monitoring areas of uncontrolled
secondary forest succession.
Previous studies [23,24] of mapping range in the forest succession process, based on the
reclassified nDSM (height thresholds of 1.0 m, 2.0 m, and 3.0 m), were compared with the results of
photointerpretation and the vectorization orthophoto map (ORTHO) and GEOBIA approach. For the
study area (40.92 ha), the results of ALS (2007) data processing (nDSM > 1.0 m, >2.0 m, >3.0 m) showed
the best result for nDSM > 1.0 m, with a difference in forested areas in the order of 0.79 ha (2.0%)
according to the results of the orthophoto map photointerpretation and vectorization (ALS–ORTHO),
and a difference of −0.54 ha (−1.3%) compared with the GEOBIA approach (ALS–GEOBIA). In another
study [31,32] in the same research area, ALS (2012) data processing using nDSM with a threshold
height >1.0 m also showed the best results (compared with thresholds > 2.0 m and >3.0 m) for
mapping secondary forest succession. ALS data processing compared to photointerpretation and
vectorization orthophoto maps showed a difference (ALS–ORTHO) of −1.42 ha (−3.5% of the analyzed
area). The method was also tested for a bigger area, parcels covering a total of 282.50 ha of the Milicz
District [30]. The study reported the best results in terms of using nDSM > 1.0 m compared with
orthophoto map photointerpretation and on-screen vectorization with a difference (ALS–OTRHO) of
1.61 ha (0.6% for the analyzed area). For the another analyzed area (139.77 ha) in Poland—Biskupice
village in Wieliczka District (Małopolska Voivodeship, [33])—the difference (ALS–OTRHO) was
−4.48 ha (−3.2%).
The possibility of applying Sentinel-2 satellite images for the automation of land use/land cover
change detection, mainly in the aspect of monitoring uncontrolled forest succession, has also been
investigated [34]. The results of the supervised classification of Sentinel-2 images were compared to
the results of the traditionally applied manual vectorization of aerial orthophoto maps. The difference
(Sentinel–ORTHO) in observed area covered by trees or shrubs was more than 3.8% of the analyzed area.
In another forest succession study area in Poland [35], in the village of Tukl˛ecz (Rytwiany
Commune, Staszów County, Świ˛etokrzyskie Voivodeship; study area of 137.17 ha), two ALS point data
sets were tested—one provided by the RZGW Krakow (airborne campaign in November 2009, density:
2 pts/m2 ) and the second from the ISOK project (November 2012, density: 4 pts/m2 ). Detection of
vegetation was carried out using different height thresholds. The results indicated that in each scenario
(variant for both point clouds and height thresholds of 1.0 m, 2.0 m, and 3.0 m), in the area of arable land
(R), over 70% of all secondary forest succession polygons were detected. These were not impressive
results, because of the leaf-off period and low density of the point clouds. Using leaf-off point clouds,
some of the information concerning deciduous vegetation can be lost, thus reducing the estimated
space occupied by succession.
The current study used dense point clouds acquired in 2007, 2012, and 2015 to show the possibility
of automation in monitoring secondary forest succession areas to determine progress not only of the
occupied area, but also of the growth of trees and shrubs. Other authors have stated that photogrammetry
and remote sensed methods [17,18], especially LiDAR point cloud processing [19–22], provide precise
information about forest succession areas. Kolecka [22] illustrated that vegetation height can potentially
be used to estimate agricultural land abandonment timing. During the initial succession stages,
the height of vegetation increases quite slowly and is more uniform. The development accelerates over
time as shrubs and trees encroach on annual plants and grasses, creating a composition of various plant
heights, sizes, and distributions. The method may be useful to estimate when agricultural land was
abandoned. Falkowski et al. [20] evaluated the use of LiDAR data for characterizing forest successional
stages. The authors used a variety of LiDAR-derived metrics, in conjunction with an algorithmic
modeling procedure, to classify six stages of three-dimensional forest development. The algorithmic
model developed ecologically meaningful classifications based upon LiDAR metrics quantifying meanGeosciences 2020, 10, 321 16 of 19
vegetation height and canopy cover, among others. This study highlights the utility of LiDAR data for
accurately classifying forest succession. LiDAR data have proven particularly useful for measuring or
estimating a suite of forest structural attributes, such as canopy height, basal area, and Leaf Area Index
(LAI). Osińska-Skotak et al. [17] stated that the time of remote sensing data acquisition influences the
possibility of differentiating succession species. Their remote sensing data included high-resolution
hyperspectral imagery and LiDAR data acquired simultaneously from a common aerial platform.
The semiautomated ALS point cloud processing method (based on nDSM reclassification)
presented in this study demonstrates the possibility of detecting forest succession and provides an
objective and relatively accurate assessment of the information about the total area of secondary forest
succession. The processing of point clouds to derive spatial (2D, 3D) characteristics of vegetation
gives precise information about the process of forest succession overgrowing abandoned areas.
It can be concluded that point cloud processing provides satisfactory results and could be used for
automation in the monitoring of secondary forest succession processes. Cyclic acquisition of LiDAR
data creates opportunities for the management and monitoring of changes taking place in abandoned
agricultural areas.
Regarding the possibilities of regular LiDAR campaigns for forest succession monitoring, the use
of alternative platforms, 3D laser point clouds derived from unmanned aerial vehicles (UAVs) might be
a cost-effective alternative [36]. Stereo matching (e.g., the structure from motion; SfM) of aerial or UAV
photographs [37–41] enables us to manage, monitor and provide information about forest succession
areas. A combination of acquisitions under leaf-off and leaf-on conditions has the potential to replace
expensive airborne surveys for applications requiring information on vegetation cover or vegetation
height [38]. As an alternative to ALS or highly sophisticated multi- and hyperspectral imaging systems,
low cost optical devices operated from UAVs or ultralight airplanes are also available. A precondition
for nDSM provision in this case is the availability of a precise DTM. For many areas, the terrain model
does not change for many years. Once obtained, e.g., from an ALS campaign, this data can be used
for many studies. The choice of systems, in general, depends on the specified task and the available
budget. However, ALS is presently considered the most precise solution in structure reconstruction.
The chief drawbacks are the high costs and the lack of spectral information.
According to the National Program for Increasing Forest Cover in Poland [42], forest cover in
2020 will account for 30% of the country’s area, and in 2050 this will reach 33%. According to the Main
Statistical Office information [43] the area of forest land in 2017 amounted 30.9% of the area of Poland,
and forest cover in 2017 was 29.6%. In this respect, it should be noted that the real forest cover of the
country has a higher value than that recorded in the Main Statistical Office data [44,45] and natural
forest succession is out of control. Forecasts for the growth of forest cover in Poland and afforestation
plans should take into account the phenomenon of secondary forest succession [46]. In this aspect,
it is also important to assess the breeding suitability of vegetation to shape forests on postagricultural
lands [47], as well as assessing the development and reconstruction of newly emerging forests and
how they will exist in the landscape [46].
5. Conclusions
Quantifying the forest structure is important for sustainable environment management, as it
relates to a wide variety of ecosystem processes and services. The main cause of arable land loss is land
being left to go fallow by hosts. Often, farmers’ behavior results in unprofitable land management in the
immediate vicinity of forests, and these areas are characterized by reduced productivity. The mapping
of land abandonment and forest successional dynamics is an important goal in order to gain information
about carbon storage in the forested areas.
The paper presents the possibility of comprehensively using LiDAR data for LULC change
monitoring, related to the process of secondary forest succession. This study showed a continuous
increase in the analyzed forest area caused by the succession of forest vegetation in agricultural areas.
Automation of the processes of detection and monitoring of uncontrolled forest succession was veryGeosciences 2020, 10, 321 17 of 19
important, because of the problem of discrepancies between the official cadastral databases and the
reality of the extent of areas classified as forested grounds. Using ALS gives satisfactory results for
automation in the monitoring of secondary forest succession processes. It can be concluded that
automated LiDAR point cloud processing can be used to analyze the total area and spatial range of
secondary forest succession.
Funding: This research was funded by the Ministry of Science and Higher Education of the Republic of Poland.
Acknowledgments: This research was supported by the ALS data: (1) General Directorate of the State Forests
research project “Development of forest inventory method based on the integration of data obtained by various
geomatic techniques” (2006–2009)”; (2) ISOK project (GUGIK, Poland); (3) REMBIOFOR—“Remote sensing-based
assessment of woody biomass and carbon storage in forests”, BIOSTRATEG1/267755/4/NCBR/2015, financed by
the National Centre for Research and Development in Poland.
Conflicts of Interest: The authors declare no conflict of interest.
References
1. Andersen, H.E.; Reutebuch, S.E.; McGaughey, R.J. A rigorous assessment of tree height measurements
obtained using airborne lidar and conventional field methods. Can. J. Remote Sens. 2006, 32, 355–366.
[CrossRef]
2. Hyyppä, J.; Hyyppä, H.; Litkey, P.; Yu, X.; Haggrén, H.; Rönnholm, P.; Pyysalo, U.; Pitkanen, J.; Maltamo, M.
Algorithms and methods of airborne laser-scanning for forest measurements. In Laser-Scanners for Forest and
Landscape Assessment: Proceedings of the ISPRS Working Group VIII/2Thies; Koch, M., Spiecker, B., Weinacker, H.,
Eds.; International Archives of Photogrammetry, Remote Sensing, and the Spatial Information Sciences:
Freiburg, Germany, 2004; XXXVI–8/W2.
3. Maier, B.; Tiede, D.; Dorren, L. Characterizing mountain forest structure using landscape metrics on
LIDAR-based canopy surface models. In Cartography from Pole to Pole; Springer Science and Business Media:
Heidelberg, Germany, 2008; pp. 625–643.
4. McGaughey, R.J.; Carson, W.; Reutebuch, S.; Andersen, H.E. Direct measurement of individual tree
characteristics from lidar data. In Proceedings of the Annual ASPRS Conference, Denver, CO, USA,
23–28 May 2004.
5. Naesset, E. Predicting forest stand characteristics with airborne scanning laser using a practical two-stage
procedure and field data. Remote Sens. Environ. 2002, 80, 88–99. [CrossRef]
6. Naesset, E.; Okland, T. Estimating tree height and tree crown properties using airborne scanning laser in
a boreal nature reserve. Remote Sens. Environ. 2002, 79, 105–115. [CrossRef]
7. W˛eżyk, P.; Szostak, M.; Tompalski, P.; Zajaczkowski,
˛ G. The role of Airborne Laser Scanning in updating and
revision of GIS databases—A case study in the Polish State Forest (Chojna District). In Proceedings of the
Silvilaser, 10th International Conference on LiDAR Applications for Assessing Forest Ecosystems, Freiburg,
Germany, 14–17 September 2010.
8. W˛eżyk, P.; Tompalski, P.; Szostak, M.; Glista, M.; Pierzchalski, M. Describing the selected canopy layer
parameters of the Scots pine stands using ALS data. In Proceedings of the 8th International Conference on
LiDAR Applications in Forest Assessment and Inventory, Edinburgh, UK, 17–19 September 2008; pp. 636–645.
9. Susyan, E.A.; Wirth, S.; Ananyeva, N.D.; Stolnikova, E.V. Forest succession on abandoned arable soils in
European Russia—Impacts on microbial biomass, fungal-bacterial ratio, and basal CO2 respiration activity.
Eur. J. Soil Biol. 2011, 47, 169–174. [CrossRef]
10. Bergen, K.M.; Dronova, I. Observing succession on aspen-dominated landscapes using a remote
sensing-ecosystem approach. Landsc. Ecol. 2007, 22, 1395–1410. [CrossRef]
11. Bowen, M.E.; Mcalpine, C.A.; House, A.P.N.; Smith, G.C. Regrowth forests on abandoned agricultural land:
A review of their habitat values for recovering forest fauna. Biol. Conserv. 2007, 140, 273–296. [CrossRef]
12. Lasanta, T.; Arnáez, J.; Pascual, N.; Ruiz-Flaño, P.; Errea, M.P.; Lana-Renault, N. Space–time process and
drivers of land abandonment in Europe. Catena 2017, 149, 810–823. [CrossRef]
13. Navarro, L.; Pereira, H. Rewilding abandoned landscapes in Europe. Ecosystems 2012, 15, 900–912. [CrossRef]Geosciences 2020, 10, 321 18 of 19
14. Prévosto, B.; Kuiters, L.; Bernhardt-Römermann, M.; Dölle, M.; Schmidt, W.; Hoffmann, M.; Uytvanck, J.;
Bohner, A.; Kreiner, D.; Stadler, J.; et al. Impacts of land abandonment on vegetation: Successional pathways
in European habitats. Folia Geobot. 2011, 46, 303–325. [CrossRef]
15. Śmigielski, M.; Pijanowski, J.; Gniadek, J. Forest succession and afforestation of agricultural land as a current
challenge agricultural works. Acta Sci. Pol. Formatio Circumiectus 2017, 16, 51–63. [CrossRef]
16. EU Biodiversity Strategy. 2011. Available online: https://ec.europa.eu/ (accessed on 30 June 2020).
17. Osińska-Skotak, K.; Radecka, A.; Piórkowski, H.; Michalska-Hejduk, D.; Kopeć, D.; Tokarska-Guzik, B.;
Ostrowski, W.; Kania, A.; Niedzielko, J. Mapping succession in non-forest habitats by means of remote
sensing: Is the data acquisition time critical for species discrimination? Remote Sens. 2019, 11, 2629. [CrossRef]
18. Osińska-Skotak, K.; Jełowiecki, Ł.; Bakuła, K.; Michalska-Hejduk, D.; Wylazłowska, J.; Kopeć, D. Analysis of
using dense image matching techniques to study the process of secondary succession in non-forest natura
2000 habitats. Remote Sens. 2019, 11, 893. [CrossRef]
19. van Ewijk, K.Y.; Treitz, P.M.; Scott, N.A. Characterizing forest succession in central Ontario using lidar-derived
indices. Photogramm. Eng. Remote Sens. 2011, 77, 261–269. [CrossRef]
20. Falkowski, M.; Jeffrey, S.; Evans, J.; Martinuzzi, S.; Gessler, P.; Hudak, A. Characterizing forest succession
with lidar data: An evaluation for the Inland Northwest, USA. Remote Sens. Environ. 2009, 113, 946–956.
[CrossRef]
21. Kolecka, N.; Kozak, J.; Kaim, D.; Dobosz, M.; Ginzler, C.; Psomas, A. Mapping secondary forest successionon
abandoned agricultural land with LiDAR point clouds and terrestrial photography. Remote Sens. 2015, 7,
8300–8322. [CrossRef]
22. Kolecka, N. Height of successional vegetation indicates moment of agricultural land abandonment.
Remote Sens. 2018, 10, 1568. [CrossRef]
23. Szostak, M.; W˛eżyk, P.; Tompalski, P. Aerial orthophoto and airborne laser scanning as monitoring tools for
land cover dynamics: A case study from the Milicz Forest District (Poland). Pure Appl. Geophys. 2014, 171,
857–866. [CrossRef]
24. W˛eżyk, P.; Szostak, M.; Tompalski, P. Comparison of the accuracy of the “PHOTO” check method with
automatic analysis based on ALS data for direct control of subsidy payments. ISPRS J. Photogramm.
Remote Sens. 2009, 20, 445–456.
25. Jagodziński, A.; Dyderski, M.; G˛esikiewicz, K.; Horodecki, P. Tree and stand-level biomass estimation in
a larix decidua mill. chronosequence. Forests 2018, 9, 587. [CrossRef]
26. Socha, J.; Pierzchalski, M.; Bałazy, R.; Ciesielski, M. Modelling top height growth and site index using
repeated laser scanning data. For. Ecol. Manag. 2017, 406, 307–317. [CrossRef]
27. Stereńczak, K.; Mielcarek, M.; Wertz, B.; Bronisz, K.; Zajaczkowski,
˛ G.; Jagodziński, A.M.; Ochał, W.;
Skorupski, M. Factors influencing the accuracy of ground-based tree-height measurements for major
European tree species. J. Environ. Manag. 2019, 231, 1284–1292. [CrossRef] [PubMed]
28. McGaughey, R.J. Fusion/Ldv: Software for Lidar Data Analysis and Visualization. Software Manual; USDA Forest
Service, Pacific Northwest Research Station: Portland, OR, USA, 2012.
29. Axelsson, P. DEM generation from laser scanner data using adaptive TIN models. ISPRS J. Photogramm.
Remote Sens. 2000, XXXIII/4B, 203–210.
30. Szostak, M.; Bednarski, A.; W˛eżyk, P. Monitoring of secondary forest succession on abandoned farmland
using LiDAR point clouds. Geodesy Cartogr. 2018, 67, 305–319. [CrossRef]
31. Szostak, M.; W˛eżyk, P.; Király, G.; Hawryło, P.; Bednarski, A. Automation in the assessment of forest succession
dynamics using airborne laser scanning data. International multidisciplinary scientific geoconference
surveying geology and mining ecology management. SGEM 2018, 18, 41–48. [CrossRef]
32. Bednarski, A. Determination Dynamics of Spatio-Temporal Changes in The Areas of Forest Succession in the
Milicz Commune Based on Analysis of Airborne Laser Scanning Point Clouds From 2007, 2012 and 2015.
Master’s Thesis, University of Agriculture in Krakow, Kraków, Poland, 2018.
33. Szostak, M.; Bochenek, J. Using airborne laser scanning data for automation land cover mapping in the
aspect of monitoring forest succession areas. Geoinform. Polonica 2018, 17, 91–97. [CrossRef]
34. Szostak, M.; Hawryło, P.; Piela, D. Using of Sentinel-2 images for automation of the forest succession detection.
Eur. J. Remote Sens. 2018, 51, 142–149. [CrossRef]Geosciences 2020, 10, 321 19 of 19
35. W˛eżyk, P.; G˛eca, T. Revision and update of the EGiB land-use database using the airborne laser scanning
point cloud—The case study of Tukl˛ecz village in Świ˛etokrzyskie voivodeship. J. Photogramm. Remote Sens.
2013, 20, 445–456.
36. Ostrowski, W.; Górski, K.; Pilarska, M.; Salach, A.; Bakuła, K. Comparison of the laser scanning solutions for
the unmanned aerial vehicles. J. Photogramm. Remote Sens. 2017, 29, 101–123. [CrossRef]
37. Koska, B.; Jirkab, V.; Urbana, R.; Kremena, T.; Hesslerovab, P.; Jona, J.; Pospisila, J.; Fogl, M. Suitability,
characteristics, and comparison of an airship UAV with lidar for middle size area mapping. Int. J. Remote Sens.
2017, 38, 2973–2990. [CrossRef]
38. Moudrý, V.; Gdulová, K.; Fogl, M.; Klápště, P.; Urban, R.; Komárek, J.; Moudrá, L.; Štroner, M.; Barták, V.;
Solský, M. Comparison of leaf-off and leaf-on combined UAV imagery and airborne LiDAR for assessment
of a post-mining site terrain and vegetation structure: Prospects for monitoring hazards and restoration
success. Appl. Geogr. 2019, 104, 32–41. [CrossRef]
39. Vastaranta, M.; Wulder, M.A.; White, J.C.; Pekkarinen, A.; Tuominen, S.; Ginzler, C.; Kankare, V.;
Holopainen, M. Airborne laser scanning and digital stereo imagery measures of forest structure: Comparative
results and implications to forest mapping and inventory update. Can. J. Remote Sens. 2013, 39, 382–395.
[CrossRef]
40. White, J.; Stepper, C.; Tompalski, P.; Coops, N.; Wulder, M. Comparing ALS and image-based point cloud
metrics and modelled forest inventory attributes in complex coastal forest environment. Forests 2015, 6,
3704–3732. [CrossRef]
41. White, J.; Wulder, M.; Vastaranta, M.; Coops, N.; Pitt, D.; Woods, M. The utility of image-based point clouds
for forest inventory: A comparison with airborne laser scanning. Forests 2013, 4, 518–536. [CrossRef]
42. National Program for Increasing Woodness. Document Adopted for Implementation by a Resolution of the Council
of Ministers in June 1995, Updated in 2003; Ministry of the Environment: Warsaw, Poland, 2003. Available
online: https://www.gov.pl (accessed on 30 June 2020).
43. Main Statistical Office Poland. Statistical Books of Forestry. 2018. Available online: https://stat.gov.pl/obszary-
tematyczne/roczniki-statystyczne/roczniki-statystyczne/rocznik-statystyczny-lesnictwa-2018,13,1.html
(accessed on 30 June 2020).
44. Hościło, A.; Mirończuk, A.; Lewandowsk, A. Determination of the actual forest area in Poland based on the
available spatial datasets. Sylwan 2016, 160, 627–634.
45. Jabłoński, M.; Mionskowski, M.; Budniak, P. Forest area in Poland based on national forest inventory. Sylwan
2018, 162, 365–372.
46. Szwagrzyk, J. Forest succession on abandoned farmland; current estimates, forecasts and uncertainties.
Sylwan 2004, 4, 53–59.
47. Buraczyk, W. Structure and Breeding Value of Self-Sown Woody Species in the Initial Phase of Secondary Succession
on Post-Agricultural Lands of the Lower Part of Poland; University of Life Sciences Press: Warsaw, Poland, 2013.
© 2020 by the author. Licensee MDPI, Basel, Switzerland. This article is an open access
article distributed under the terms and conditions of the Creative Commons Attribution
(CC BY) license (http://creativecommons.org/licenses/by/4.0/).You can also read