Available energy flexibility: sensitivity study for different climatic conditions - RiuNet
←
→
Page content transcription
If your browser does not render page correctly, please read the page content below
FINAL RESEARCH FOR MASTER'S DEGREE IN ENERGY ENGINEERING
 TECHNOLOGIES FOR SUSTAINABLE DEVELOPMENT

 Available energy flexibility: sensitivity
 study for different climatic conditions

STUDENT: Iris Ruano Juan
SUPERVISOR: Associate professor Donal Finn
MENTORS: Dr. Mattia De Rosa, Anjukan Kathirgamanathan

 ACADEMIC COURSE: 2017 / 2018
Available energy flexibility: sensitivity study for
 different climatic conditions

ABSTRACT

The present project develops different strategies to implement in a commercial building to provide
electrical flexibility to the grid. The project analyses the effect on how these strategies affect the
building power consumption, focusing on strategies to modify and obtain the flexibility with the
cooling system. The case study day that is analysed with EnergyPlus and MATLAB is July 10th, a
typical day in summer. The two-demand response applied in the electrical consumption are related
with the chiller set point.
The first demand response implemented is the increase of the set point, obtaining different results for
each weather, but it shows how the flexibility is obtained during the building operational hours, also
the efficiency of this flexibility is analysed, obtaining a flexibility for each hour and his efficiency, to
develop this, it is need to implement the demand response in 1h timesteps, to be able to compare in a
proper way the flexibility obtained, it is going to applied the demand response each hour and compare
the 24 different cases, this is going to be reproduce for all the weathers considers, after a deep analysis
is going to discover how the best flexibility is provided for weathers with an outdoor temperature
near the new set point, also it is discovered the efficiency in this down flexibility is going to be related
with the hours where the flexibility is provided.
Once the increase set point demand response is implemented and analysed, the methodology is
reproduced for the second demand response consisted of decreasing the set point temperature. This
new strategy is up flexibility and provides the efficiency to the grid incrementing the commercial
building consumption. The results obtained from this demand response are different to the other
strategy, results prove how the strategies analysed can provide electrical flexibility to the grid during
all day, also it demonstrates how the strategy cannot be efficient even if it is providing flexibility.

KEY WORDS:
Energy flexibility, efficiency, demand response, savings, comfort, energy, temperature, weather,
cooling, heating and building.

 I
Available energy flexibility: sensitivity study for
 different climatic conditions

STATEMENT OF ORIGINAL AUTHORSHIP
I hereby certify that the submitted work is my own work, was completed while registered as a
candidate for the degree stated on the Title Page, and I have not obtained a degree elsewhere on the
basis of the research presented in this submitted work.

 II
Available energy flexibility: sensitivity study for
 different climatic conditions

TABLE OF CONTENTS

 NOMENCLATURE .................................................................................................................. VIII
1.INTRODUCTION ................................................................................................................................ 1
 1.1.Background: ...................................................................................................................... 1
 1.1.1.Energy Context: ......................................................................................................... 1
 1.1.2.World context: ........................................................................................................... 2
 1.1.3.European context: ..................................................................................................... 2
 1.1.4.Energy production in Ireland: .................................................................................... 3
 1.1.5.Impact of climate change on buildings ...................................................................... 4
 1.1.6.Building context ......................................................................................................... 5
2.LITERATURE REVIEW ........................................................................................................................ 6
 2.1. Smart grids ....................................................................................................................... 6
 2.2.Comfort analyses............................................................................................................... 6
 2.3.Building Energy Analysis .................................................................................................... 7
 2.4.Thermal building analyses ................................................................................................. 9
 2.5.Thermal and electrical building analysis ......................................................................... 10
 2.6.Prior Concepts ................................................................................................................. 10
 2.6.1.ENERGYPLUS ............................................................................................................ 10
 2.6.2.Efficiency: ................................................................................................................. 11
 2.6.3.Flexibility: ................................................................................................................. 11
 2.6.4.Flexibility indicator: ................................................................................................. 11
 2.6.5.Cooling Degree Days [CDD] ..................................................................................... 11
 2.7.Project aims and objectives: ........................................................................................... 12
3.PREVIOUS WORK: MODEL .............................................................................................................. 13
 3.1.Reference model: ............................................................................................................ 13
 3.1.1.Building description: ................................................................................................ 13
 3.2.Reference mathematical model: ..................................................................................... 16
 3.3.Methodology to simulate the previous work: ................................................................ 20
 3.4.Goals. ............................................................................................................................... 23
 III
Available energy flexibility: sensitivity study for
 different climatic conditions

4.METHODOLOGY ............................................................................................................................. 24
 4.1.Analysis of impact of climate. ......................................................................................... 24
 4.2.Methodology to implement the demand response. ....................................................... 25
 4.2.1.DR: increase the set point........................................................................................ 26
 4.2.2.DR: decrease the set point. ..................................................................................... 27
 4.2.3.Methodology to analyse DR: Available Electricity Energy Flexibility ....................... 27
 4.2.4.Methodology to analyse the efficiency. .................................................................. 28
 4.2.5.Methodology to analyse the comfort. ..................................................................... 28
5. RESULTS ......................................................................................................................................... 30
 5.1.Results of influence of weather ...................................................................................... 30
 5.2.Results of increase set point demand response: ............................................................ 32
 5.2.1.AEEF: increase set point .......................................................................................... 32
 5.2.2.Efficiency results ...................................................................................................... 35
 5.2.3.Comfort results ........................................................................................................ 35
 5.3.Results of decrease set point temperature..................................................................... 36
 5.3.1.AEEF Results ............................................................................................................. 36
 5.3.2.Efficiency results ...................................................................................................... 37
 5.3.3.Comfort results analyses ......................................................................................... 37
 5.4.CONCLUSIONS: ................................................................................................................ 38
 5.5.FUTURE WORK: ............................................................................................................... 40
REFERENCES ...................................................................................................................................... 41
APPENDIX: ......................................................................................................................................... 45
 A.Weather results: Temperatures ........................................................................................ 45
 A.1. Indoor temperature ................................................................................................... 45
 A.2. SIMULATIONS WHEN THE PROGRAM IS ALWAYS ON, AND ALWAYS OFF (BASE) .... 47
 A.3. PROFILE; HOUR BY HOUR DEPENDING ON THE LOCATION: DUBLIN ........................ 52
 B. Increase set point results. ................................................................................................. 56
 B.1. AEEF Results of increasing set point .......................................................................... 56
 B.2. Efficiency results of increase set point ...................................................................... 58

 IV
Available energy flexibility: sensitivity study for
 different climatic conditions

 B.3. ANEX 2. PMV for all the locations. ............................................................................ 61
C.Decrease set point results .................................................................................................. 64
 C.1. AEEF results decrease set point ................................................................................. 64
 C.2. Efficiency results decrease set point ......................................................................... 66
 C.3. PMV Results decrease set point ................................................................................ 69

 V
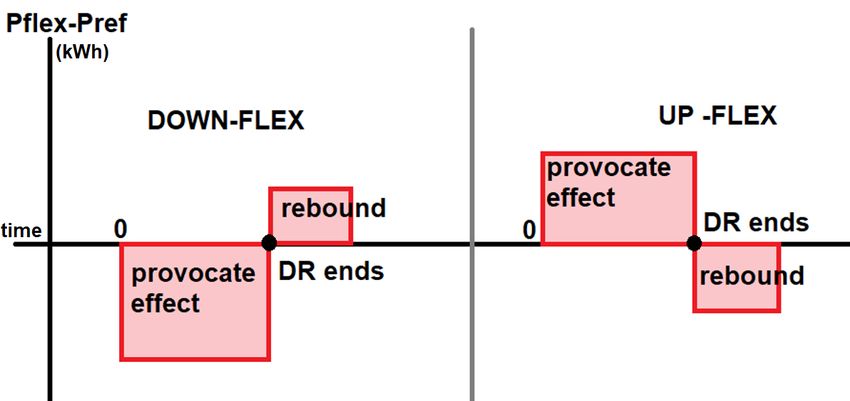
Available energy flexibility: sensitivity study for
 different climatic conditions

LIST OF FIGURES:
Figure 1: Ireland energy production 1990-2015[17] ........................................................................... 3
Figure 2: Trend in heating and cooling degree days (1981-2014) [12] ............................................... 5
Figure 3: Large office Building ........................................................................................................... 13
Figure 4: Average winter daily load profile ....................................................................................... 14
Figure 5: Summer day load profile .................................................................................................... 15
Figure 6: DR individual effect expected ............................................................................................ 17
Figure 7: AEEF expected with the DR set point implemented .......................................................... 18
Figure 8: Outdoor temperature for Dublin ....................................................................................... 18
Figure 9: Typical AEEF curve in down flexibility DR........................................................................... 20
Figure 10: Typical AEEF curve in up flexibility DR ............................................................................. 20
Figure 11: AEEF effect expected to apply the DR during 1h term..................................................... 21
Figure 12. Typical AEEF if the DR is applied each hour ..................................................................... 22
Figure 13. Typical efficiency load when the DR is down flexibility and applied each hour .............. 23
Figure 14. Down and up flexibility loads ........................................................................................... 28
Figure 15: PMV index ........................................................................................................................ 29
Figure 16. PMV expected with DR ..................................................................................................... 30
Figure 17. Indoor temperature in the perimeter .............................................................................. 31
Figure 18. Outdoor temperatures ..................................................................................................... 32
Figure 19: All the AEEF obtained applying the DR in each location, each hour ................................ 33
Figure 20. Indoor perimeter temperatures ....................................................................................... 33
Figure 21: AEEF in 4 Dublin, Timisoara, Seville and Amsterdam ....................................................... 34
Figure 22: Outdoor temperature in Dublin, Amsterdam, Seville and Timisoara. ............................. 35
Figure 23: AEEF result up flexibility, decrease set point ................................................................... 36
Figure 24: AEEF results decrease set point Dublin, Timisoara, Seville and Amsterdam. .................. 37
Figure 25: Dublin Temperatures ....................................................................................................... 45
Figure 26. Seville temperature .......................................................................................................... 46
Figure 27. Athens temperature ......................................................................................................... 46

 VI
Available energy flexibility: sensitivity study for
 different climatic conditions

LIST OF TABLES
Table 1: Temperature set point in summer season for cooling ........................................................ 14
Table 2: End-use electricity consumption ......................................................................................... 15
Table 3: ASHRAE acceptable limits for zone temperature drift [32] ................................................. 16
Table 4: Demand response technologies considered in the previous study. ................................... 16
Table 5. HDD and CDD in 2017, specific cities in Europe. ................................................................. 25
Table 6: Acceptable variety in indoor temperature .......................................................................... 26
Table 7: New summer design days increasing set point temperature ............................................. 27
Table 8: New summer design days decreasing set point temperature ............................................ 27

 VII
Available energy flexibility: sensitivity study for
 different climatic conditions

NOMENCLATURE

Acronyms
EU European Union
UN United Nations
DOE Department of Energy
HDD Heatings Degree Days
CDD Cooling Degree Days
DR Demand Response
AEEF Available Electrical Energy Flexibility
ɳAEEF Energy flexibility efficiency
PMV Predicted Mean Value
ISO International Organization for Standardization
HVAC Heating, ventilation and air conditioning
P Power consumption
kW Kilowatts
kWh Kilowatts hour

 VIII
Available energy flexibility: sensitivity study for
 different climatic conditions

 1. INTRODUCTION
The present thesis is submitted to University College Dublin (UCD) for the Erasmus master program,
as the final research for the master’s degree in energy engineering technologies for sustainable
development granted by Polytechnic University of Valencia and attended in the College of
Architecture and Engineering at UCD.
In an energy context, the need of provide flexibility to the electrical grid and develop technologies
and strategies to facilitate this is one of the mains goals for the European Union considering increasing
penetration of renewable energy. To solve this problem, the actual use of the energy (on the demand
side) must change, in this context, the present research develops a model to control the actual
commercial buildings energy consumption and provide energy flexibility to the electrical grid.
reducing in this way the peaks loads in the electrical daily consumption and decreasing the emissions.
With the control of the electrical consumption the primary energy can be chosen by the user, trying
to adapt the commercial building demand to the most cheap and clean energies. Even if the total
control is far in this moment, some models and strategies can help reducing the difference and
buildings can be approached to a more controllable consumption.
Through the present work is going to develop and analyse different strategies with the goal of provide
flexibility, these strategies will play an important role in the commercial building consumption,
focusing in the cooling, the strategies that are developed are the increase and decrease of the chiller
set point, providing the flexibility changing the electrical consumption in heating and cooling.

 1.1. BACKGROUND:
The present research is included in electricity efficiency and building construction, with the aim to
get a mathematical model to increase the flexibility in one building in the electrical energy
consumption.

 1.1.1. ENERGY CONTEXT:
In the Energy context the need of sustainability is clear, an energetic problem exists, there are not
enough energy for future generations, because of the overuse of the energy and the small resources
of some energy founts, a solution must be found, a guarantee to cover all the actual needs and the
environmental necessities [1].

The renewable energy sources are presented [2] as the solution for the energy green generation but
made them match with the electrical grid is a problem, the renewable energies are dependants of the
natural source, the photovoltaic generation can be produced just in the sunny hours, the Eolic
generation can’t be produced when the consumer need either, it is a windy dependant energy fount.

The energetic problem increase with the increasing demand [3], the inacceptable environmental
impact, the contaminants gases accumulation, the greenhouse effect and the global warming[4],[5].
All the impacts are effects of the climate change, and independent of these consequences, the energy
consumption is a need. Population have the right of a quality energy access, so, it is need find an
environmental friendly solution to cover the energy problems respecting the environment and trying
to cause the minimum effect on it while cover the consumers’ needs.
 1 | 71
Available energy flexibility: sensitivity study for
 different climatic conditions

The actual electricity production is centralized[6], and the key to prevent and decrease the climate
change is decentralized electricity production and increment the renewable sources[6]. The electricity
grid uses nowadays as a virtual storage, providing the energy demanded and forcing providers to
adapt at consumers necessities, if this fact change the energy production will be easier to adapt to
some new technologies environmental friendly.

 1.1.2. WORLD CONTEXT:
On 11 December of 1997, in Kyoto, Japan, there was an international agreement [7]. United Nations
meet in Kyoto to get an agreement with the aim of reduced the international binding emissions. The
goal is reduced the actuals (2012) emission levels of CO2 and another greenhouse effect gas to the
levels of 1990[8].
The Kyoto protocol [9]was adopted for several developed countries, including European Union,
who compromised to reduce in an 8% them emissions respect 1990 emission[10], which means a
reduction of 346 million of CO2 tons[10]. But the use of the primary resources in EU until 2030
[11]does not guarantee the Kyoto agreement compliment [12].
Paris 2015, The “Paris Agreement”[13], more than 55 countries that represents the 55% of the global
emissions takes an agreement to treat the climate change. Paris Agreement is a Kyoto Protocol
ratification, where some goals are include and the emissions target is discuss. [10]

There are some solutions that must be evaluated from the technological scenario, searching for the
solution that solve better the energy needs respecting the environment. Also, there are some systems
based on renewable energies, and them grid incorporation, trying to improve the energy efficiency
and control the demand in all the sectors, in this research the demand control is going to be studying
and developed, focusing in the domestic buildings demand.

 1.1.3. EUROPEAN CONTEXT:
European Union proposed on 3 March of 2010 a 10 years strategy to develop EU during a decade
(2010-2020) [7]. The aims are to advance in economic crisis and solve some defect of the growing
model, the strategy focus in a sustainable growing based in a Green economy[14]. To achieve that it
focuses in 5 main points, highlighting the climate change and energy. Related with that achieve, EU
try to get in 2020 a new energy scenario, with main points[14]:
- 20% of the primary energy must be renewable
- Energy efficiency must improve in a 20%
- 20% of the emissions of CO2 must be reduced

In a middle term the aims go to 2030 EU plan[15], which consider a green scenario with multiple
energies resources, no one resource with a contribution bigger tan 30-35%[15]. The electricity is
consider the last final energy form and the energy resources must be distributed, also the energetic
demand must have participated in the energy market as an active agent.

In the energetic context buildings have a significant role, the European buildings represent the 40%
of the energy use[16]. The consume is electricity and thermal energy, in order to reduce the buildings
 2 | 71
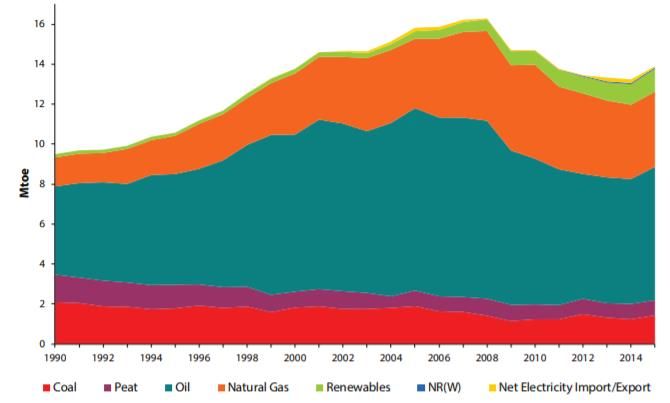
Available energy flexibility: sensitivity study for
 different climatic conditions

consumption, the EU has impose the “European Performance of Buildings Directive”[17]. New
buildings must be nearly the zero consume, nZEB buildings[16]. To made the new buildings nearly
zero energy it is combined passives solutions with more efficiency energy systems or self-renewable
sources in the buildings[18]. This measure reduces the consumes of the news buildings, but it has not
influence in the electrical grid, the next step to overcome the imbalance between demand and supply
in the grid is made consumers participate in the energy market, that means a new market structures
as for example the Smart Grids.[19]

 1.1.4. ENERGY PRODUCTION IN IRELAND:
The Ireland energy production is show during the period 1990-2015 in the following figure,

 Figure 1: Ireland energy production 1990-2015[20]
In 2015 the 90.9% of the energy comes from fossil fuels (contaminants). Ireland[20] is importing
these fossil fuels as the country doesn’t have natural fossil resources in his territory. Ireland is buying
the primary resource, and just the 8.3% comes from renewable resources in 2015 January[20]. These
data has change, increasing until 12,5% in 2015 December, emphasizing the wind energy as the most
renewable used, with the half of the renewable production.

The efficiency of electricity supply has experimented a growth in 1990-2015 period[20]. The
electricity efficiencies are defined as the final consumption of electricity divided by the fuel inputs.
As renewable sources has no inputs, increasing the renewable use this efficiency also increases,
getting in 2015 a 49% of efficiency in energy supply and a 54% in energy generation[20].

Since the 2015 Paris Agreement [13] Ireland is progressing to reduce and decarbonised their energy.
The EU target 2020 is approaching[14], the new goals are the 2030 target[15], the Irish economy is
growing since 2015 and the energy use is also increasing. Despite the energy consumption grow up,

 3 | 71
Available energy flexibility: sensitivity study for
 different climatic conditions

in 2015 Ireland research the half targets for 2020 UE, with a 9.1% of the generation in 2015 based on
renewable sources[21].
Ireland is an energy dependence country, this dependence has increase since 2005, incrementing the
energy production in Ireland, also increments the energy independence[21].

SEAI’s (Sustainable Energy Authority of Ireland) [21]has approved a strategy for 2017–2021 in the
context of European vision for energy sustainability. The government plans increment the renewable
production from 23% to a 40% until year 2020 [21], where these technologies must cover the 16% of
the electricity, heat and transport consumption in Ireland[21].

This new polities comes incentivized by the European Project of 2020[14]. The compromises that
Ireland has get with EU. SEIA has approved a 5 years strategy to change the actual situation (2017)
to a new one, where the great majority of the population participate in a more sustainable energy
future, the aim is achieved the EU 2030 climate change agreement[15]. The energetic SEAI’s goals
are: empowered citizens and communities at the centre of the Irish sustainable energy transition,
foment a positive energy sustainability conscience, increment the grant impact in renewable energies,
further step-changes in Public Sector, industry and SME sustainable energy activity and the last aim
is increase the invest in energy innovation and research [21].
 1.1.5. IMPACT OF CLIMATE CHANGE ON BUILDINGS
The climate change affects directly to the use of energy in terms of cooling and heating, the change
in the demand has been studied by [22], climate change increases the demand of cooling and the
heating is becoming less significant, but it depends on the location, there still having locations that
are completely heating dominated.

The analysis of the energy demand evolution is based also in the buildings evolution, but global
warming is affecting the energy use in buildings, it has been demonstrated in several countries as
Sweden, United Emirates, UK and Ireland.

The impact of climate change is undeniable, the energy efficient designs get special importance, the
use of different insulation walls, windows and radiation barriers must be considered, the prediction
of energy demand have a heavy dependence on the climate energy polities applied, considering
different levels of CO2. The existing buildings have a potential to save more than the 50% of the
energy waste and emissions.

In 2010 the third of global energy use was expending by buildings[23]. In generally developed
countries waste great part of this energy, supposing the developing countries have the same
consumption, the emissions related by buildings are going to experiment a huge increase[24].
Buildings represent a critical piece of energy consumption and gas emissions, the impacts of climate
change in buildings infrastructures and services are alarming[25]. Buildings also show a multiple
climate change impact, as the urban heat island effect, they also are vulnerable to the climate change
impacts effects, as the increased rain and storms, the wildfires[26]. In Europe Climate change increase
the intensity of heat waves[27]. Adaptive strategies should be implemented, including the use of
ventilate cooling and solar shading, also the Climate change affects to the buildings materials,
damaging them.

 4 | 71
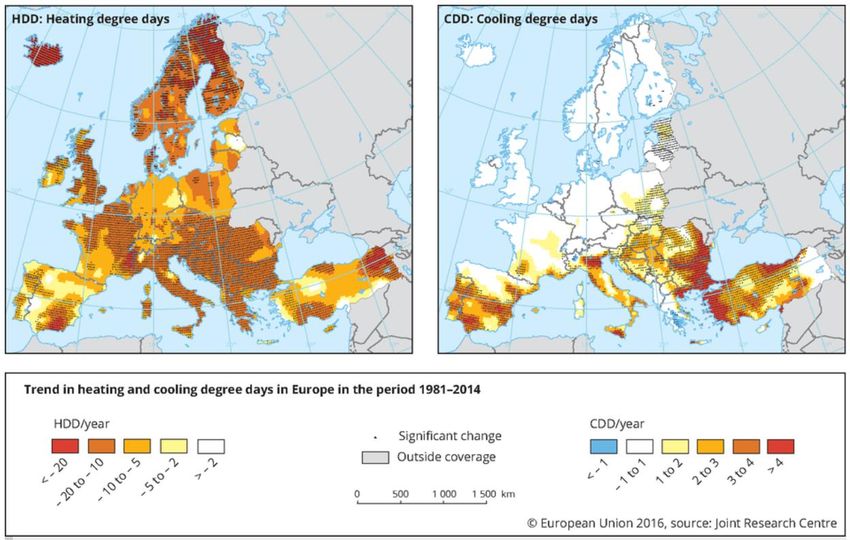
Available energy flexibility: sensitivity study for
 different climatic conditions

As it can be observed in the figure 2, during the last 25 years [15], the heating and cooling degree
days (the sum of the different between the real temperature and one reference temperature) are
changed in Europe because of the climate change[15]. That means that the global temperature is
increasing.

 Figure 2: Trend in heating and cooling degree days (1981-2014) [15]
It can be observed how the heating degree day and the cooling degree day have increase, having more
extremes temperature nowadays than before. The HDD means the hourly temperature for one year
comparing with the reference temperature at which the cooling should be program to goal the comfort.
As HDD number has increase, that means that the difference between the hourly temperature and the
reference during the year is bigger, so during the cold days, the temperatures are lower. Also analysing
the CDD it shows exactly the opposite, how the warm days are hotter in 2014 than in 1981 [15], that
means that the temperatures have change getting more extreme.

 1.1.6. BUILDING CONTEXT
Building sector is a significant consumer of the energy[23]. It has been found that energy can be saved
in the building demand, controlling and monitoring the use and consumption. An energy
benchmarking is really important to detect abnormal energy consumption or estrange energy
behaviour in a building [28]. There are a lot of method to research a building process to monitor, the
first step to develop a building energy manage is the knowledge of how is using the building this
energy.
Also, in the new constructions the energy efficiency is consider, and the new buildings can be
constructed thinking in the user needs, taking advance of the orientation, the solar irradiation and
 5 | 71
Available energy flexibility: sensitivity study for
 different climatic conditions

about the light needs implementing energetic passive solutions during the construction [29]. But the
majority part of the domestic buildings are buildings already builds.

In 2010 the world’s buildings consumed the 32% of the global final energy, and they produced the
19% of the greenhouse gas emissions[20]. In 2015 the average Irish household emitted 5.5 tonnes of
CO2 of which 61% [30]. The emissions came from direct fuel use in the home and the remainder
from electricity use, that shows the important place that domestic buildings have in the gas emissions
reduction.
 2. LITERATURE REVIEW
Buildings represent the 40% of the world-wide energy[16], that shows the important role that building
play in the energy consumption control, the buildings consumption is divided in thermal energy and
electrical energy. The research goals are find the relationship between the location, building
properties and energy strategies in a domestic building consumption with the energy efficiency.
Develop a model to reduce the domestic building consumption by the building energy control, moving
the demand from the energy market picks to the loads using different energy strategies. There are a
lot of researches previous this one related with the topic to threat: the behaviour of the energy
domestic building consumption and the commercial buildings consumption [31],[28].
There are many research and articles that introduce and develop that concepts, to understand the
importance of that and to see which points the most focused ones are, a sum of the research is going
to be introduce.
 2.1. SMART GRIDS
The smart grids are presented as a monitoring energy flow to supply energy demand. Consumers can
adapt their energy use depending on the energy price during the day, saving money and linearizing
the electrical grid demand[32]. The smart grids are a good tool also to integrate renewable energy to
balance the net. The final consumer is who decides their own energy response, use and price. The
final consumer that has also a renewable source can sell the excess to the grid (that depends in the
country law, different for each country). They are a way to change the traditional energy grids for a
more digital infrastructure that allows to monitor and steering in real-time[6]. The smart grids try to
take advance of the potential energy flexibility to reduce costs and emissions. To integrate more
decentralised energy generation system the consumers-producers must be modernising of the role of
Distribution Systems Operators, for a more proactive grid the management and operation must
change, becoming more flexible and efficient [19].

The EU pretend to replace the 80% of electricity with smart grids in 2020[33], controlling the
consumption and electricity production the emissions are reduced. On 30 November 2016, the
European Commission made a proposal to request a smart meter that allows consumers to take benefit
of the energy market[14]. The aim is get in 2020 almost the 72% of European consumers with a smart
meter for electricity, that small meter has a cost between 200€ and 250€ [10], but the annual savings
are around 300€ per year, having a payback period smaller than a year [10].
 2.2. COMFORT ANALYSES
The thermal comfort is defined as the conditions needs to satisfied buildings occupants. The
conditions which expresses satisfaction with the thermal environment, it includes heating, ventilation
and air conditioning. The thermal comfort is defined and calculated by ASHRAE as standard
according to the most part of the population. As buildings are designed for people, the aim is get

 6 | 71
Available energy flexibility: sensitivity study for
 different climatic conditions

comfort inside, keeping people comfortable while the building should be efficient, healthy and safe
[34].
The impact of climate and temperature on health is receiving more attention. Indoor thermal comfort
has great importance in European countries. It has been demonstrated the evidence of the
temperatures impact on health by [35].
An optimization framework is analysed by [36] to evaluate how affects relax the comfort effect on
the energy demand. It is used percentages and economics constrains to observe the energy demand
with a comfort variability, using temperatures and relative humidity controllers.
Demand flexibility can be achieved relaxing comfort conditions, thermal comfort and air quality are
important points. The traditional systems fix the set-point for the equipment, these control use models
to predict the conditions and needs. This system also let predict and manipulate the comfort and
control the price. It is an economical control that it has not taken into account the users’ needs. Find
the balance between the comfort and the price can be complicated. Different measure that reported
economic and energy savings are evaluated considering the system behaviour under relaxed comfort
conditions[36].
The objective is evaluating the impact comfort relaxation on energy demand. It is demonstrated that
significant energy reductions by users are gets with small relaxation of air quality conditions. The
comfort base model is based on the ASHRAE standards [34], it is going to change this comfort model
to analyse the effect of different control variable, the CO2 concentration, humidity and pressure.

 2.3. BUILDING ENERGY ANALYSIS
Nowadays, the grid flexibility is supplied by conventional power plants. The demand side
management is defined as the energy management for the end-user electricity consumption. The
consumers response to financial or other incentives. The buildings play an important role in this
consumption, representing the 40% of the energy consumption [16]. Buildings should be taken into
consider, the commercial building have specially importance but, they use to have implemented a
Building Automation System integrated that can be no changed [37]. Furthermore, domestic buildings
individually are not representative, but as a group, the residential buildings offers a great potential to
work and manage the energy consumption.
Basing the research on the lumped parameter modelling framework calibrated on [38] with synthetic
data obtained using Energy Plus to represent a semi-detached house. Representative of Ireland
residential buildings, the research starts from a building model with an acceptable accuracy[39]. The
model has been calibrated using three methodologies: sequential, simultaneous and ensemble
calibration [39]. It is observed that the parameter model has potential to integrate in an electricity grid
model a computationally-efficient management of the energy consumption.
Based on [38] model, the research accomplished on [40]. Presents a simple Dynamic model able to
simulate heating/cooling energy consumption in buildings, based on the electrical analogy.
Developing energy balance equations for external and internal conditions, the consumption is
analysed concluding that the inertia effect has importance especially for the cooling demand. A
MATLAB/Simulink model able to predict the heating and cooling energy demands accurately has

 7 | 71
Available energy flexibility: sensitivity study for
 different climatic conditions

been developed. The model is compeer in different parts of Europe and conclude that the solar
irradiation has a directly effect in the cooling demand, also it compares the energy demand in Europe.
The MATLAB model Works well, and it can predict the energy consumption and the heating demand,
is linearly correlated with HDD (Heating Degree Days).

A model based on domestic grid integration to control the building energy demand and implementing
renewable energies with Photovoltaic programable system and an energy storage based on batteries
has been developed by Also [31]. But this control uses the energy generation to control the demand,
no the building needs.

Some studies affirm that the energy thermal flexibility in the building has the most operational ranged
in weekend days at afternoon /night. Also, the energy storage is proposed, but thermal storage has a
short operational time. 1-2h, it has been simulated, and the peaks can be moved using storages, so the
research is going to take into consider focussing in the most operational points to improve.

Moreover, the energy storage has an influence on demand system. A lot of studies compares storage
demand systems: batteries, plug-in electric vehicles (EV), commercial building thermal mass and
thermostatically con-trolled loads. But the aim is control the consumption since the consumer point,
not from the generators.

The Building demand load management has been studied by [32] with algorithms for a Smart House.
The compromise between comfort and energy cost has been get, but the present research tries to not
change the consumers behaviour. It tries to develop an optimal solution to the prediction of the energy
building demand. Also, the most part of the Irish domestic Building are not Smart House where
implement the [32] with method could be an option.

A Building simulation has been done with Energy Plus by Cole. It presents a method that generates
automatically data to be used in a reduced model studio. The aim is minimize the residential electricity
cost during summer. The strategy gives the authors a predictive control reduction, in the research
authors focused in summer month because of the Texas weather. But in the study case of Ireland, the
summer month do not represent the main energy domestic consumption. This is the reason why,
taking in consider the main parts of the [29] research. The model does not fit with the Ireland domestic
energy consumption prediction.

Various demand response strategies are simulated and analysed using EnergyPlus by [41]. The energy
daily flexibility is calculated. The total flexibility energy in a commercial building have been
calculated by [41] presenting individual and aggregate strategies to increment the electricity energy
flexibility. Some of the strategies used are: consider adjust the setpoint of chiller water, thermostat,
fan control and modify heat and cooler temperatures.
Also, different types of energy storage are compared, batteries, electrical vehicles, building thermal
mass and water tanks. There are considers two supply method, the heat pump and a combined heat
and power.
The study made in [41] uses a virtual model to test the strategies and configurations. In first place it
is developed the virtual buildings model and simulate using EnergyPlus. Once it is developed, it is
analysed to observe the demand responses in each strategy. The flexibility of each strategy is analysed

 8 | 71
Available energy flexibility: sensitivity study for
 different climatic conditions

and finally it is created a daily flexibility profile of the demand response for the different strategies.
The flexibility is determinate comparing with an indicator that measures the available storage
capacity. With this flexibility daily profile an operator can combined or use individually the strategies
that better adapts to the needs of the consumers providing grid flexibility.

 2.4. THERMAL BUILDING ANALYSES
Go into detail about the use of commercial buildings to provide management of the energy demand
using the thermal inertia of Ventilation, Heating and Air Conditioning[42]. The most common
question is how provide an optimally flexibility considering the associated costs and efficiencies,
various strategies have been simulated, the total energy flexibility and efficiency is calculated in [43].

The thermal energy is distributed commonly as hot water. This thermal energy can be storage, the
impact of use thermal energy storage has been evaluated shifting the peak of the heating demand.
Demonstrating that it is possible save costs and have available flexibility, but it depends on each case,
the studies cannot be generalized. To analyse the buildings potential for use structural thermal energy
storage, a framework should be established to compare the potential and flexibility of the storage.
Also, it is needing to be understood how to activate the storage capacity and finally, the impact must
be evaluated.

There are a lot of studies that proposed quantify the potential thermal energy storage, and the
flexibility available, 3 main characteristics are presented by [43] applied in the Belgian residential
sector. There are 3 dimensions of energy flexibility to consider for the storage thermal system: size,
time and cost, the storage efficiency is the active thermal storage (with losses) and an activation cost
for this storage capacity. This storage capacity depends on the building properties, the climatic
conditions and the properties of the ventilation and heating system.
In [40] is quantify the available storage capacity and the heating power is represented by an equation:

 = ∫0 ( − ) {Eq. 1}

CADR = Capacity of activate demand response
QADR = Heat activate demand response
Qref = Heat demand without response

In the research presented by [43] Belgian buildings stock model are taken as the base of the project,
the Belgian residential buildings are analysed and simulate. To include different types of building
with really different characteristics, it is simulated the quantify of energy storage available and the
efficiency.

The boundary condition is analysed and shown to be evaluated in static conditions. Assuming
constant outdoor temperature and the absence of gains. It is analysed the effect if storage thermal
energy during a period of 4h. It is observed that for long times when the indoor temperature reaches
the comfort, the heating must be limited.

Also, comparing different buildings, the houses built before 1945 [21] needs more than the double of
energy than the news ones to research the same conditions. On the other hand, the higher ratio of
thermal mass losses is obtained for the terraced buildings. Also, the houses with thermal storages
 9 | 71
Available energy flexibility: sensitivity study for different climatic conditions experiments more losses that the houses that provide the heat by radiators. Moreover, it is notice that floor heater is the most efficiency method, with higher storage efficiency and higher available capacity. The study concludes that buildings with higher capacity have higher impact in CO2 emission [43]. In a new scenario more complete, it is contemplated the solar gains. Resulting higher indoor temperature in spring period until the heating system is not need. It is noticed that the energy flexibility depends also on the boundary conditions and is also time-dependent. The impact of structural thermal energy storage has been studied several times. It is based on the available storage capacity, the efficiency, power shifting capability and the state of the charge. It is compare the building conditions but also the technologies use to provide the energy, as it was described in the previous paragraph. The floors heated buildings have higher efficiency than the rest of the technologies. The thermal storage efficiency conversion is one of the less efficient ways of storage energy, around the 60% comparing with the 90% of the efficiency in batteries[43]. That means thermal storage can be used when heating or cooling are the end-use od energy but reconvert the thermal energy in electrical energy has no sense. However, multiple researches have demonstrated that thermal energy storage can be cost effective and efficient. 2.5. THERMAL AND ELECTRICAL BUILDING ANALYSIS An interactive model reduction methodology is presented on [44] to identify potential trade-offs, it describes the results of a model reduction procedure applied in lumped parameter building energy models. This is the first step towards an automated solution, provides guidance on model complexity and its potentially problem, this research is based on the reduction of these model, trying to reduce it to obtained accurate and fast results of the simulations, the model is an analysis of multi-energy system, with occupancies that demands energy, the objective is get models that would no longer be comparable among themselves. The work done in [44] is the prior step towards a fully automated model reduction tool suitable of providing multi-energy systems researchers with insights in computational trade-offs during the modelling stage. The energy simulation of the virtual representation of the energy process for a building has been developed by Zheng Yang [art 4], a high accuracies related energy consumption in buildings has been gotten, it has been developed a model to calibrate the building energy efficiency under different control strategies, but don not get the entire energy prediction of the energy building demand. 2.6. PRIOR CONCEPTS 2.6.1. ENERGYPLUS Energy Plus is a simulation program used to modelling buildings related with the thermal system, air conditioning and ventilating [45]. Energy Plus is a free professional program designed to describe building conditions and the environment, it is going to be used to compare and simulate different scenarios. That program is used to simulate a building which is going to be analysed, different demand response, strategies and weather. Obtaining the results from the EnergyPlus model. 10 | 71
Available energy flexibility: sensitivity study for
 different climatic conditions

 2.6.2. EFFICIENCY:
The energy efficiency is the comparison between the amount of energy required to use and the amount
of energy waste to provide it, improvements in energy efficiency are generally related with more
efficient technology, improving the energy efficiency is decreasing the energy consumption and the
cost.

 2.6.3. FLEXIBILITY:
The flexibility is the reference between the base consume and the consume after applying a strategy
to reduce it, as much flexibility has a system, as easier is to control the consumption and cost.

 2.6.4. FLEXIBILITY INDICATOR:
There are a lot of ways to quantify the flexibility, the indicator that is going to be used in this research
to analyse the different proposals and how affect the different key points, is defined as[41]:

 AEEF = ∫ | − | {Eq. 2}

AEEF: Available Electrical Energy Flexibility

Pih, flex = is the power consumption in the case when the demand response is being applied.
Pih, ref = is the power consumption in the base case, there is no demand response applying.
To compare easily the individual strategies, apply an analyse, another parameter is going to calculate:

 ∫0 ( − )+
 ɳAEEF = 1 − {Eq. 3}
 | ∫0 ( − )− |

Pflex: power consumption with demand response
Pref: power consumption in the reference case

 2.6.5. COOLING DEGREE DAYS [CDD]
A cooling degree day [CDD in advance] is the energy demand that a building need to cooling [46]. It
is related with the outside temperature and it depends directly on the specific location. CDD is defined
in relation of the energy need to research a temperature cooling the building and assuming that
building need to cool. The reference temperature to obtain the CDD is different depending on the
country and his legislation, for the present research the reference temperature chosen is 24ºC.

 = ∑ =365
 =0 ( − ) {Eq. 4}

 11 | 71
Available energy flexibility: sensitivity study for different climatic conditions 2.7. PROJECT AIMS AND OBJECTIVES: This work is understandable in an electrical grid context. The electrical energy is more and more demanded, and the grid should adapt the load to this demand. But not always is rentable or easy provide this electrical energy. Therefore, a commercial building that can provide some flexibility to the grid can be useful, in the context of decrease the grid peaks. Also, this flexibility can be sold to the grid obtaining economic benefits. The aim of this project is analysed the available electrical energy flexibility that a commercial building can provide to the grid. The study is developed in several weathers to investigate the weather effect on the flexibility that can be provided. It is based in the HCAV system, in concrete, it is analysed the cooling system. Some of the locations included in this project are Reykjavik, Seville, Athens, Dublin and London, with the aim of analyse different weathers. The commercial building profile is obtained from a previous work describe in point 3. With the bases of this commercial building, some strategies are analysed to provide this flexibility and they will be examined on EnergyPlus. It is simulated each strategy for a timestep of 1h, because the load of the grid is variable, and the objectives is providing flexibility just when it is need. Each strategy should be analysed for his applied anytime, 24 simulations should be analysed for each demand response in each location. All the results will be compare in MATLAB. Using demand response strategies is going to provide the flexibility, the main objective of this work is identified the correlation between the demand response strategy and the available flexibility. Another objective is identified how affects the weather to the strategies in order to provide flexibility. Finally, all the strategies in all the locations will be analysed to identify if it is possible. One important point for this project is obtained the flexibility without affect the inhabitants comfort, this is the reason why a comfort analysis should be done. To analyse in a proper way the flexibility that can be provided, two strategies are analysed. The main research aims are identifying, and some questions should be answer through this project: - How affects the weather to the electrical flexibility available? - Which is the effect of each strategy? How is providing each strategy flexibility? - Is possible obtained always electrical flexibility with the same strategy? - Is the comfort compromised if the demand responses are applied? - Is efficient provide to the grid this flexibility? - There is some correlation between weather, strategy and electrical flexibility? 12 | 71
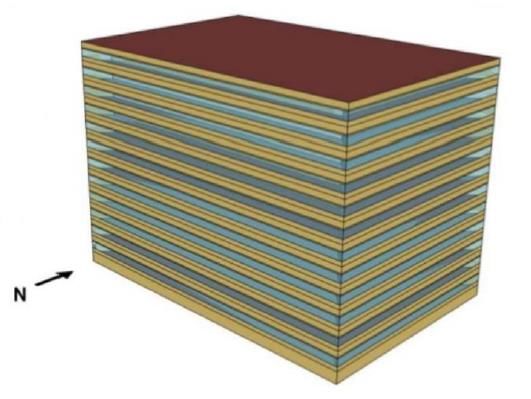
Available energy flexibility: sensitivity study for
 different climatic conditions

 3. PREVIOUS WORK: MODEL

 3.1. REFERENCE MODEL:
The present research is focusing in the analyses of buildings strategies. The goal is obtained a building
that represent the new and existing constructions. Characterizing more than 60% of the commercial
buildings [39]. That model is going to be develop in Energy Plus, using the previous research made
by [41] and detailed in [47] the reference building to compare and analyses each one of the
parameters. The reference model is described as a commercial energy building. The standard model
is developed as a representative and realistic commercial building. Moreover, it is going to be used
as a reference in the research to analyzes technologies, location and optimize designs. This model is
a representative base model to analyse the energy consumption and the flexibility.

 3.1.1. BUILDING DESCRIPTION:
The building model has been developed by [41] in the research which is taken as the previous work,
to keep the results the same building has been taken, it is a commercial building with the references
provided by DOE (Department of Energy) [48] and with the minimum requirements of ASHRAE
standard 90.1-2004[49]. It is simulated in EnergyPlus, the building represents the two thirds part of
commercial building stock in the USA [41]. It is going to be tested in Europe, with the base case of
Dublin, Ireland weather.
The building has12 floors plus a basement with a total area of 46.320 m2. The schedules of the
operation time goes from 6 a.m. to midnight during weekdays and 6.00 a.m. to 5.00 p.m. during
Saturdays, there is not operating during Sundays. The simulation step are 15 minutes.
Because of the complexity and size of the building, some model reductions are performed. The floors
are considered as a box, including five zones, four perimeters and one mid zone each floor, also the
temperature and volume zone is calculated as one.
 Floor Area 46,320 m2
 No. of Floors 12
 Heating Gas Boiler (1,766
 kW)
 Cooling Two water-cooled
 chillers (1,343 kW)
 Air Distribution Multizone variable
 air volume (MZ
 VAV)

 Figure 3: Large office Building

The operation time determinates the internal cooling setpoint temperature in the building for the
summer season is determinate by the summer design days, where:
 13 | 71
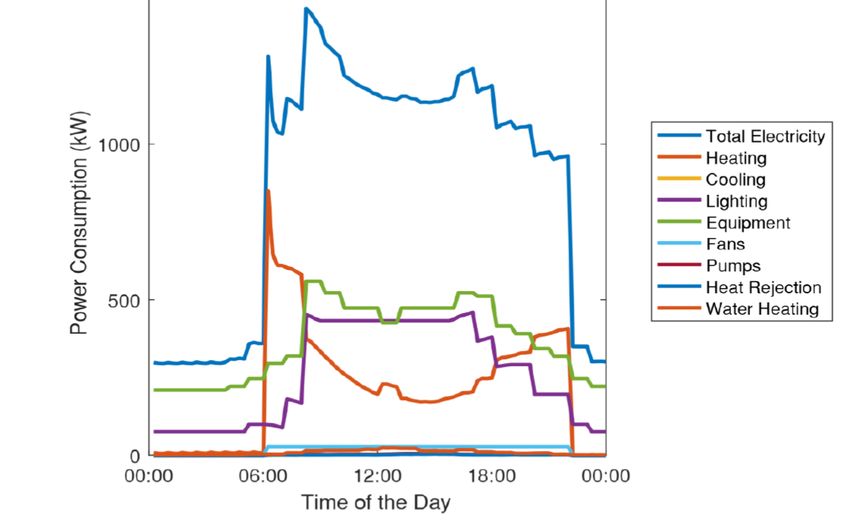
Available energy flexibility: sensitivity study for
 different climatic conditions

 Table 1: Temperature set point in summer season for cooling
 TIME PERIOD TEMPERATURE SET POINT
 0.00 – 6.00 26,7ºC
 6. 00 – 22.00 24ºC
 22.00 - 24.00 26,7ºC

The HVAC system in the building consist in a heating system provided by a gas boiler of 1766kW,
this gas boiler is electrified in the study to offer electricity flexibility. There are two water-cooled
chillers to provide cooling with 1.343kW each one. Also, it counts with a multizone variable air
volume for the air distribution. To simplify the system is going to be consider a Heat-pump as a
combination of heating and cooling systems to analyse and simulate the building.
Once the building has been described it is going to describe the strategies, also known as demand
response (DR). It is developed two average profiles, one for winter and one for summer. The average
winter day (weekday) has a consumption dominated by heating with boiler peak around 6a.m. and a
peak consumption of the building around 8a.m., the average winter load is show in the figure 4:

 Figure 4: average winter daily load profile
For summer, the load profile on the average of hot day (with a max temperature of 24°C) has a peak
because of the chiller (cooling system) around 4.00 to 6.00 pm because of solar gains, the summer
load profile is shown:
 14 | 71
Available energy flexibility: sensitivity study for
 different climatic conditions

 Figure 5: summer day load profile
For both summer and winter days the fan and pump loads are small comparing with the total
consumption. The summer peak is the highest, so the day that is possible to obtain the maximum
electrical flexibility is the hottest day with the highest peak consumption. That means that has also
the highest possible consumption reduction acting in the peak.
But the highest peak doesn’t mean the highest consumption, so the coldest and hottest days
consumption are going to be compare:

 Table 2: End-use electricity consumption
 END -USE ELECTRICITY CONSUMPTION 10TH JULY 20TH JAN
 (KWH) (SUMMER) (WINTER)
 HEATING 65 8348
 COOLING 2977 0
 LIGHTS 6029 6452
 ELECTRICAL EQUIPMENT 8918 8918
 FANS 526 465
 PUMPS 913 16
 HEAT REJECTION 529 0
 WATER SYSTEM 204 247
 TOTAL 20161 24446

Considering the building passive thermal mass as a technology that can provide flexibility. The
adjustment of the thermostat temperature setpoint can be used as a demand response strategy. The
operative temperatures are given by ASHRAE 2004b standard 55 [49]. Also, if the setpoint change
the comfort must be tested.
 15 | 71
You can also read