Avast plc 2018 Half year results - 22 August 2018 - MarketScreener
←
→
Page content transcription
If your browser does not render page correctly, please read the page content below

Avast plc
2018 Half year results

    22 August 2018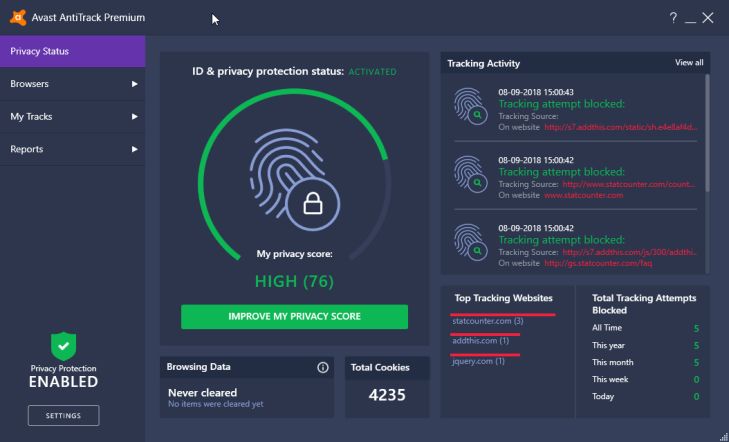
Disclaimer

This presentation has been prepared and issued by, and is the sole responsibility of, Avast plc (“Avast” or the “Company”), being the current holding
company of the Avast group (the “Group”).

The information and opinions presented or contained in this presentation (including forward-looking statements) speak as of the date hereof (unless
otherwise stated) and are subject to updating, revision, verification and amendment without notice and such information may change materially.

This presentation includes forward-looking statements. The words "expect", "anticipate", "intends", "plan", "estimate", "aim", "forecast", "project" and
similar expressions (or their negative) identify certain of these forward-looking statements. These forward-looking statements are statements regarding
the Group’s intentions, beliefs or current expectations concerning, among other things, the Group's results of operations, financial condition, liquidity,
prospects, growth, strategies and the industry in which the Group operates. The forward-looking statements in this presentation are based on
numerous assumptions regarding the Group’s present and future business strategies and the environment in which the Group will operate in the future.
Forward-looking statements are not guarantees of future performance and involve inherent known and unknown risks, uncertainties and contingencies
because they relate to events and depend on circumstances that may or may not occur in the future and may cause the actual results, performance or
achievements of the Group to be materially different from those expressed or implied by such forward-looking statements. Many of these risks and
uncertainties relate to factors that are beyond the Group's ability to control or estimate precisely, such as future market conditions, currency
fluctuations, the behaviour of other market participants, the actions of regulators and other factors such as the Group's ability to continue to obtain
financing to meet its liquidity needs, changes in the political, social and regulatory framework in which the Group operates or in economic or
technological trends or conditions.

All forward-looking statements in this presentation are based upon information known to the Company on the date of this presentation. Accordingly, no
assurance can be given that any particular expectation will be met and readers are cautioned not to place undue reliance on forward-looking
statements, which speak only at their respective dates. Additionally, forward-looking statements regarding past trends or activities should not be taken
as a representation that such trends or activities will continue in the future. Other than in accordance with its legal or regulatory obligations (including
under the UK Listing Rules and the Disclosure Guidance and Transparency Rules of the Financial Conduct Authority), the Company undertakes no
obligation to publicly update or revise any forward-looking statement, whether as a result of new information, future events or otherwise. Nothing in this
presentation shall exclude any liability under applicable laws that cannot be excluded in accordance with such laws.

This presentation does not constitute or form part of any offer or invitation to purchase any securities of any person nor any offer or invitation to sell
or issue, or any solicitation of any offer to purchase or subscribe for, any such securities.

                                                                                                                                                               2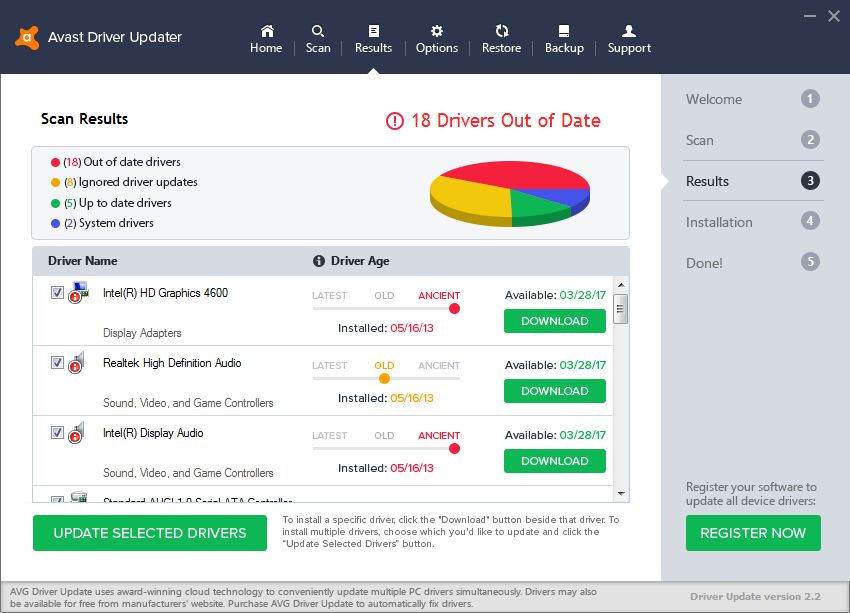
Agenda

1   H1 Highlights: Vince Steckler, CEO

2   H1 Financial Results: Phil Marshall, CFO

3   H1 Business review, Vince Steckler, CEO

4   Q&A

                                               3
1   H1 Highlights:
    Vince Steckler, CEO

                          4
H1 Highlights
• Good results with +8.5% revenue growth(1) to $394m(2) in line with guidance
• Strong growth in billings to $421m(2) driven by our consumer desktop business
• Good performance against desktop operating KPIs, with customers up 2.6% to 11.67m from 11.37m
at 2017 year-end supported by continued expansion from target countries
• Margin expansion benefitting from continued operating leverage, resulting in cash EBITDA of $246m
• Cash generation remained strong supporting debt reduction/deleveraging
• Expansion of product portfolio with multiple new product launches, including Avast Secure Browser, Avast
Anti-Track and Avast Driver Updater; while development of Smart Home, Hack-Check and Family Shield
initiatives continues to progress well
• Admission to trading on the London Stock Exchange on 15 May
• Employee engagement scores continue to strengthen with 90% of employees likely to recommend Avast
as a great place to work
• Full year expectations unchanged except we now see EBITDA margin improvement
Notes:
(1) Growth figures excluding discontinued business and impact of FX, and including Piriform pre-acquisition results in H1 2017 baseline. FX impact calculated by restating H1 2018 actuals to H1 2017 FX rates
(2) Excluding discontinued business 5Good H1 Growth Across All Financial KPI’s
+8.2% +8.5% +25.1%
Billings excluding FX (1) Revenue excluding FX (1) Unlevered FCF (3)
+12.0% at actual rates (2) +9.8% at actual rates (2) Total UFCF $192.2M vs.$153.6M
Led by consumer desktop Led by consumer desktop
$246.4m $222.1m $130.2m
Adj. Cash EBITDA Adj. EBITDA Adj. Net Income
vs. $217.7M H1 FY17(3) vs. $200.9M H1 FY17(3) vs. $111.6M H1 FY17(3)
423bps margin expansion to 61.1% 258bps margin expansion to 55.1% 313bps margin expansion to 32.3%
+13.2% at actual rates (3) +10.6% at actual rates (3) +16.7% at actual rates (3)
Notes:
(1) Growth figures excluding discontinued business and impact of FX, and including Piriform pre-acquisition results in H1 2017 baseline. FX impact calculated by restating H1 2018 actuals to H1 2017 FX rates
(2) Excluding discontinued business and including Piriform pre-acquisition results in H1 2017 baseline 6
(3) 2017 H1 includes Piriform pre-acquisition results. Piriform proforma UFCF assumes 100% conversion of Cash EBITDA to UFCFContinued Strength in Consumer Desktop
Consumer Direct Desktop
EoP customers(1)
($m)
• All key operating metrics in-line with FY guidance
11.37 11.67
• Customer growth driven both by countries with
FY 2017 H1 FY18 existing large customer numbers such as USA and
ARPC(1) UK, plus target countries with smaller customer
($)
numbers such as Japan, Russia, Ukraine and
Argentina
45.35 46.92
• VPN and Utility driven APPC growth through strong
FY 2017 H1 FY18 cross-selling
APPC(1) • Enhancements in machine learning algorithms
(x)
further enhanced campaign conversion rates
• Two new products released with Avast Anti-Track
1.32 1.36 and Avast Driver Updater
FY 2017 H1 FY18
Notes:
(1) Including Piriform pre-acquisition results in H1 2017 baseline
7Strong Product Pipeline
Seven new products released across Avast in H1:
• Avast Secure Browser rolled out to 46 million users(1)
• Avast AntiTrack (top left) protects users’ privacy by
eliminating data trackers and altering digital footprint
• Avast Driver Updater (bottom left), fixes and updates
thousands of drivers for peak PC performance
• A multi-platform version of parental controls, a mobile iOS
security application, and Jumpshot’s on-demand products for
its insights and campaign optimisation solutions
New products being developed for future release:
• Avast Smart Home Security is making great progress for it’s
upcoming stand-alone launch and launch through our
partners
• Avast Secure Web Gateway (SWG) and Secure Internet
Gateway (SIG) SaaS products by year-end 2018
• Avast Hack-Check and Family Shield
Notes:
(1) As at 30 June 2018
8Numerous New Awards and Recognitions
In H1, Avast continued to be consistently rated a top performer by independent reviewers
• Avast Free Antivirus recognized as “Best free antivirus” to protect PCs
in 2018, Expert Reviews
• Avast Security Pro for Mac applauded as “all-round champion” with
highly regarded 4.5 rating. Editor’s Choice bestowed on Avast Free Mac
Security, MacWorld
• Avast and AVG mobile brands awarded top rated products, AV-
Comparatives and Top Product in Av-Test
• HMA! described as “by far the best VPN provider”, Trusted Reviews,
and included in “best mobile VPN services” roundup for 2018, CNET
• Avast Mobile Security recognized for receiving a “perfect AV-Test
score”, Tom’s Guide
• AVG File Server Business Edition and Avast Business Antivirus among
“5 Best Anti-Malware Software Choices” for Small Businesses, Small
Business Trends
• Recognized with the 2018 Global Growth Excellence Leadership Award
for delivering innovations to managed service providers (MSPs), and
focusing on the growing SMB segment, Frost and Sullivan
92 H1 Financial Results:
Phil Marshall, CFO
10Adjusted Billings and Revenue
Adj. Billings
($m)
Change %
H1 2018 H1 2017 (1) Change $ Change %
(excluding FX) (2)
Adjusted Billings 430.2 399.8 30.4 7.6 4.0
Discontinued Operations 9.0 23.6 (14.6) (62.0) (63.2)
Adjusted Billings excl. Discontinued Operations 421.2 376.2 45.0 12.0 8.2
Adj. Revenue
($m)
Change %
H1 2018 H1 2017 (1) Change $ Change %
(excluding FX) (2)
Adjusted Revenue 403.3 382.8 20.5 5.4 4.1
Discontinued Operations 9.0 23.6 (14.6) (62.0) (63.2)
Adjusted Revenue excl. Discontinued Operations 394.3 359.2 35.1 9.8 8.5
Notes:
(1) Includes Piriform pre-acquisition results in H1 2017 baseline
(2) Growth figures excluding discontinued business and impact of FX, and including Piriform pre-acquisition results in H1 2017 baseline. FX impact calculated by restating H1 2018 actuals to H1 2017 FX rates
11Consumer Desktop Led H1 Billings Growth
Growth %
+12.4% +2.2% +5.0% (14.0)% +8.2%
excluding FX (1)
$45.0m $45.0m
$1.4m
$2.4m
$(3.8)m
Consumer Direct Consumer Direct Consumer Indirect SMB Group
Desktop Mobile (ex.Discontinued Business) (ex.Discontinued Business)
Segment
73% 9% 10% 7% 100%
% of total (2)
Notes:
(1) Growth figures excluding discontinued business and impact of FX, and including Piriform pre-acquisition results in H1 2017 baseline. FX impact calculated by restating H1 2018 actuals to H1 2017 FX rates
(2) Total group excluding discontinued business, numbers rounded to the nearest whole number 12Consumer Desktop Led H1 Revenue Growth
Growth %
+12.6% +2.4% +3.6% (7.6)% +8.5%
excluding FX (1)
$34.4m $35.1m
$1.2m
$1.9m
$(2.4)m
Consumer Direct Consumer Direct Consumer Indirect SMB Group
Desktop Mobile (ex.Discontinued Business) (ex.Discontinued Business)
Segment
73% 9% 10% 7% 100%
% of total (2)
Notes:
(1) Growth figures excluding discontinued business and impact of FX, and including Piriform pre-acquisition results in H1 2017 baseline. FX impact calculated by restating H1 2018 actuals to H1 2017 FX rates
(2) Total group excluding discontinued business, numbers rounded to the nearest whole number 13Adjusted Revenue by Segment
H1 2017 H1 2018
Discontinued business Discontinued business
$24M $9M
SMB 6% SMB 2%
$34M $32M
9% 8%
H1 2017 H1 2018
$383m(1) $403m
$362M
$325M 90%
85%
Consumer
(ex.Discontinued Consumer
business) (ex.Discontinued
business)
Notes:
(1) 2017 includes Piriform pre-acquisition results in H1 2017 baseline
14Increasing Deferred Revenue Balance Supporting Future Growth
Adj. Deferred Revenue ($m)
428
> 1 year
49
11%
380 • Growing deferred revenue balance (up +12.6%)
supporting attractive future revenue growth
52 14%
• Good future revenue visibility through $379m of
deferred revenue to be recognized within the next
12 months.
379 ≤1 year
89%
328 86%
H1 2017 H1 2018
Notes:
Adjusted deferred revenue represents the balance of deferred revenue excluding the effects of the fair value revaluation of the acquiree’s pre-acquisition deferred revenues and the impact of gross-up adjustment
15Quarterly Billings and Revenue Performance
Adj. Billings Performance ($m) (2) Adj. Revenue Performance ($m) (2)
12.5%(1)
3.8%(1) 7.8%(1)
9.3%(1)
221.2
200.1 194.6 199.7
187.6 188.6 182.5
176.7
2017 2018 2017 2018 2017 2018 2017 2018
Q1 Q2 Q1 Q2
Q1 YoY billings strength from cross-sell campaigns & price increase carry-over effect from Q2 2017
Q2 YoY underlying billings growth impacted by WannaCry bump a year earlier
Notes:
(1) Growth figures excluding discontinued business and impact of FX, and including Piriform pre-acquisition results in H1 2017 baseline. FX impact calculated by restating H1 2018 actuals to H1 2017 FX rates
(2) Excluding discontinued business, including Piriform pre-acquisition results in H1 2017 baseline 16Market Leading EBITDA% Performance
Adj. EBITDA
($m)
H1
Segments 2018 Margin 2017(1) Margin Margin variance
Consumer (excl. Discontinued Business) 269 74.4% 234 71.9% 245bps
SMB 14 42.0% 13 38.9% 301bps
Discontinued Business 9 100.0% 24 100.0% 0bps
Overhead (70) n/a (70) n/a n/a
Group 222 55.1% 201 52.5% 258bps
• Consumer benefitting from high levels of revenue growth/operating leverage
• SMB focus on pricing & efficiencies, offsetting volume softness
• Overhead investment offset by AVG acquisition synergies
• Strong H1 margin performance benefiting, as expected, by AVG integration synergies which are heavily weighted to H1
Notes:
(1) 2017 includes Piriform pre-acquisition results in H1 2017 baseline 17Growth & Synergies Driving Margin Expansion
H1
Adj. EBITDA Margin % Comment
H1 2017 Actual(1) 201 52.5%
Revenue growth 28 285bps Strong revenue growth led by consumer desktop
Discontinued Business (15) (160)bps Decline as expected, with heavily weighted first half impact
Heavily weighted first half impact benefiting from carry-
Synergies 25 624bps
over impact of synergies from AVG acquisition
Positive FX impact on revenue outweighed by negative
FX impact (2) (121)bps
impact on costs due to large portion of costs in CZK
Investment / Other (15) (370)bps Continued investment in medium-term strategic initiatives
H1 2018 Actual 222 55.1%
Notes:
(1) 2017 includes Piriform pre-acquisition results in H1 2017 baseline 18Exceptional Items
Exceptional items, share-based compensation and amortization of acquisition intangibles ($m)
H1 FY18 H1 FY17
Share-based compensation (4) (4)
Amortization of acquisition intangibles (65) (65)
Acquisition & Integration (Restructuring) Costs (4) (16)
IPO costs(1,2) (19) -
Exceptional operating costs (23) (16)
Unrealized FX gain/loss on EUR tranche of bank loan 17 (37)
Tax impact of IP transfer 94 -
Tax impact of COGS deferral adjustment (0) (1)
Tax impact of adjusting items 14 41
Tax impact of FX gain/loss on intercompany loans 9 (11)
Exceptional finance and tax income/(expense) 135 (8)
Notes:
(1) Costs as per income statement exclude additional $4.0m IPO expenditures recorded directly to equity
(2) Additional $4.1m IPO costs were recognized in the income statement in 2017 19Strong Cash Flow Generation
uFCF
($m)
H1 2018 H1 2017(1)
A• Limited CAPEX needs, c. 2-3%
Adj. EBITDA 222 201 of adj. revenue H2 weighted
Adj. EBITDA to Adj. Cash EBITDA(2) 24 17 B• Increase in cash tax driven, as
expected, by CZK tax true-up
Adj. Cash EBITDA 246 218
system on prior year profits that
A Capex (5) (8) occurs in H1 following year
B Cash Tax (49) (35) C• WC positively impacted by IPO
payables, H2 reversal
C Change in Working Capital(3) (0) (21)
D• Lower interest due to repricing
Unlevered FCF 192 154
and voluntary loan repayment,
Cash Conversion(4) 78% 71% as highlighted at IPO
Cash Interest and Lease Repayments (38) (40) • 2018 dividend approx. 40% of
levered free cash flow (15 May –
D Levered FCF 154 114
31 December) payable in May
2019
Notes:
(1). Includes Piriform pre-acquisition results in H1 2017 baseline. Piriform proforma UFCF assumes 100% conversion of Cash EBITDA to UFCF
(2) Change in deferred revenue and deferred COGS as well as reversal of COGS deferral adjustments.
(3). Change in working capital excludes change in deferred revenue and deferred COGS as these are already included in Adj.Cash EBITDA 20
(4). uFCF Conversion defined as uFCF / Adj. Cash EBITDAContinued De-leveraging Post IPO
Net Debt ($m) Cash EBITDA Leverage(1)
• Undrawn liquidity: $85m revolver
(20.3)% (0.9)x • USD debt tranche ($887m)
hedged at 2.75% for 3 month
USD LIBOR(2)
• Deleveraging in H1 using $200m
IPO primary proceeds and
additional voluntary loan
1,639 3.6x repayment of $100m bringing pro-
1,306
2.7x
forma adj. cash EBITDA leverage
at IPO to 3.0x
• EBITDA leverage per banking
covenant 3.0x (versus 3.9x at
Dec-17)
Dec-17 Jun-18 Dec-17 Jun-18
Notes:
(1) Leverage calculated as x Adj. Cash LTM EBITDA (Adj. Cash EBITDA includes full year Piriform results).
(2) 93% of the USD debt tranche hedged. As of 30 June 2018, the 3-month USD LIBOR is capped at 2.75% p.a. for a notional amount of $821.3 million 213 H1 Business review:
Vince Steckler, CEO
22Strong H1 Consumer Desktop Growth
Adj. Billings ($m) Adj. Revenue ($m)
12.4%(1)
12.6%(1)
• Double digit growth due to continued cross-
selling of VPN and Utility products, plus further
expansion of the customer base
• Customer growth driven both by countries with
existing large customer numbers such as USA
308.4 and UK, plus target countries with smaller
281.0
263.4 customer numbers such as Japan, Russia,
246.6
Ukraine and Argentina
• Consumer Direct Desktop is on track to deliver
low double digit revenue growth excluding FX in
2018
H1 FY17 H1 FY18 H1 FY17 H1 FY18
% of total (2) 70% 73% 69% 71%
Notes:
(1) Growth figures excluding discontinued business and impact of FX, and including Piriform pre-acquisition results in H1 2017 baseline. FX impact calculated by restating H1 2018 actuals to H1 2017 FX rates
(2) Total group excluding discontinued business, numbers rounded to the nearest whole number 23Steady Performance in Consumer Mobile
Adj. Billings ($m) Adj. Revenue ($m)
2.2%(1) 2.4%(1)
• Double digit growth in Subscriptions due to
relaunched products, high renewal rates and
growth in VPN
• Carrier billings declined as expected due to
Sprint loss. Future performance is set to benefit
from new carrier relationships
41.8 43.3 41.6
40.4
• Expect to launch new products with major US
and European carriers in H2
• Consumer Direct Mobile on track to be broadly
flat for the full year excluding FX in 2018
H1 FY17 H1 FY18 H1 FY17 H1 FY18
% of total (2) 11% 10% 11% 11%
Notes:
(1) Growth figures excluding discontinued business and impact of FX, and including Piriform pre-acquisition results in H1 2017 baseline. FX impact calculated by restating H1 2018 actuals to H1 2017 FX rates
(2) Total group excluding discontinued business, numbers rounded to the nearest whole number 24Steady Performance in Consumer Indirect
Adj. Billings ($m) (2) Adj. Revenue ($m) (2)
• Jumpshot is driving growth of the segment
5.0%(1) 3.6%(1)
through its continued expansion program,
delivering growth rates in-line with historic rates,
anchored by partnerships with multiple Fortune
100/500 companies
• Declines in mobile advertising due to GDPR
related impacts
39.4 39.6
37.0 37.7
• Consumer Indirect is on track to deliver mid-
single digit revenue growth excluding
discontinued business and FX in 2018
H1 FY17 H1 FY18 H1 FY17 H1 FY18
% of total (3) 10% 9% 10% 10%
Notes:
(1) Growth figures excluding discontinued business and impact of FX, and including Piriform pre-acquisition results in H1 2017 baseline. FX impact calculated by restating H1 2018 actuals to H1 2017 FX rates
(2) Excluding discontinued business
(3) Total group excluding discontinued business, numbers rounded to the nearest whole number
25SMB Integration Efforts Ongoing
• The SMB business was softer than expected
Adj. Billings ($m) Adj. Revenue ($m)
primarily due to weakness in partner distribution
as a result of ongoing integration disruption, and
tightening of credit controls and previous
discounting. Margins, however, have expanded
(14.0)%(1) (7.6)%(1)
as we maintained a disciplined pricing approach
and cost controls
• On track to launch the initial phase of our new
ordering and billing system by the end of the year
to improve the ease of doing business for our
33.9 34.5 partners
32.2
30.1
• Zscaler secure web gateway product under
development and due to launch end of 2018
• We now expect SMB revenue in FY18 to decline
H1 FY17 H1 FY18 H1 FY17 H1 FY18 high single-digit excluding FX, versus the mid-
% of total (2) 9% 7% 10% 8% single digit decline previously guided
Notes:
(1) Growth figures excluding discontinued business and impact of FX, and including Piriform pre-acquisition results in H1 2017 baseline. FX impact calculated by restating H1 2018 actuals to H1 2017 FX rates
(2) Total group excluding discontinued business, numbers rounded to the nearest whole number 26Summary and Guidance
• H1 performance in line with full year guidance
• Underlying market dynamics remain supportive of growth outlook
• Key initiatives progressing well reflected in desktop customer expansion and average products per
customer
• Robust product pipeline, further launches expected in H2
• Further deleveraging occurred through our strong cash conversion, with scope to reduce further in H2
• Reaffirm Group’s 2018 full year guidance
• Growth is expected to be sustained in the second-half, led by the consumer desktop business
• Revenue high single-digit growth excluding discontinued business and FX
• Tracking well against full year operating KPIs
• Full year margin guidance improvement due to operational improvements
• EBITDA margin now flat to slightly increasing
27Appendix
Key financial assumptions

                                                                                                          Full year 2018 guidance

                                                                                                                                           Prior guidance           Current guidance

Depreciation & Amortization                                                                                                          c. 3% of Adj. Revenue   c. 2-3% of Adj. Revenue

Capital Expenditure                                                                                                                  c. 3% of Adj. Revenue   c. 2-3% of Adj. Revenue

Interest Cost and Lease Repayments                                                                                                   $82m P&L / $68m CF        $84m P&L / $71m CF

Effective Tax Rate                                                                                                                                   20%                       No change

Cash Tax                                                                                                                                  P&L tax + $10m                       No change

Net Working Capital (1)                                                                                                                      $25m outflow                      No change

Exceptional Items

• Debt fees                                                                                                                            $3m P&L / $3m CF                        No change
• IPO fees                                                                                                                          $25m P&L(2) / $30m CF    $19m   P&L(2,3)   / $27m CF
• Integration/restructuring costs                                                                                                      $5m P&L / $9m CF                        No change

 Notes:
 (1).Excludes change in deferred revenue and deferred COGS; includes only change in accounts receivable and accounts payable
 (2).Additional $4.1m already recognized in 2017
 (3).Excluding additional $4.0m direct share issue expenses recorded to equity                                                                                                      29
Foreign exchange rates trend (X-rates to US Dollar)
2018 Q1 2018 Q2 Spot
Currency YoY % YoY%
average average rates*
AUD 0.79 3.8% 0.76 0.9% 0.74
BRL 0.31 (3.2)% 0.28 (10.6)% 0.27
CAD 0.79 4.8% 0.78 4.3% 0.77
CZK 0.05 22.8% 0.05 12.5% 0.05
EUR 1.23 15.4% 1.19 8.5% 1.16
GBP 1.39 12.4% 1.36 6.5% 1.30
Notes:
(1) Spot rates per 6 Aug 2018
30Historical Revenue Trend
2015-2016
2017 (1) 2018 (1)
average (1,2)
$m 155 158 163 168 177 182 188 194 195 200
24% 25% 25% 26% 24% 25% 25% 26%
H1 H2 H1 H2
49% 51% 49% 51%
Stable revenue trend, immaterial seasonality…revenue typically builds through the year into 4Q being largest quarter
Full year revenue guidance for 2018 remains unchanged
Notes:
(1) Excluding discontinued business
(2) 2015-2016 excluding Piriform pre-acquisition results. 31Historical Billings Trend
2015-2016
2017 (1) 2018 (1)
average (1,2)
$m 164 156 164 175 188 189 192 205 221 200
25% 24% 25% 26% 24% 25% 25% 26%
H1 H2 H1 H2
49% 51% 49% 51%
Immaterial H1/H2 seasonality…although quarterly billings are influenced by campaign activity (2Q in 2017 and 1Q in 2018)
Notes:
(1) Excluding discontinued business
(2) 2015-2016 excluding Piriform pre-acquisition results. 32Non-GAAP Metrics - Reconciliation
H1 ($m) H1 FY18 H1 FY17
Revenue 388.6 294.0
Net deferral of revenue 41.6 95.9
Billings 430.2 389.9
Piriform pre-acquisition billings - 9.9
Adjusted Billings 430.2 399.8
H1 ($m) H1 FY18 H1 FY17
Revenue 388.6 294.0
Deferred revenue haircut reversal 11.9 69.8
Gross-up adjustment 1.1 8.9
Piriform revenue adjustment (pre-acquisition) 1.7 10.1
Adjusted Revenue 403.3 382.8
H1 ($m) H1 FY18 H1 FY17
Operating profit 109.7 36.3
Share-based payments 4.4 3.6
Exceptional items 22.5 16.2
Amortisation of acquisition intangible assets 65.0 65.2
Underlying Operating profit 201.6 121.3
Depreciation (excl. exceptional depreciation) 6.4 7.6
Amortisation of non-acquisition intangible assets 1.4 2.0
COGS deferral adjustment (0.9) (6.0)
Deferred revenue haircut reversal 11.9 69.8
Piriform pre-acquisition EBITDA 1.7 6.1
Adjusted EBITDA 222.1 200.9
Net change in deferred revenues including FX re-translations 29.7 26.2
Net change in deferred cost of goods sold (4.6) (15.1)
Reversal of COGS deferral adjustment 0.9 6.0
Piriform pre-acquisition net change in deferred revenue (1.7) (0.2)
Adjusted Cash EBITDA 246.4 217.7
33Non-GAAP Metrics - Reconciliation
H1 ($m) H1 FY18 H1 FY17
Net income 160.2 (51.6)
Deferred Revenue Haircut Reversal 11.9 69.8
Share-based payments 4.4 3.6
Exceptional operating items 22.5 16.2
Amortisation of acquisition intangible assets 65.0 65.2
Unrealized foreign exchange gain/loss on EUR tranche of bank loan (17.4) 36.7
COGS deferral adjustments (0.9) (6.0)
Tax impact from FX difference on intercompany loans (9.4) 11.3
Tax impact of COGS deferral adjustments 0.2 1.5
Tax impact of IP transfer (94.4) -
Tax impact on adjusting items (13.7) (41.2)
Piriform pre-acquisition Net Income 1.7 6.0
Adjusted Net Income 130.2 111.6
34Profit & Loss Statement
H1 ($m) H1 FY18 H1 FY17(1)
Adjusted Billings 430 400
Adj. Billings to Adj. Revenue(2) (27) (17)
Adjusted Revenue 403 383
Adjusted Costs (181) (182)
Adjusted EBITDA 222 201
Adj. EBITDA to Adj. Cash EBITDA(3) 24 17
Adjusted Cash EBITDA 246 218
Adjusted D&A (8) (10)
Adjusted Finance Costs (52) (45)
Adjusted Tax (33) (34)
Adjusted Net Income 130 112
Adjusted EPS (in $ per share)
Basic EPS 0.15 0.13
Diluted EPS 0.14 0.12
Notes:
(1) Includes Piriform full year results
(2) Includes net change in deferred revenue including FX re-translations and Gross-up adjustment
(3) Change in deferred revenue and deferred COGS as well as reversal of COGS deferral adjustments
35Statutory Profit & Loss Statement
H1 ($m) H1 FY18 H1 FY17
Revenues 388.6 294.0
Cost of revenues (120.6) (110.6)
Gross profit 268.0 183.4
Sales and marketing (58.6) (56.0)
Research and development (33.1) (36.7)
General and administrative (66.6) (54.4)
Total operating costs (158.3) (147.1)
Operating profit 109.7 36.3
Analysed as:
Underlying Operating profit 201.6 121.3
Share-based payments (4.4) (3.6)
Exceptional items (22.5) (16.2)
Amortisation of intangible assets acquired through business combinations (65.0) (65.2)
Finance income and (expense), net (34.3) (82.1)
Profit / (loss) before tax 75.4 (45.8)
Income tax 84.8 (5.8)
Profit / (loss) for the financial period 160.2 (51.6)
Earnings/(losses) per share (in $ per share):
Basic EPS 0.18 (0.06)
Diluted EPS(1) 0.17 (0.06)
Notes:
(1) As the result of the Group is a loss for the relevant period, options are considered antidilutive and therefore there is dilutive effect.
36Cash Flow Statement
H1 ($m) H1 FY18 H1 FY17
`
Profit for the period 160.2 (51.6)
Non-cash adjustments to reconcile profit to net cash flows:
Income tax (84.8) 5.8
Depreciation 6.4 8.0
Amortisation 66.4 67.2
Loss on disposal of property, plant and equipment - 0.1
Movement of provisions and allowances (1.8) (15.0)
Interest expense, changes of fair values of derivatives and other non-cash financial expense 48.5 51.5
Shares granted to employees 4.4 3.6
Effect of exchange rate changes on cash and cash equivalents held in foreign currencies (1.2) 2.5
Unrealized foreign exchange gains and losses and other non-cash transactions (19.5) 32.6
Working capital adjustments:
(Increase)/ decrease in trade and other receivables (12.6) (22.6)
Increase/ (decrease) in trade and other payables 8.2 (13.7)
Increase in deferred revenue 41.3 96.1
Income tax paid (49.4) (34.8)
Net cash flows from operating activities 166.1 129.7
Cash flows from investing activities
Acquisition of property and equipment (4.0) (3.9)
Acquisition of intangible assets (1.0) (4.1)
Investment in subsidiary, net of cash acquired - (38.9)
Restricted cash - 0.4
Interest received - 0.1
Net cash used in investing activities (5.0) (46.4)
Cash flows from financing activities
Proceeds from the issue of shares 199.8 -
Transaction costs related to the issue of shares (4.0) -
Exercise of options - 1.0
Repayment of borrowings (341.7) (21.5)
Proceeds from borrowings - 78.5
Transaction costs related to borrowings (3.1) (2.2)
Interest paid (36.5) (39.0)
Lease repayments (1.5) (0.5)
Net cash flows from financing activities (187.0) 16.3
Net increase/ (decrease) in cash and cash equivalents (25.9) 99.6
Effect of exchange rate changes on cash and cash equivalents held in foreign currencies 1.2 (2.5)
Cash and cash equivalents at the beginning of period 176.3 240.7
Cash and cash equivalents at the end of period 151.6 337.8
37You can also read