BACKGROUND STUDY Climate protection and energy efficiency in the transport sector - The case of Japan - adelphi
←
→
Page content transcription
If your browser does not render page correctly, please read the page content below
BACKGROUND STUDY
Climate protection and energy
efficiency in the transport sector –
The case of Japan
Jana Narita, adelphi
With support from: Thorsten Koska, Wuppertal Institute; Nicole Plewnia,
German Chamber of Commerce and Industry in Japan; Feres Mezghani,
adelphi

June 2018

      In cooperation with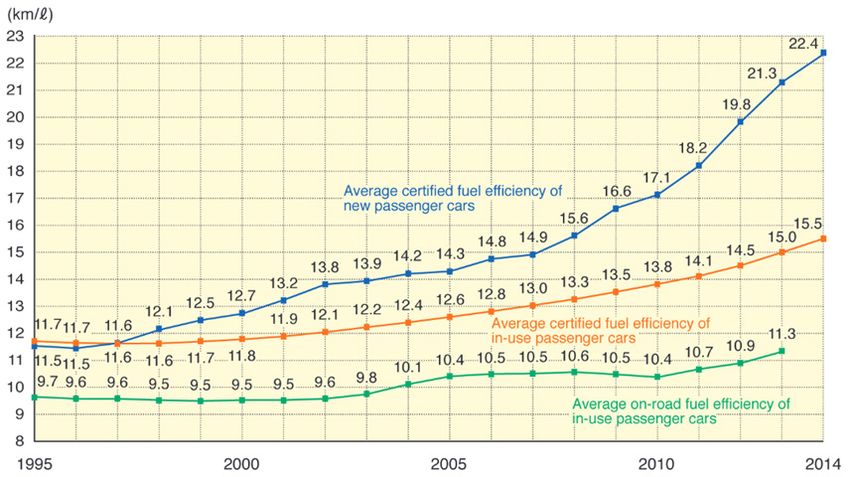
This study was compiled in the frame of the project "Supporting the Energy Dialogue with
Japan and Supporting the Bilateral Energy Relations with Korea" on behalf of the Federal
Office of Economic Affairs and Export Control (BAFA) and was prepared on request of
Division IIA1 of the Federal Ministry for Economic Affairs and Energy (BMWi).

The responsibility for the content lies exclusively with the authors.

Imprint

Publisher:           adelphi
                     Alt-Moabit 91
                     10559 Berlin
                     T: +49 (030) 8900068-0
                     E: office@adelphi.de
                     W: www.adelphi.de
Author:              Jana Narita

Support from:        Thorsten Koska, Wuppertal Institute
                     Nicole Plewnia, German Chamber of Commerce and Industry in Japan
                     Feres Mezghani, adelphi
Contact:             narita@adelphi.de

Layout:              adelphi

Photo credits:       Cover: morelimages – shutterstock.com

Status:              June 2018

© 2018 adelphi
adelphi                                                                                        I

Abstract

Japan is considered as a pioneer in the development and dissemination of new drive
systems such as hybrid and battery electric vehicles and fuel cell vehicles. Furthermore, the
Japanese fuel economy is one of the best worldwide and the share of railways for passenger
transport is much higher than in many other developed countries.
The objective of this background study is to provide an in-depth overview and critical
analysis of Japanese concepts and activities for climate protection and energy efficiency in
the transport sector and derive recommendations for the Japanese-German energy
dialogue.
Therefore, in a first step, some background data on the structure, GHG emissions and
energy consumption of the transport sector in Japan is presented and the relevant
stakeholders from policy, industry and research in the field of transport and sustainable
mobility are introduced.
The study then gives a comprehensive overview of Japanese policy objectives, strategies
and measures with respect to climate protection and energy efficiency in the transport sector
including the promotion of fuel efficiency, the dissemination of environmental friendly
vehicles, measures in freight transport as well as policies for increasing public transportation
and cycling.
The next chapter sets the Japanese developments into international context and in particular
carries out a comparison to the German transport sector and activities of the German
government. In the last part, potential topics for Japanese-German energy dialogue are
derived.
adelphi                                                                             II

Contents

1 Background data on the transport sector in Japan                                   1

1.1 Structure of the transport sector                                                1
1.2 GHG emissions and energy consumption in the transport sector                     4
1.3 Main stakeholders in the transport sector in general and with respect to
sustainable concepts and technologies                                                5

2 The role of the transport sector in political strategies for climate protection
  and energy supply                                                                  7

3 Policies and measures                                                             10

3.1 Emission standards, fuel efficiency standards and the Top Runner Program        10
3.2 Promoting the dissemination of next-generation vehicles                         13
3.3 Promotion of traffic demand management and ITS                                  17
3.4 Promotion of eco-driving                                                        18
3.5 Expansion of the high-speed rail network (Shinkansen)                           19
3.6 Promotion of light-weight vehicles (Kei-cars)                                   20
3.7 Optimizing logistics                                                            20
3.8 Public transportation and cycling policies                                      22
3.9 Other policies and measures                                                     24

4 Japans activities in the global context and comparison to Germany                 25

4.1 Evaluation in the global context                                                25
4.2 Comparison to Germany                                                           28

5 Summary and recommendations for Japanese-German dialogue                          33
adelphi                                                                                   III

List of Figures

Figure 1: Modal split (transport volume) in passenger and freight transport in Japan in
          2014                                                                             1
Figure 2: Motor vehicles stock and new registrations                                       2
Figure 3: CO2 emissions in transport in Japan                                              4
Figure 4: Development of average fuel efficiency of passenger cars                        12
Figure 5: Development of next-generation vehicles in new car sales between 2007
          and 2015 (in % of total new car sales)                                          15
Figure 6: Concept of the Eco-commuting Promotion Action Program                           23
Figure 7: Battery electric cars and plug-in hybrid electric cars, stock by country        27
Figure 8: Modal split (transport volume) in passenger and freight transport in Germany    28
Figure 9: Emissions in transport in Germany                                               29
adelphi                                                                      IV

List of Tables

Table 1: CO2 emissions in transport by transportation mode in 2015 (in kt)    5
Table 2: Distribution of regulatory authority                                 5
Table 3: Estimated emissions of energy-originated CO2 in million t CO2        7
Table 4: Share of next-generation vehicles in total car sales                 8
Table 5: Japanese fuel efficiency standards                                  11
Table 6: Tax breaks for eco-friendly passenger cars for the FY 2018          14
Table 7: Transport statistics for Japan and Germany                          31
adelphi                                                                 V

List of Abbreviations

AI        Artificial intelligence
ANRE      Agency for Natural Resources and Energy
ASPIRE    Asia and Pacific Initiative to Reduce Emissions
BEV       Battery electric vehicle
BRT       Bus Rapid Transit
CDO       Continuous Descent Operation
CEM       Clean Energy Ministerial
CO2       Carbon dioxide
ECCJ      Energy Conservation Center Japan
EDMS      Eco-Driving Management System
ETC       Electronic Toll Collection
EU        European Union
EV        Electric vehicle
EVI       Electric Vehicles Initiative
FCV       Fuel cell vehicles
FY        Fiscal Year
GHG       Greenhouse gas
HEV       Hybrid electric vehicle
ICT       Information and Communication Technology
INDC      Intended Nationally Determined Contribution
ITPS      Institute for Transport Policy Studies
ITS       Intelligent Transport Systems
JAF       Japan Automobile Federation
JAMA      Japan Automobile Manufacturers Association
JARI      Japan Automobile Research Institute
JITI      Japan International Transport Institute
JPY       Japanese yen
JR        Japan Railways
JRTT      Japan Railway Construction, Transport and Technology Agency
JTRI      Japan Transport Research Institute
LNG       Liquid national gas
adelphi                                                                                VI

LRT        Light Rail Transit
METI       Ministry of Economy, Trade and Industry
MLIT       Ministry of Land, Infrastructure, Transport and Tourism
MoE        Ministry of the Environment
Mtoe       Mega tonne oil equivalent
NALETEC National Agency for Automobile and Land Transport Technology
NEDO       New Energy and Industrial Technology Development Organization
PHEV       Plug-in hybrid electric vehicle
PNLTES     Post New Long-Term Emission Standards
PRILIT     Policy Research Institute for Land, Infrastructure, Transport and Tourism
R&D        Research and development
RNAV       Area navigation
toe        Tonne oil equivalent
TTG        Transport Task Group
USD        United States Dollar
VICS       Vehicle Information and Communication System
WHTC       World Harmonized Transient Cycle
WLTP       Worldwide Harmonized Light Vehicles Test Procedure
adelphi                                                                                     001

1 Background data on the transport sector in
  Japan

This chapter gives an overview of the structure of the Japanese transport sector including
figures for modal split in passenger and freight transport, the development of CO2 emissions
and energy consumption in the transport sector as well as the main stakeholders of the
sector.

1.1   Structure of the transport sector

Figure 1 shows the modal split in 2014 in passenger and freight transport in Japan. Motor
vehicles for private use account for around 60% of passenger transport volume, railways for
29% and aviation for around 6%. In freight transport motor vehicles also have the greatest
share with 51%, while coastal shipping accounts for 44% and railways for only 5% of the
transport volume. In total, 1,428,500 million passenger km and 422,900 million ton km have
been travelled in 2014 (Ohta et al. 2015). With a population of about 127 million inhabitants
(The World Bank 2017), passenger transport volume is around 11,248 km per capita.

Figure 1: Modal split (transport volume) in passenger and freight transport in
          Japan in 2014

Source: Own depiction based on data from Ohta et al. (2015)

Japan has a well-developed road and rail network, which has to face special challenges due
to the topographical features of the country with its high shares of mountains. The transport
infrastructure is concentrated mainly in and between the urban areas of the Pacific Coast
such as Tokyo, Nagoya and Osaka (Fraunhofer IAO 2018). According to the Global
Competitiveness Report of the World Economic Forum, Japan occupies top positions
regarding the transport infrastructure. Out of 137 countries, Japan ranks at place 2 for the
quality of railway infrastructure, place 6 for the road quality, place 21 for the quality of port
infrastructure and 26 for the quality of air transport infrastructure (Schwab 2017).

1.1.1 Road transport and automotive industry
                                                                                    th
With a total length of roadways of approximately 1.22 million km, Japan ranks 6 worldwide
regarding the total length of roadways. In comparison, the roadways in Germany add up to
adelphi 002
around 0.83 million km. However, Japan expressways have a total length of 8,428 km, while
expressways in Germany in total are 12,993 km long (CIA 2018; BMVI 2017a). The
topographic situation of Japan with a great share of mountains that necessitate narrower
streets could be a reason for the smaller amount of expressways.
With about 9 million vehicles produced in 2016, Japan is the third largest automobile
manufacturer worldwide after China and the United States (OECD and iea 2017). The
automotive industry is one of the most important industries of Japan. 17.8% of all shipments
income comes from this industry and 8.7% of the total work force works in businesses
related to motor vehicles. There are 14 motor vehicle manufacturers; the largest ones are
Toyota, Honda and Nissan (Ohta et al. 2015). For passenger vehicles these three
manufacturers together have a market share of 75% in the Japanese market (Fraunhofer
IAO 2018).
The number of registered motor vehicles has been over 75 million since 2005 and is still
increasing each year, mainly due to growth of the passenger car stock. The stock of trucks
has been decreasing since 1993. The development of the motor vehicle stock and newly
registered motor vehicles for the last seven years is shown in Figure 2.
The passenger car market in Japan is dominated by gasoline cars, while diesel cars only
have a small share (Yang and Bandivadekar 2017). Hybrid electric vehicles currently make
up a share of around 31% in new car sales and electric and plug-in electric vehicles about
1.2% (Tanaka 2018).
Figure 2: Motor vehicles stock and new registrations
Motor vehicles stock Motor vehicles new registrations
motor vehicles stock (total)
100.000 10.000 motor vehicles new
registrations (total)
thousands
thousands
passenger car stock
80.000 8.000 passenger car
registrations
60.000 6.000
40.000 4.000
20.000 2.000
0 0
1990
2010
2011
2012
2013
2014
2015
2016
1990
2010
2011
2012
2013
2014
2015
2016
Source: Own depiction based on data from JAMA (2017)
1.1.2 Rail transport and public transport
The preferred mean of passenger transport in Japan beside motor vehicles is the train - for
short as well as for long distances. All large cities are connected to the 2,630 km high-speed
rail (Shinkansen) network (AHK Japan and VDI/VDE-IT 2014; MLIT 2015a).
The railway share in passenger transport volume in Japan is much higher in comparison with
many western countries. It declined over several decades due to a shift from rail to motor
vehicle transportation, before rebounding in the 2000s. Recently, it is getting close to its
peak of the early 1990s again, probably because of the boost of the Shinkansen which
connects distant cities in very short times (Lipscy and Schipper 2013). Rail transport inadelphi 003 Japan is very punctual in comparison with other countries, such as Germany. One reason is the consistent separation of the high-speed network from regional and freight rail transport. The total length of the railway network is 27,311 km and thus shorter than the German network with 43,468 km (CIA 2018). The expansion of the network in Japan is very time consuming and expensive due to the topographical conditions, i.e. land restrictions. In 1987, the Japanese Government started to divide and privatize the Japanese National Railway. Today, most trains are operated by the Japan Railways (JR) Group that consists of six passenger operating companies (JR Hokkaido, East, Central, West, Shikoku, Kyushu), a nationwide freight operating company (JR Freight) and one company for research and IT- services, respectively (Railway Technical Research Institute and Railway Information System/ JR System) (Ohta et al. 2015). JR East, Central and West have been in full private ownership since 2005 and JR Kyushu since 2016, while JR Hokkaido, JR Shikoku and JR Freight are still owned by the Japan Railway Construction, Transport and Technology Agency (JRTT), an independent administrative institution of the government (JRTT 2016). Regarding short distance travel, public transport systems are of great importance in Japan’s urban areas. For instance, the metropolitan area of Tokyo has the largest public transport network in the world. It is connected by 158 suburban railway and subway lines with over 4700 route kilometres and a total of 2200 stations. 40 million passengers are carried every day not including the long-distance trains (Neidhart 2017). 1.1.3 Shipping The Japanese coastline is 29,751 km long and is intensively used for freight transport (CIA 2018). 44% of freight transport volume is processed by coastal shipping. Traditionally coastal shipping was the most important mean for freight transport with a share of nearly 50% until the fiscal year 1985 when it was overtaken by motor vehicles. Coastal shipping, thus, could play an important role for modal shift activities to reduce greenhouse gas (GHG) emissions (Ohta et al. 2015). The merchant marine, i.e. ships engaged in the carriage of goods, consisted of 5,289 ships in 2017. Thereby, Japan is on rank 3 worldwide. Germany for instance, only has 614 ships in the merchant marine (CIA 2018). Three major ocean shipping companies account for around 70% of the total Japanese income in ocean shipping: Nippon Yusen Kaisha, Kawasaki Lines and MO Lines (Ohta et al. 2015). In the period from 2005 to 2014, the Japanese merchant fleet carried constantly around 10% of the global marine cargo volume. Furthermore, the Japanese shipbuilding industry has with 20% and 27 billion USD of sales the third largest share on the world market. The number of shipbuilding orders to Japanese companies has been increasing since 2013. Reasons are amongst others the development of energy efficient technologies and the global standardization of these technologies (Mori 2016). 1.1.4 Aviation Passenger activity by airplane increased rapidly from 19.1 billion passenger km in 1975 to 84.1 billion passenger km in 2014 (Lipscy and Schipper 2013; Ohta et al. 2015). This is around 6% of the passenger transport volume whereby travel activity to foreign countries is not included. There are 82 airports that together process about 2.2 million take-offs and landings each year. In 2014, the air transport sector contributed to Japanese GDP by a gross value added of around $55 billion (Oxford Economics 2016). The two major domestic airline companies are All Nippon Airways and Japan Airlines.
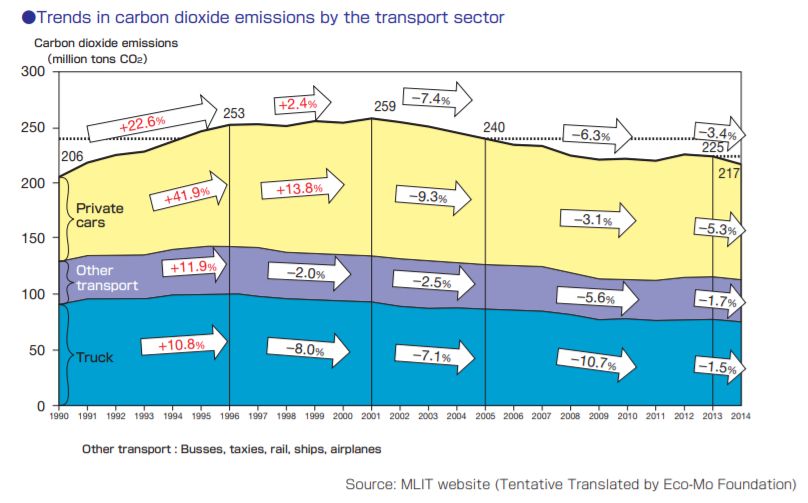
adelphi                                                                                    004

1.2   GHG emissions and energy consumption in the transport sector

In 2016, 18.8% of total CO2 emissions in Japan originated from the transport sector, i.e. 215
million tons of CO2 (preliminary figure). Compared to 2005, CO2 emissions in the transport
sector have declined by 11.9% while total CO2 emissions went down only by 5.2% (MoE
2018). However, recent emission values are still higher than values in 1990 as can be seen
in Figure 3. The figure shows the development of total CO2 emissions in transport in Japan
between 1990 and 2014. Important reasons for the emission reduction that started in the
early 2000s are the increase in vehicle fuel efficiency and a higher efficiency in freight
transport, i.e. truck transport. CO2 emissions from trucks have been decreasing due to a
reduction in total distances travelled, a shift from privately-owned trucks to freight services,
the adoption of eco-driving by fleet operators and higher fuel efficiency (JAMA 2016a).

Figure 3: CO2 emissions in transport in Japan

Source: Eco-Mo Foundation (2017)
adelphi 005
Table 1 shows the CO2 emissions by transportation mode. Motor vehicles for freight and
passenger transport comprise together 86% of total CO2 emissions in the transport sector.
Therefore, further improvements in fuel efficiency and changes in the usages of freight and
passenger vehicles are crucial to achieve significant CO2 emission reductions.
Table 1: CO2 emissions in transport by transportation mode in 2015 (in kt)
100.120 46.9%
Private motor vehicles
39.940 18.7%
Cargo vehicles
36.330 17.0%
Cargo vehicles (privately owned)
4310 2%
Busses
3070 1.4%
Taxis
9.900 4.6%
Aviation
10.510 4.9%
Coastal shipping
9.160 4.3%
Railways
Source: Own depiction based on data from MLIT (2017c)
The total final energy consumption in Japan in 2015 was 291.3 Mtoe. Final energy
consumption in transport accounted for 71.3 Mtoe (24.5%) whereby 98% came from oil
products and the rest from electricity and natural gas (iea 2017b). Between 2004 and 2014,
final energy consumption in transport declined by 12.1% (iea 2016a).
1.3 Main stakeholders in the transport sector in general and with
respect to sustainable concepts and technologies
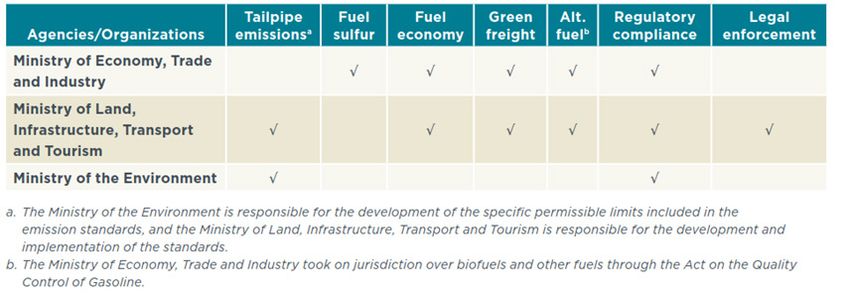
In Japan, three ministries share the responsibility for the transport sector: The Ministry of
Land, Infrastructure, Transport and Tourism (MLIT), which has the main responsibility for
developing transport related policies, the Ministry of Economy, Trade and Industry
(METI), and the Ministry of the Environment (MoE). The distribution of regulatory authority
with respect to energy efficiency and emission reduction policies focused on road transport is
summarized in Table 2.
Table 2: Distribution of regulatory authority
Source: Du and Miller (2017)adelphi 006 Other governmental institutions related to the transport sector are the Japan Transport Safety Board, an agency under the auspices of the MLIT, and the Agency for Natural Resources and Energy (ANRE) under the METI. The National Agency for Automobile and Land Transport Technology (NALTEC) is a technical agency that carries out compliance procedures for emissions standards and works on emission tests for vehicle type approval (Yang et al. 2017). Furthermore, the Japan Railway Construction, Transport and Technology Agency (JRTT) is an independent administrative institution of the state that undertakes construction and technical support projects for railway and other transportation. The New Energy and Industrial Technology Development Organization (NEDO) as one of the largest public research and development management organizations in Japan is an incorporated administrative agency since 2003. NEDO concentrates on addressing energy and environmental problems and enhancing industrial technology development and is also a relevant stakeholder with respect to (sustainable) transportation, i.e. electric vehicles, batteries and fuel cell technology (NEDO 2017). Several research institutes focus on transport issues. The Japan Transport Research Institute (JTRI) is an independent, non-profit foundation which was established under the auspices of the MLIT. It undertakes research and survey programs on transport related topics, evaluates transport policy and gives recommendations to the Japanese government. It comprises the Institute for Transport Policy Studies (ITPS), the Japan International Transport Institute (JITI) and the Research and Consulting Office (JTRI 2012). The Policy Research Institute for Land, Infrastructure, Transport and Tourism (PRILIT) was established in 2001 under the MLIT and is committed to promote the policies of MLIT from mid- to long-term perspective, carrying out research on the usage, development and maintenance of the resources in the areas land, infrastructure, transport and tourism. Thereby it takes into account socio-economic changes (PRILIT 2016). Other relevant research institutes are the Japan Automobile Research Institute (JARI) which has the research areas environment & energy, safety and IT & electronics (JARI 2018) and the Japan Research Center for Transport Policy which performs surveys and research on transportation policies and holds forums, workshop, lectures and other events (The Japan Research Center for Transport Policy 2016). Regarding relevant stakeholders in industry, the Japan Automobile Manufacturers Association (JAMA) established in 1967 is a non-profit industry association which includes Japan's fourteen manufacturers of passenger cars, motorcycles, buses and trucks (Toyota, Nissan, Honda, Mitsubishi, Suzuki, Mazda, Subaru, Isuzu, Kawasaki Heavy Industries, Yamaha Motor Company etc.). The JAMA supports the development of Japan’s automotive industry amongst others with respect to the development of sustainable mobility (JAMA 2016b). For sustainable transport JAMA suggests an integrated approach that involves the development and diffusion of next-generation vehicles including fuel-cell, electric, plug-in hybrid and clean diesel vehicles, the further performance improvement of conventional international combustion engines as well as the support of fuel-conserving eco-driving and measures to improve traffic flow (JAMA 2016a). The Japan Automobile Industries Association (JAIA) is a public corporation which aims at the development of the automobile importing trade by compiling statistics, providing information on import of foreign vehicles, improving trade conditions and cooperating with government agencies (JAIA 2018).
adelphi                                                                                   007

2 The role of the transport sector in political
  strategies for climate protection and energy
  supply

As shown in Table 3, Japan pledges in its Intended Nationally Determined Contribution
(INDC) to reduce total CO2 emissions by 25% in fiscal year 2030 compared to the fiscal year
2013 (the pledge for total GHG emissions is 26% respectively). The target for CO2 emissions
in the transport sector is a reduction of around 28%. For reaching this target, the government
plans to reach further improvements in fuel efficiency and promote next-generation vehicles.
Other measures comprise traffic flow improvement, promotion of public transport, modal
shift, energy efficiency improvement of railways, aviation and ships, and the promotion of
eco-driving, automatic driving, car-sharing and Intelligent Transport Systems (ITS) (UNFCCC
2015).

Table 3: Estimated emissions of energy-originated CO2 in million t CO2

                                    Estimated               Actual              Actual
                                 emissions of each      emissions in FY     emissions in FY
                                 sector in FY 2030           2013                2005
 Energy originated CO2                   927                  1,235               1,219

    Industry                             401                   429                 457

    Commercial and other                 168                   279                 239

    Residential                          122                   201                 180

    Transport                            163                   225                 240

    Energy conversion                     73                   101                 104

Source: Own depiction based on UNFCCC (2015)

The Plan for Global Warming Countermeasures was decided in May 2016. It describes
the emissions reduction targets of the Japanese government, provides basic information on
measures to be taken by the public and private sector as well as the policies to be
implemented by the national and local governments (MoE 2016b). Regarding the
transportation sector the plan emphasizes, amongst others, the ongoing promotion of the
diffusion of next-generation vehicles, financial support for research on increasing the
durability of batteries for electric vehicles and financial support for increasing the
infrastructure of hydrogen stations. Furthermore, measures to improve traffic flow, the
promotion of public transport and of low carbon logistics as well as measures for modal shift
and the improvement of the infrastructure for bicycles are part of the plan (MoE 2016c).
The Global Environment Committee of the Central Environment Council furthermore
published the Long-term Low Carbon Vision 2050 in March 2017 which is used by the
MoE as a basic principle for the reduction of GHG emissions in the long term. This vision
formulates ways for reducing GHG emissions by 80% in 2050 and includes amongst others
a future vision of the Japanese society for the transport sector. According to this vision, in
2050 fuel efficiency is greatly increased and most passenger cars have an electric motor
adelphi 008
with low-carbon electric power and hydrogen generated by renewables. Autonomous driving
is in practice and reduces emissions by eco-friendly driving and automatic selections of
routes without congestion. Also ride- and car-sharing are largely used. Energy efficiency in
railroads, aircraft and ships is increased and in freight transport travel distances are
shortened and loading rates are improved. Urban structures are compacter increasing the
convenience of public transport (Global Environment Committee 2017).
The first Basic Plan on Transport Policy was approved by the Cabinet in February 2015
and comprises the period until FY2020. The Basic Plan follows the Basic Act on Transport
Policy (enacted in 2013) which defines the basic policy direction of the national government
in the transport sector comprising international, national and regional transport and specifies
the responsibilities of the parties involved (Eco-Mo Foundation 2017). The Basic Plan
describes targets and measures for the three basic directions of transport policies: 1. Realize
user-friendly transport, 2. Build up interregional and international passenger transport and
logistic networks that build a foundation for growth and prosperity, 3. Create a foundation of
sustainable, secure and safe transport. Targets that concern sustainability aspects are the
vitalization of public transport services, the encouragement of sustainable transport services
and usage of bicycles and the reduction of CO2 emissions from transport and energy
conservation for instance by a further increase of next-generation vehicles and green
logistics (MLIT 2016).
Within the Next-Generation Vehicle Strategy (2010) the Japanese government sets targets
concerning the share of next-generation vehicles in total car sales by 2030. “Next-generation
vehicles” comprise hybrid electric vehicles (HEV), battery electric vehicles (BEV), plug-in
hybrid electric vehicles (PHEV), fuel cell vehicles (FCV) and clean diesel vehicles. As shown
in Table 4, the government aims to increase the share of these vehicles to 50-70% by
implementing measures for creating initial demand, developing the infrastructure and
supporting research and development (R&D) to improve performance (Maruyama 2014).
Reaching the targeted share of 20-30% for BEV and PHEV is expected to be especially
challenging; their share in 2017 was still below 2% (Oba 2016; Tanaka 2018). Nevertheless,
their number has been steadily increasing since 2009 reaching an amount of 151 thousand
vehicles in 2016 (iea 2017a).
Table 4: Share of next-generation vehicles in total car sales
2017 (Status) 2020 (Target) 2030 (Target)
Conventional Vehicles (gasoline- 30-50%
63.97% 50-80%
powered)
Next Generation Vehicles 36.02% 20-50% 50-70%
Hybrid vehicles 31.2% 20-30% 30-40%
Electric vehicles 0.41% 20-30%
15-20%
Plug-in hybrid vehicles 0.82%
Fuel-cell vehicles 0.02% ~1% ~3%
Clean diesel vehicles 3.52% ~ 5% 5-10%
Source: Own depiction based on data from Tanaka (2018); Maruyama (2014)adelphi 009
The Strategic Roadmap for Hydrogen and Fuel Cells was formulated in 2014 by the
“Council for a Strategy for Hydrogen and Fuel Cells“ and describes a comprehensive
strategy towards a “hydrogen-based society”. The strategy comprises R&D support for
stationary fuel cells and FCVs and the development and installation of the necessary
infrastructure such as hydrogen stations. Targets for FCVs are set as follows: 40,000 by
2020, 200,000 by 2025 and 800,000 by 2030. About 160 hydrogen stations are planned to
be constructed by 2020, about 320 by 2025 and 900 by 2030 (METI 2016; ICCT 2017). In
particular until mid-2020, the government will be proactively involved in the implementation
of the Strategic Roadmap and will provide comprehensive financial support. Afterwards,
development is planned to continue by proactive efforts of the private sector (Shinka 2014).
The Basic Hydrogen Strategy was formulated in 2017 after the second meeting of the
Ministerial Council on Renewable Energy, Hydrogen and Related Issues took place in
December 2017. The first meeting was held in April 2016 after Prime Minister Abe requested
relevant ministers to formulate a basic strategy for hydrogen-related policies by the end of
2017 to encourage the government to unite its efforts for the accomplishment of a world-
th
leading hydrogen-based society. The strategy is an addition to the 4 Strategy Energy Plan
(2014) and the Strategic Roadmap for Hydrogen and Fuel Cells. The focus lies on the
individual introduction and dissemination of relevant hydrogen technologies as introduced in
the roadmap, the role of hydrogen as a new carbon free energy option and further on the
development of policies agreed on by the whole government apparatus (all related ministries
ranging from hydrogen production to utilization are involved). Further, the government
1
decided on specific measures and milestones that shall be achieved until 2030.
In addition, the Tokyo Metropolitan Government formulated a regional roadmap for hydrogen
and fuel cells which sets the following targets for the Tokyo Olympics in 2020: 35 hydrogen
stations, 6,000 fuel cell passenger vehicles, 100 fuel cell buses and 150,000 residential fuel
cell systems (ICCT 2017).
The General Outline Plan on Logistics is published every 5 years. The newest one
describes measures in logistics for the period FY 2017- FY2020. To address environmental
concerns and achieve CO2 emission reductions the plan comprises the following measures
(MLIT 2017b):
- Improvements of energy efficiency in the supply chains
- the support of partnerships between consignor and transportation companies to induce
modal shift (pointing out the importance of shipping)
- CO2 reduction in ports, airports and warehouses for instance, by energy efficient cooling
- the avoidance of traffic jams by traffic demand management using Information and
Communication Technology (ICT) and Artificial Intelligence (AI) and by using different
fees on expressways and
- the promotion of liquid national gas (LNG)- ships.
1
A summary of the keypoints of the basic hydrogen strategy can be found here :
http://www.meti.go.jp/english/press/2017/pdf/1226_003a.pdfadelphi 010
3 Policies and measures
This chapter summarizes the most important policy measures of the Japanese government
for the reduction of emissions and energy use in the passenger and freight transport sector.
3.1 Emission standards, fuel efficiency standards and the Top Runner
Program
With respect to tailpipe emission standards Japan is one of the leading countries among
the G20 economies together with Canada, the EU and the US (Du and Miller 2017). Limit
values for tailpipe emissions for new vehicles are determined by the MoE under the Air
Pollution Control Law. First emission limits for light-duty vehicles were introduced in the
1970’s and tailpipe emission standards have been strengthened three times since 2000 with
the last amendment in 2009-2010 leading to the “Post New Long-Term Emission Standards”
(PNLTES) for light duty (passenger vehicles and light trucks < 3.5 t) and heavy duty vehicles
(trucks and buses > 3.5 t). The PNLTES comply in stringency with Euro VI standards and
2
apply for all new vehicles since 2010 . For certification testing, Japan-specific drive cycles
have been used in the past. However, since 2016, the World Harmonized Transient Cycle
(WHTC) is applied for heavy duty vehicles and emissions of light duty vehicles will be tested
with the Worldwide Harmonized Light Vehicles Test Procedure (WLTP) from 2018
(TransportPolicy 2018c).
To improve the fuel efficiency of vehicle fleets and thereby contribute to emission reductions
the introduction of minimum energy performance standards is an important measure. Japan
introduced fuel efficiency standards for passenger vehicles in the 1980s as the second
country worldwide after the United States (GFEI 2014), Furthermore, Japan defined
efficiency standards for heavy-duty vehicles in 2006 as the first country worldwide (iea
2016b).
The fuel efficiency standards are under the scope of the Top Runner Program which was
introduced in 1999 in the frame of the Energy Conservation Act to improve the energy
efficiency of products, inter alia of passenger and freight vehicles. Based on the product with
the highest energy efficiency currently on the market in the respective product group, the
program sets target standard values for energy efficiency (in case of motor vehicles “fuel
efficiency”) for multiple years in the future that must be adhered to on a weighted average by
product manufacturers. Thereby, target values for vehicles exist for different categories
which are based on fuel type and weight classes (iea 2016b; METI 2015c). In case the
standards are not met in the target year, penalties for manufacturers such as public
announcements and fines exist, however, the penalty procedure is relatively loose (Maeda
2007).
2
The NOX emission limit for diesel heavy duty vehicles was tightened in 2016.adelphi 011
The Top Runner Program furthermore supports consumers to select vehicles with high fuel
efficiency by attaching stickers to the vehicles with respective information (MLIT 2015c).
(Lipscy and Schipper 2013) summarizes the following advantages of the Top Runner
Program:
• Standards are feasible as they are based on existing products.
• Standards are likely to be strict enough because they are continuously updated based
on the most efficient products.
• Long negotiations with the industry are not necessary and the opportunity for industry
lobbying is reduced. The implementation of the program happens generally
automatically without large political interference.
On the other hand, the program does not encourage efficiency improvements by weight
reduction because different target values exist depending on the weight class. Furthermore,
the detailed division in a large number of weight classes could also be motivated by the idea
to build a barrier against competitors from other countries (Lipscy and Schipper 2013).
The procedure of determining new fuel efficiency standards (Top Runner Standards), based
on the vehicles with the highest performances on the market, includes several closed
meetings of METI, MLIT and the car industry. The achieved agreement is then discussed in
the “Council” that comprises a subcommittee of the Transport Policies Council and a working
group on classification standards for automobiles under the Advisory Committee for Natural
Resources and Energy. The Council agreement is published and opened for public
consultation before it becomes the new fuel efficiency standard (Iguchi and Hillman 2012;
METI 2017b).
Table 5 summarizes the Japanese fuel efficiency standards since 2015 for light-duty and
heavy-duty vehicles. Values show the estimated average fuel efficiency that is reached when
the targets in the different weight classes are met.
Table 5: Japanese fuel efficiency standards
Fuel efficiency Corresponding GHG emission
standard standard in gCO2/km
passenger cars 16.8 km/l 142 g/km (Yang and
Bandivadekar 2017)
2015 light trucks ≤ 15.2 km/l
3.5 t
Light-duty
Small busses 8.9 km/l
vehicles
2020 passenger cars 20.3 km/l 122 g/km (Yang and
Bandivadekar 2017)
2022 light trucks ≤ 17.9 km/l 133 g/km (Yang and
3.5 t Bandivadekar 2017)adelphi 012
Fuel efficiency Corresponding GHG emission
standard standard in gCO2/km
Trucks 7.09 km/l 370 g/km (TransportPolicy
2018a)
2015
Buses 6.30 km/l 416 g/km (TransportPolicy
2018a)
Heavy-
2025 (as Trucks 7.63 km/l
duty
proposed in
vehicles
Dec 2017; Buses 6.52 km/l
(>3.5 tons)
new
standard is
expected in
April 2018
after public
consultation)
Source: Own compilation based on TransportPolicy (2018b, 2018a); Yang and Bandivadekar (2017);
METI (2017c)
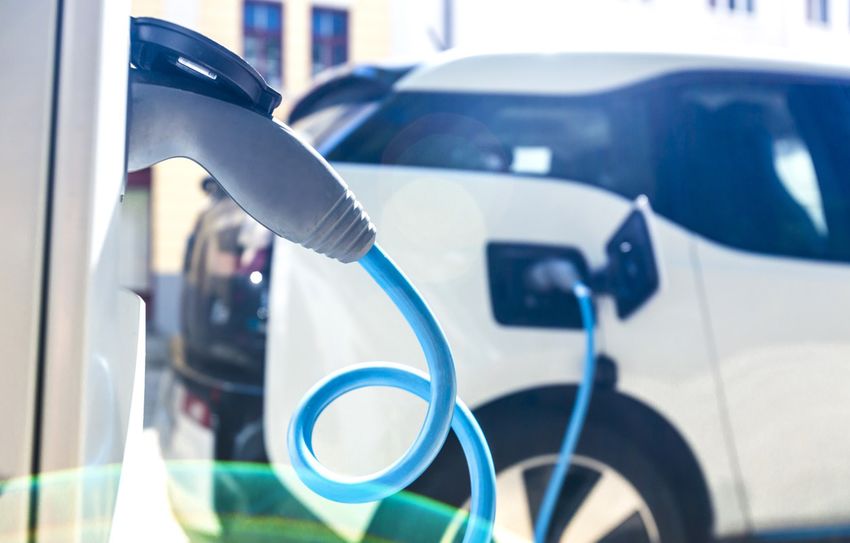
Figure 4 shows the development of the average fuel efficiency of passenger cars from 1995
to 2014. Fuel efficiency for passenger car improved by 48.8% between the fiscal years 1995
and 2010. This increase was higher than the initially expected 22.8% (METI 2015c) and can
be mainly attributed to the rapidly growing HEV market. The fuel efficiency target for 2015 for
passenger vehicles was already achieved in 2011 and the 2020 target in 2013 (Yang and
Bandivadekar 2017). Post 2020 fuel efficiency standards for passenger vehicles are under
discussion since March 2018 (METI 2018).
For freight vehicles, fuel efficiency improved by 13.2% between FY 1995 and 2010 (METI
2015c).
Figure 4: Development of average fuel efficiency of passenger carsadelphi 013
Source: JAMA (2016a)
3.2 Promoting the dissemination of next-generation vehicles
The government promotes the purchase of next-generation vehicles by offering tax breaks
since 2009. Tax breaks are available for the motor vehicle taxes tonnage, acquisition and
ownership and the level of tax reduction depends on the type and the fuel efficiency of the
vehicle (iea 2016b; Kuramochi 2014) “The more eco-friendly the vehicle, the higher is the
tax” break. The tax breaks were originally thought to end by March 2012 but were extended
several times. One reason for the extension was the support of domestic sales of the
Japanese automotive industry to make up for the losses in the global market that occurred
due to the appreciation of the yen (Alhulail and Takeuchi 2014; iea 2016b).
Fuel efficiency requirements for the tax exemption have been tightened over time (Nikkei
Asian Review 2016).The current tax break scheme is valid until March 2019. While BEV,
PHEV and HEV, for instance, are fully exempted from the acquisition tax, there are also tax
reductions (to a smaller degree) for gasoline vehicles with high fuel efficiency values. As
example the tax exemptions for passenger cars for the FY 2018 are shown in Table 6.
The Japanese government additionally supports the purchase of next-generation vehicles by
providing purchase subsidies. Starting with the phase from 4/2009 to 9/2019 there have
been several periods of purchase subsidy provision with different underlying conditions and
subsidy amounts depending on the environmental performance of the vehicle. For instance,
3
in 2011 the maximum subsidy amount for BEV and PHEV was 1 million JPY per vehicle. In
2012, the grant covered up to 50% of the price difference between a BEV or PHEV and a
corresponding conventional vehicle (Frieske et al. 2015).
Statistical evaluations of the tax break and subsidy programs for the period 2006 to 2013
show an increase in sales figures for next-generation vehicles by around 16% because of
the tax break policy, and an increase by 21.5% for the first subsidy wave and by 10.7% for
the second subsidy wave (Alhulail and Takeuchi 2014). The Japan Center for Economic
Research found for FY2009 that the tax breaks and subsidy programs only contributed to
CO2 reductions of 0.1% of total national CO2 emissions with specific mitigation costs of
4
56,000 JPY per t CO2 (Kuramochi 2014).
The most recent purchase subsidy scheme was introduced in 2016 in order to especially
foster the dissemination of BEV. It provides gradually higher subsidies with an increase in
the electric range of the vehicle. Thereby, the maximum subsidy amount is set at 850,000
5
JPY . The BEV Nissan Leaf with a 30-kWh battery, for instance, gets a subsidy amount of
6
330,000 JPY . After introducing the subsidy scheme the sales of BEVs increased by nearly
50% while the sales of PHEVs, which typically have smaller electric ranges, decreased by
34%. However, there might have been other factors that influenced this market development
such as the introduction of the new Nissan Leaf and the falsification of fuel economy
standards by Mitsubishi in 2016 (iea 2017a).
3
Around 8333 EUR, assuming an exchange rate of 1 EUR = 120 JPY
4
Around 467 EUR, assuming an exchange rate of 1 EUR = 120 JPY
5
Around 7083 EUR, assuming an exchange rate of 1 EUR = 120 JPY
6
Around 2750 EUR, assuming an exchance rate of 1 EUR = 120 JPYadelphi 014
Table 6: Tax breaks for eco-friendly passenger cars for the FY 2018
applicable period: motor vehicle acquisition tax (acquisition tax): 01.04.2018 – 31.03.2019; motor vehicle weight tax (weight tax): 01.05.2018 – 30.04.2019
applicable content: Limited to new vehicle registration within the applicable period
subject & requirements tax items special measures
- electric vehicle acquisition tax tax free
- fuel-cell vehicle
initial tax free
- natural gas vehicle inspection
weight
- Plug-in-Hybrid tax st
1 follow-up tax free
- Green diesel car examination
Fuel efficiency fuel economy standard fuel economy standard (FY 2020)
(FY 2015)
Emission +5
compliant +10% compliant +10% +20% +30% +40% 50%
performance %
- Gasoline 75% reduction from
powered acquisition tax -20% -40% -60% -80% tax free
2005 Emission
car Standard or
- LPG initial
50 % reduction from -25% -50% -75% tax free
vehicle inspection
2018 Emission weight
(Hybrid Standard are eligible tax st
included) 1 follow-up Tax
examination free
Source: Translated from MLIT (2017a)adelphi 015
To promote the dissemination of electric vehicles the METI furthermore developed the "EV /
PHEV Towns" demonstration project. Starting in 2009, in total 18 prefectures were selected
as EV / PHEV demonstration areas which were supported in the four priority areas: 1.
creation of demand; 2. development of infrastructure; 3. education and public awareness; 4.
Evaluation and improvements. Various initiatives were implemented and supported by
special subsidies, such as the usage of electric vehicles as rental cars, taxis buses or
company cars. In addition, local governments are actively raising public awareness through
exhibitions, test drive events and the dissemination of information through websites (Frieske
7
et al. 2015).
The development of next-generation vehicles in total car sales between 2009 (when the first
tax break and subsidy schemes were introduced) and 2017 is illustrated in Fehler!
Ungültiger Eigenverweis auf Textmarke.. The share of these vehicles has increased
steadily and has reached 36% in 2017. Thereby, the majority of sold next-generation cars
are HEVs (METI 2018).
Figure 5: Development of next-generation vehicles in total car sales between
2009 and 2017 (in % of total new car sales)
40%
35,6% 36,0%
35% 32,3%
30%
25,6%
25% 23,2%
21,2%
20%
16,4%
15% 12,0%
11,0%
10%
05%
00%
2009 2010 2011 2012 2013 2014 2015 2016 2017
Source: Own depiction based on METI (2018)
7
Detailed descriptions of the activities in the 18 demonstration prefectures can be found here http://www.cev-
pc.or.jp/event/pdf/evphvtown_report2013_en.pdfadelphi 016
Infobox: Development of BEV and FCV and charging infrastructure
In Japan, the main initiation and development of HEVs, BEVs and FCVs has been made
by the automakers. The Japanese government did never promote HEVs directly apart
from offering purchase subsidies starting in 1999 after the market introduction of the first
models. BEVs and FCVs have been supported more intensely however, for instance, by
the promotion of the electric charging and hydrogen infrastructure. Furthermore, in 2004,
the automakers asked the government for basic research work support for FCVs. Indirect
factors also supported the technology development such as the high competition on the
domestic market as well as the long national support for battery research and
development (not only for vehicles but also other technologies) (Pohl 2012). In the
following, the development and status quo of BEV and FCV is explained in more detail
also pointing out the respective support policies of the government.
For BEV and PHEV, in addition to purchase subsidies and tax incentives (see Chapter
3.2) the Japanese government also supports the development and expansion of the
charging infrastructure. 50-66% of the investment costs for a fast-charging stations and
its installation are subsidized. In Japan, a manufacturer-independent standard plug for
fast charging stations, the CHAde-MO plug, was introduced relatively early which led to a
rapid spread of these charging stations. Additionally, Nippon Charge Service LLC, a
company jointly established in 2014 by the car manufacturers Toyota, Nissan, Honda and
Mitsubishi, is driving forward the development and expansion of the charging network
(Fraunhofer IAO 2018).
By 2016, the electric car stock (BEV and PHEV) in Japan was around 151,000 vehicles
and 17,260 slow charging units and 5,990 fast charging units had been installed across
the country (iea 2017a).
As written in Chapter 2, the Japanese government aims to increase the share of FCVs in
total vehicle sales to 1% in 2020 and 3% in 2030. The target is to have 40,000 FVC on
the streets until 2020 and 800,000 until 2030. About 160 hydrogen stations are planned
to be constructed by 2020, about 320 by 2025 and 900 by 2030. The transition to
hydrogen for the vehicle fleet is part of a comprehensive strategy for a “hydrogen-based
society” which aims to transform all energy sectors to hydrogen.
The Japanese government provides around 350 million USD per year for the
development and implementation of hydrogen and fuel-cells and therewith more
subsidies than every other state. (For comparison: the United States invest around 125
million USD, Germany around 85 million USD and France around 40 million USD) (Heid
et al. 2017). Regarding hydrogen mobility, the financial support specifically is used for
(ICCT 2017):
• The construction of hydrogen stations. They are subsidized up to two thirds of
“initial capital expense”.
• Reducing the price of hydrogen. The hydrogen fuel is subsidized such that the
price is reduced to 10 USD per kilogram because station fuel revenues are not
expected to offset the costs for the next years.
• The purchase of FCV. Purchase tax breaks and subsidies are offered for next-
generation vehicles (also see Chapter 3.2).
Additionally, the city of Tokyo has set up a fund of 40 billion JPY (around 333 million
EUR) for the period 2016-2020 to promote FCV, fuel cell busses and the implementation
of the hydrogen infrastructure (Tokyo Metropolitan Government 2017)adelphi 017 Infobox: Development of BEV and FCV and infrastructure (continued) As of April 2018, 100 hydrogen stations had been constructed in Japan (Ohira 2018) and by April 2017 about 1,700 FCVs had been sold (LeSage 2017). The installation of hydrogen stations has been focused on the four metropolitan areas Tokyo Aichi, Osaka and Fukuoka and over a third of the stations are mobile, i.e. tube trailers (ICCT 2017). Especially regarding the number of FCV the gap between the actual figure (1,700 vehicles) and the targeted values (40,000 FCV by 2020) is still large. Toyota first started FCV development in 1992 with Honda following in 1994 and Nissan in 2000. Demonstration vehicles were developed by all three automakers and in 2009 the first deliveries of the FCX Clarity of Honda took place (Pohl 2012). In 2015, Toyota introduced the production model Mirai into the market that has a range of about 400 km under real conditions. Until mid of 2017, only 3,600 Toyota Mirai had been sold on the global market showing that FCV are still a niche market. In addition to passenger cars, Toyota is currently also researching and testing the suitability of fuel cell drives for trucks and buses. Honda manufactured the FCX Clarity, a FCV in small series, since 2008 to test the technology in everyday life. Finally, in 2016, the Honda Clarity Fuel Cell followed as a mass-production model, which can be leased in Japan and the USA (Fraunhofer IAO 2018). Takeshi Uchiyamada, Chairman of Toyota Motor Corporation is also Co-Chair of the Hydrogen Council which was set up during the World Economic Forum in 2017 and is committed to driving forward the global energy transition through hydrogen and hydrogen-based vehicles (Fraunhofer IAO 2018). The council is made up of 18 leading energy, transport and industry companies, amongst others, Honda, BMW, Audi, Kawasaki and Daimler (Hydrogen Council 2018). Japan H2 Mobility was established in February 2018, as a collaboration of automotive companies, hydrogen stations owners and operators as well as financial investors. The company aims at accelerating the development of the hydrogen station network in Japan. Therefore, next to the strategic deployment of hydrogen stations, it also addresses topics as standardization of equipment to reduce the costs for hydrogen construction (JHyM 2018). 3.3 Promotion of traffic demand management and ITS Several traffic flow measures are being implemented to improve the traffic flow and therewith reduce CO2 emissions. Measures promoted by the government include the development of ring roads and other arterial road networks to reduce through traffic in city centres, the improvement of the infrastructure for cyclists (cycle paths) and the implementation of ITS. ITS integrate people, roads, and vehicles using the latest ICT, thereby enabling an intelligent use of roads, the reduction of congestion and thus emissions as well as an increase of the safety of drivers and pedestrians by the avoidance of accidence (MLIT 2015c). Targets of the government are to reduce traffic congestion on major roads by 50% in 2020 compared to 2010 and to reduce fatalities to less than 2,500 compared to 4,863 in 2010. The promotion activities for ITS involve four ministries and agencies: the MLIT, the METI, the National Police Agency (NPA) and the Ministry of Internal Affairs and Communications (MIC) (MLIT 2012c).
adelphi                                                                                           018

To this end, 1,600 ITS spots in the streets were established with appropriate transmission
interfaces, which can establish communication links with more than 100,000 vehicles
equipped with appropriate interfaces. By today, ITS offer the following services (Fraunhofer
IAO 2018):
      •     Dynamic route guidance: Large-area traffic congestion data is collected enabling
            intelligent route guidance via navigation systems.
      •     Safety support: The driver can be warned of "near-misses" in advance.
      •     Electronic toll collection: Thereby the traffic congestion in front of toll stations at the
            expressways is reduced.
Vehicle Information and Communication System (VICS) provide road traffic information such
as travel time, congestion conditions, and traffic restrictions on a real-time basis to the on-
board car navigation screens. If drivers use this information, the mileage can be improved
and CO2 emissions reduced (MLIT 2015c). VICS caused an annual reduction of CO2
emissions of 2.4 million tonnes in 2009. In June 2012, around 35 million vehicles were
equipped with VICS (MLIT 2012a).
Electronic Toll Collection (ETC) Systems are meanwhile available on all national
expressways and most toll roads in Japan. With a usage rate of around 90% on national
expressways and roughly 51 million vehicles equipped with ETC systems, nearly all toll-gate
congestion on expressways have been eliminated (MLIT 2015c). This resulted in an annual
CO2 reduction of 0.21 million tonnes (MLIT 2012c). Since 2015, ETC 2.0 on-board units are
available, which collect additional data such as vehicle speed, travel route and travel time
data. Using this data, they enable other services apart from the toll payment such as flexible
toll rates to reduce congestion and accidents (MLIT 2015c).
ETC enhancement policies include the subsidization of toll operators and financial incentives
for private on-board unit owners such as special discounts on the toll fare up to 50% and a
flat toll on holidays (Mitsubishi 2014).

3.4       Promotion of eco-driving

To reduce fuel efficiency of motor vehicles by positively impacting driver’s behaviours the
government supports the dissemination of eco-driving. The “Eco-Drive Promotion Liaison
Committee” was formed in 2003 and includes 4 ministries and agencies: the National Police
Agency, METI, MLIT and MoE (ECCJ 2017). The Committee formulated the “10
Recommendations for Eco-driving” in 2003 and partly revised the list in 2006 and 2012. The
recommendations are as follows (METI 2015b):
      1.    Press the accelerator gently when accelerating
      2.    Reduce acceleration and deceleration while keeping enough distance between cars
      3.    Release the accelerator earlier when decelerating
      4.    Use air conditioners appropriately
      5.    Avoid unnecessary idling
      6.    Avoid traffic jams; leave home with time to spare
      7.    Check the pressure of the tires as the first step toward better maintenance
      8.    Take out unnecessary loads
      9.    Do not block traffic when parking
      10.   Be aware of your fuel consumption
adelphi 019 The Committee declared the “National Action Plan to Promote Eco-Driving” in 2006 and the period 2006-2008 was set as a focus period for promoting and disseminating eco-driving. The action plan comprises the following measures: review of the eco-driving definition and establishment of performance indicators, dissemination and educational activities for eco- driving, dissemination and promotion of supportive equipment for eco-driving, establishment of an evaluation system of eco-driving, enabling activities that involve local governments and other organizations and conducting surveys (MoE 2006; ECCJ 2017). The implementation of the action plan involved several stakeholders: the Energy Conservation Center Japan (ECCJ) for developing training tools for drivers, conducting workshops and supporting local governments, the Japan Automobile Federation (JAF) for offering workshops for drivers, as well as automotive and instrument manufacturers for the development of idling stop systems, eco driving support systems etc. (Funazaki 2012). The eco-driving program aims to raise the awareness of drivers for energy-efficient behaviour. Next to a reduction in fuel efficiency and therewith a decrease in CO2 emissions, which is estimated to be about 5-10% (Funazaki 2012), eco driving also has a positive impact on the reduction of traffic accidents. The implementation of Truck Eco-Driving Management Systems (EDMS), with the on-board equipment being subsidized by the government, led to a decrease in fuel consumption by 26.3% (Oba 2016). The promotion activities for eco-driving by the government and the support of the usage of EDMS for trucks, busses and taxis are ongoing (MoE 2016c). 3.5 Expansion of the high-speed rail network (Shinkansen) Development and expansion of the railway network for high-speed trains (Shinkansen) is regulated in the Nationwide Shinkansen Railway Development Act (from 1970, last amended in 2002) (MLIT 2006). The JRTT has the responsibility to oversee the construction of all Shinkansen lines; it owns the infrastructure and leases it to the operators. 2/3 of direct construction costs for new lines are paid by the national government, 1/3 by the local governments. The operator pays (leasing) route usage fees based on the operating income of the new Shinkansen but does not have to bear any direct construction costs. Approval for the construction of a new line is given by the government if certain criteria are met, such as profitability and consent from local municipalities and concerned JR operators (Takatsu 2007). The development of Shinkansen increased the convenience of railways due to high frequency of high-speed trains and the substantial travel time reductions. For instance, the travel time for the route from Tokyo to Nagano was reduced from 2h 56 min to 1 h 23 min and the travel time from Nagano to Kanazawa was reduced from 3 hours and 51 minutes to 2 hours and 28 minutes (IHRA 2016). Thus, the Shinkansen development contributed to a higher usage of railways in passenger transport and led to modal shift from road and air transport to railways (Lipscy and Schipper 2013; MLIT 2015a). For instance, before the Shinkansen route from Osaka to Kumamoto was opened, only 30% of passengers for this route used the train, compared to a share of 70% after the route was opened (IHRA 2016). The main reasons for promoting the expansion of the Shinkansen are however the support of interests of the rail and construction industries and the overall goal to develop the transportation network. CO2 emission reductions are mostly seen as an important externality of the policy (Lipscy and Schipper 2013).
adelphi                                                                                   020

3.6   Promotion of light-weight vehicles (Kei-cars)

Already since 1949, there is a Japanese standard for small light-weight vehicles, so called
Kei-cars. A vehicle class comparable to Japanese Kei-cars is not available in Germany.
Since 1988, the maximum values valid for Kei-cars are 3,390 mm length and 1,475 mm
                                        3
width as well as 47 kW output and 660 cm displacement (Fraunhofer IAO 2018).
Measures to promote the dissemination of Kei-cars also contribute to higher total fuel
efficiency of vehicles because Kei-cars are lighter and smaller than normal passenger cars
and thus have a tendency to be more efficient (Lipscy and Schipper 2013).
Policy measures to promote Kei-cars in Japan comprise lower insurance costs, lower taxes
(only around a third of the next larger vehicle class), highway discounts and loose
registration requirements. Thereby, several incentives are only available in rural areas to
particularly support areas with limited public transportation services. In recent years
however, the qualifications for the Kei-cars status have been gradually relaxed reducing the
gap to regular passenger cars (Lipscy and Schipper 2013; Fraunhofer IAO 2018).
Kei-Cars make up about one third of new passenger car sales in Japan (JAMA 2018).
Generally, among the major global light-duty vehicle markets, Japan is one of the countries
(next to India, Indonesia and Brazil) with the largest shares of small vehicles, or in other
                                                     2
words, with a vehicle footprint smaller than 4 m which is a proxy for the vehicle size. A
smaller vehicle footprint often positively affects the fuel efficiency of the vehicle (OECD and
iea 2017).

3.7   Optimizing logistics

To reduce CO2 emissions in logistics the government undertakes several measures for the
optimization of truck transportation and modal shift of freight transport to railways and
shipping. For the optimization of truck transportation joint transportation and the usage of
containers on a round-trip basis to avoid empty runs are promoted. To increase modal
shifting, the government supports the development of freight cars for railways that can carry
larger containers and provides subsidies for the acquisition of containers for railways that
correspond to the size of ten-ton trucks. The overland transportation of internationally
shipped container cargo is planned to be reduced by supporting the development of
international container and logistic terminals (MLIT 2015c).
The government also financially supports the conversion of passenger train lines for the
usage of freight transport since 2000 providing 30% of the costs (iea 2016b; MLIT 2013b).
Moving freight from trucks to railways is challenging because a high capacity of rail track
utilization has been already achieved. Especially in urban areas there is little space for
commercial use. As passengers rail transport is prioritized over freight transport in Japan,
freight traffic needs to stop in hours of high track utilization which can lead to delays.
Furthermore, due to land limits and high population densities a further expansion of the rail
network is associated with high costs and time (Lipscy and Schipper 2013).
Nevertheless, the initiatives of the government seem to be fruitful as logistics companies in
Japan are increasingly shifting their movements from trucks to rail, in some cases even
cooperating with competing companies. For example, Asahi Breweries Ltd. and Kirin
Brewery Co. joined to bring their products made in the Kansai region to the joint logistics
You can also read