Backgrounder 1 Affordable Housing Strategy - Prepared for City of New Westminster | September 2008
←
→
Page content transcription
If your browser does not render page correctly, please read the page content below
Affordable Housing Strategy
                         Backgrounder 1

Prepared for City of New Westminster | September 2008

                              Planning | Project Management | Applied Research
Summary Highlights — Backgrounder #1
This report presents and analyzes data • Continue to be a city suitable for
typically used to describe a community’s seniors. Recognition of unique housing
housing market and its housing needs. It is the circumstances of single senior females.
first of two background documents that will
• Protection of single detached areas from
aid in creating a new City of New
incompatible levels of density.
Westminster Affordable Housing Strategy.
• Need for sufficient ground-oriented
Historical Context housing to meet demand and to meet
The City of New Westminster (CNW) adopted the region’s target population for the
its first Housing Strategy in 1996. Work on the city.
strategy began in 1994 with a Housing
Workshop, followed by a Community Survey in • Support for secondary suites program
1995. that minimizes closure of existing suites,
ensures high health and safety standards
• The strategy is thoroughly-researched for occupants and does not have
and well-documented. Its strength lies in negative impacts on neighbourhoods.
its detail and level of community
consultation; however, it lacks As resources allowed, the CNW began to
prioritization of objectives and implement the 1996 strategy. By 2007,
recommendations. The strategy is a progress had been made on several fronts.
series of seven reports. There are no Some of the accomplishments include:
overarching goals or objectives. • New zoning for row houses, duplexes and
• There are 32 recommendations, small lot detached units
presented under seven topics: rental • Rezoned properties for higher density to
housing; market housing; innovative, allow more housing on less land Affordable Housing
cost-effective housing; seniors housing;
• DCCs changed so as not to penalize small Strategy Update -
growth management; and secondary
suites. units Backgrounder 1
The consultants observe the following core • City owns and leases sites to providers of
directions from the 1996 strategy: supported housing
• Support for a shift from rental to owner- • Negotiations with developers Prepared for the
occupied, while maintaining the quality City of New
• New housing and services directed to Westminster
and safety of existing rental stock.
compact, walkable neighbourhood
• Support for housing for households with centres. Reduced parking space
below median incomes and special needs requirements
through market and non-profit housing. September 2008
• New Standards of Maintenance bylaw
• Need to reform the City’s regulatory adopted
structure to encourage affordable
• Integrated Services Team addresses
housing and innovation.
problem properties
• New suites built in 75 percent of new
houses• Assisted/Supportive living facilities Housing Starts
provided at Buchanan Lodge, Kiwanis • For the three year period 2005-07, there
and Victoria Heights was an average of 763 starts per year,
In 2006, the CNW completed an in-depth study 90% in strata-titled multi-unit dwellings
on homelessness and is currently and 10% in freehold houses. There were
implementing a number of recommendations no new starts of rental housing. The
arising from that work. annual rate of housing starts decreased
noticeably in 2008.
Comparative Context
Housing Stock (2006)
Where available, the data for New
Westminster is presented within the context • A shift towards higher density housing
of Metro Vancouver, and in comparison with and owner-occupancy is evident in New
these four municipalities: Westminster and throughout Metro
Vancouver.
• Port Coquitlam, Coquitlam, Burnaby, and
the City of North Vancouver. • 66% of all housing was in apartment
form and 34% in ground-oriented
Population Growth dwellings such as single-detached
houses, duplexes and townhouses.
• New Westminster’s population grew at
an annual rate of 1.4% between 2001 and • Between 2001-06, the stock of owner-
2006, outpacing all comparable occupied units increased by 18% and the
municipalities and Metro Vancouver. rental stock declined by 8%.
• Current estimates indicate the city’s • 46% of dwellings in New Westminster are
population to be almost 64,000. rented, a much higher share than Metro
Population projections suggest Vancouver where 35% of the stock is
continuing growth to approximately rented.
80,000 by 2021, reaching 100,000 by
2031. Housing Prices
Affordable Housing
• In parallel with comparable
Demographic Characteristics Strategy Update -
municipalities, the price of all forms of
• New Westminster saw a 10% increase in housing increased sharply from 2001 to Backgrounder 1
the number of children aged 0 to 14 2007. In New Westminster, detached
between 2001 and 2006. This is markedly homes increased by 113%, attached
different than comparable homes by 92%, and apartments by 122%.
municipalities. Metro Vancouver saw a Prepared for the
negligible increase (0.1%) in the number • Benchmark real estate prices in New City of New
of children. Westminster reached their peak in March
Westminster
2008. The past few months (March to
• A large influx of 15 to 29 year olds (2,300 July) saw a decline of 7.5% in the
individuals) moved into the city between benchmark prices of detached homes
2001 and 2006. Further investigation is and 1.2% in apartments. Benchmark data
needed to explain this shift. September 2008
for attached housing was not available.
• New Westminster is home to a large
Rental Housing
percentage of single-person households
and a smaller share of families with • Since 2000, vacancy rates have ranged
children compared to Metro Vancouver. between 0.9% and 2.8%. Vacancy in 2007
continued to be low at 1.3%.• Due in part to the moratorium on strata Non-Market Housing
conversion of older rental buildings the • Between 6% and 7% of the private
city has experienced a loss of no more dwelling stock is categorized as non-
than 2.9%, or 244 units, in the past five market housing — 1,596 units of long-
years. term stay housing and 308 units of
• Among purpose-built rental housing, temporary or transitional housing, some
rents increased at an average annual of which are currently under
rate of 2.4% between 2002 and 2007. construction.
• It is estimated that there are Sub-Area Issues
approximately 2,500 secondary suites, • Two thirds of the housing is located in
almost 300 of which are legalized. two study areas - North and South.
Housing Need • Queensborough has the largest share of
• Canada Mortgage and Housing newly-constructed dwellings and both
Corporation defines core need the Queensborough and West study areas
households as those living in housing that have the largest share of legal secondary
does not meet adequacy, suitability and suites.
affordability standards and spend more • More than half the rental apartments
than 30% of their before-tax income on considered to be in poor condition are in
shelter. the North study area.
• In 2001, 20% of households were
reported to be in core need, higher than
in Metro Vancouver at 16%.
Affordability (2007)
• A couple household earning the median
income estimate of $76,421 with a 10%
downpayment can afford to purchase a Affordable Housing
home priced at $379,971. The median Strategy Update -
price of a detached home was $539,900. Backgrounder 1
• A single parent household earning the
median income of $37,233 can afford to
buy a unit for $185,128. The median
Prepared for the
price of an attached home was $374,500.
City of New
• A single person household earning the Westminster
median income of $27,789 can afford to
buy a unit for $138,171. The median
price of an apartment was $268,250.
September 2008Table of Contents
Introduction.......................................................................................... 1
The Affordable Housing Continuum............................................................ 1
Legislative Context in British Columbia....................................................... 2
The Policy and Planning context In New Westminster ...................................... 3
Relevant Facts and Factors........................................................................ 6
Total Population and Anticipated Growth..................................................... 6
Population Change................................................................................ 7
Household Types and Size........................................................................ 9
MIGRATION....................................................................................... 10
Housing Starts ................................................................................... 10
Housing Stock.................................................................................... 11
Purpose-Built Rental Housing.................................................................. 12
Secondary Suites................................................................................ 13
Housing Prices & Absorption levels........................................................... 13
Household Incomes ............................................................................. 14
Core Need Households.......................................................................... 14
Affordability — The Relationship of Income to Housing Prices/Rents................... 15
Non-Market Housing............................................................................. 16
New Westminster’s Neighbourhoods........................................................... 16
Tools and Approaches............................................................................. 19
Examples of Affordable Housing Practices....................................................21 Affordable Housing
Strategy Update -
Infill and Intensification........................................................................ 21
Backgrounder 1
Density Bonus Initiatives....................................................................... 21
Housing Agreements & Inclusionary Housing Programs.................................... 22
Grants and Land Contributions................................................................ 22
Affordable Housing Funds...................................................................... 23 Prepared for the
Waiving/Reducing Development Fees........................................................ 23 City of New
Westminster
Rental Conversion Policies..................................................................... 23
Sources.............................................................................................. 24
September 2008INTRODUCTION
The purpose of this first phase of work is to gain a comprehensive understanding of the
current housing situation in New Westminster and bring forward examples of tools and
strategies for preliminary consideration. This backgrounder sets the stage for future phases
by:
• Outlining the policy and planning context for an affordable housing strategy in New
Westminster;
• Presenting major facts and factors that influence housing affordability in the City of
New Westminster;
• Identifying a set of benchmark/comparable municipalities;
• Discussing relevant distinctions across the city’s sub-areas;
• Listing the range of affordable housing tools and responses available to municipalities;
• Highlighting key best practices and approaches put into practice by other municipalities;
and
• Offering initial observations and remarks on the affordable housing situation in New
Westminster.
The scope of work for the first phase of work and backgrounder has been the organization
and analysis of data typically used to describe community housing needs. Selected indicators
from the 2006 Census, Canada Mortgage and Housing Corporation, and the Greater Vancouver
Real Estate Board, among other secondary data sources, have been cited in this document.
THE AFFORDABLE HOUSING CONTINUUM
The 1996 Housing Strategy identified a set of definitions for affordable housing in New
Westminster. An updated strategy will take into consideration the current housing context and Affordable Housing
potentially revise the definitions to reflect the City’s priority needs and issues. Strategy Update -
Backgrounder 1
The affordable housing continuum, illustrated by the diagram on the following page,
represents the spectrum of affordable housing products. At one end of the continuum is
temporary shelter for the homeless and at the other end is independent living options for
households with low to moderate incomes. The continuum also shows a shift from non-market
Prepared for the
housing, housing that is government-subsidized, to affordable housing that is provided in the
private market such as secondary suites and affordable homeownership options. City of New
Westminster
This affordable housing strategy work takes as its launching point the 2006 Homelessness
Action Strategy and Implementation Plan for New Westminster and focuses on those
elements of the housing continuum that go beyond homelessness. While an important
emphasis is placed on non-market housing products including transitional/supportive, September 2008
independent social housing and rent assistance, this strategy will place a greater emphasis on
the role the City of New Westminster can play in facilitating the development of affordable
housing in the private market.
Page 1Figure 1: Affordable Housing Continuum
Affordable Housing Continuum
Independent
Transitional Affordable Rental
Emergency Social Housing Below Market
& Supportive &
Shelters & Rent Homeownership
Housing Homeownership
Assistance
Non-Market Housing Market Housing
LEGISLATIVE CONTEXT IN BRITISH COLUMBIA
Since the federal government withdrew funding for new social and cooperative housing in
1992, provincial and municipal governments have become more involved in identifying and
addressing housing needs. In British Columbia, BC Housing has played an increasingly
important role in affordable housing and housing for the homeless and population at-risk of
homelessness.
A municipality’s powers in relation to housing are derived from the Community Charter and
the Local Government Act (LGA). The Charter (2004) gives BC municipalities the authority to
legislate in a number of broadly-stated spheres of jurisdiction and provides:
• more flexibility to identify and provide service that Council considers necessary or
desirable, such as housing;
Affordable Housing
• clear authority to regulate, prohibit and impose requirements; Strategy Update -
• ability to waive or reduce fees when land or improvements are held by a charitable or Backgrounder 1
non-profit corporation;
• authority to establish a tax exemption program for an area designated as a revitalization
area. Prepared for the
City of New
In 1993, the BC Government amended the Municipal Act (now, the Local Government Act) to
require municipalities to include policies related to affordable, rental and special needs Westminster
housing in their Official Community Plans. The LGA contains a number of additional provisions
related to housing:
• Provides flexibility to allow higher density (bonus zoning ) in return for the provision of September 2008
community amenities, including affordable and special needs housing.
• Enables a local government to enter into a housing agreement with a landowner
regarding the occupancy of the housing units in terms of tenure, classes of person,
administration of the units, rents and lease, sale or share price. The housing agreement
is registered on title and is binding on future owners.
Page 2• Provides authority to waive or reduce a Development Cost Charge (DCC) for not-for-
profit rental housing.
• Allows for variation of DCCs according to different sizes or different numbers of lots or
units in a development.
• Stipulates that the BC Building Code applies to all municipalities, of which Part 9.36
reflects on Secondary Suites. The code
THE POLICY AND PLANNING CONTEXT IN NEW WESTMINSTER
Through numerous policies and programs, the City of New Westminster has supported the
development and maintenance of a diverse affordable housing stock. The key planning
documents that address housing and affordable housing are outlined here.
The Official Community Plan (OCP)
The Official Community Plan, adopted in 1998, establishes eleven policies and priorities in
terms of housing:
1. Encourage high health and safety standards in the rental housing stock as it ages.
2. Promote a balance of rented and owned housing units.
3. Ensure that the private market is able to supply a sufficient amount of housing in terms
of cost, location, features, size and type.
4. Encourage sufficient market housing to meet the needs, including affordability needs, of
residents earning below the city’s median income.
5. Encourage and enhance initiatives by nonprofit housing societies to create affordable
housing that has the appropriate characteristics and costs to meet the needs of residents
earning below the city’s median income.
6. Recognize the unique needs and preferences of the large seniors population so the New Affordable Housing
Westminster is a place that is highly suitable for seniors to live in and access services. Strategy Update -
Backgrounder 1
7. Play a proactive role in managing growth.
8. Regulate the creation of secondary suites to ensure they are healthy, safe and compatible
with their surrounding neighbourhoods and pay their fair share of municipal costs.
Prepared for the
9. Strive to achieve a housing stock that continues to suit the unique and changing needs of City of New
special needs residents, including those who are physically disabled, homeless, mentally Westminster
handicapped, mentally ill, visually or hearing impaired.
New Westminster Housing Strategy 1996
In fulfillment of the Provincial requirement to develop housing policies, the City of New
September 2008
Westminster developed its 1996 Housing Strategy. Work on the strategy began early in 1994
with data collection and analysis, followed by a Housing Workshop that was attended by
representatives of residents’ associations and other residents of the city. This was followed by
a household survey distributed to 100% of households in 1995.
The resulting report is thoroughly-researched and well-documented. Its strength lies in its
detail and level of community consultation; its weakness in the lack of prioritization of
Page 3objectives and recommendations. The strategy is actually a series of seven separate reports,
and, as a result, there is some duplication among them. There are no overarching goals or
objectives.
Recommendations emphasize “monitoring, examining, exploring, seeking, and facilitating”;
and light on specific actions to be undertaken by the City. There are 32 recommendations
presented under seven topics: rental housing; market housing; innovative, cost-effective
housing; seniors housing; growth management; and secondary suites. The consultants will
endeavour to measure the extent of the implementation of the 1996 strategy as part of the
current work.
At the risk of prematurely (and overly) summarizing the core directions of the 1996 strategy,
the consultants note the following:
• Support for shift from rental to owner-occupied, while maintaining the quality and
safety of existing rental stock.
• Support for housing for households with below median incomes and special needs –
through market and non-profit housing.
• The need to reform the City’s regulatory structure to encourage affordable housing and
innovation.
• Continue to be a city suitable for seniors. Recognition of unique housing circumstances
of single senior females.
• Single detached areas to be protected from incompatible levels of density. Should be
sufficient ground-oriented to meet demand. Should meet Metro Vancouver’s, formerly
the Greater Vancouver Regional District (GVRD), target population.
• Support for secondary suites policy / program that minimizes closure of existing suites,
ensures high health and safety standards, doesn’t have negative impacts on
neighbourhoods. Affordable Housing
Strategy Update -
Relevant Studies and Initiatives Backgrounder 1
Since the adoption of the OCP and the Affordable Housing Strategy, a number of additional
housing and homelessness-related background research has been undertaken, including:
• Secondary Suites Program (1998)
Prepared for the
• Seniors and Affordable Housing: An overview of Options for Consideration (2000) City of New
Westminster
• Homelessness Action Strategy and Implementation Plan for New Westminster (2006)
• Affordable Housing Fund: Overview and Options (2001)
• 2003 Affordable Housing Overview (2003)
September 2008
• City Involvement in Affordable Housing: Overview of Options (2004)
• The Homeless and At-risk Population in New Westminster and A Needs Assessment of
Services (2006)
• Density Bonusing Study (underway, 2008)
Page 4Table 1: Status of Affordable Housing Strategy Tasks and Accomplishments
Task Accomplishments To be Completed
Help private market create New zoning for row houses,
a range of housing options duplexes and small lot detached
units
Rezoned properties for higher
density to allow more housing on
less land
DCCs don’t penalize creating
small units
Encourage sufficient market Created New Westminster Non- Examine planning regulations
housing to meet the needs Profit Housing Fund and approvals to remove
of residents earning less unnecessary impediments
than city’s median income Reduced parking space
requirements in transit- Establish goals for % of all
supportive locations housing that will be non-
market housing
Encourage nonprofit City owns and leases sites to
societies to create providers of supported housing
affordable housing for (220 Sherbrooke operated by
residents earning less than Canadian Mental Health
city’s median income Association)
Examine rezoning land to Negotiated for developer to
higher densities to provide 100 non-profit housing
encourage the creation of units on Victoria Hill
non-profit units
Play a proactive role in New housing and services Meet GVRD ground-oriented
managing growth directed to compact, walkable medium density housing
neighbourhood centres target
Affordable Housing
New row house zone,
comprehensive development Strategy Update -
zones created to increase Backgrounder 1
housing choice
Promote health & safety New Standards of Maintenance
standards in aging rental bylaw adopted
housing stock
Integrated Services Team Prepared for the
addresses problem properties
City of New
Regulate secondary suites to 1998 secondary suite policy Westminster
ensure quality, results in higher quality suites
compatibility & cost sharing
New suites built in 75 percent of
new houses
Encourage a balance of Maintained existing rental Examine effects of September 2008
rented & owned housing housing stock through moratorium on condition of
moratorium on strata conversion housing stock
Adopt policy encouraging
creation of rental housing in
rezonings
Monitor affordability and
livability of housing stock
Page 5Task Accomplishments To be Completed
Encourage housing that suits Work with non-profit societies Promote accessible living
residents with special needs and senior governments to units
accommodate supportive and
transitional housing proposals
Recognize housing needs of Assisted/Supportive living
seniors facilities provided at Buchanan
Lodge, Kiwanis, Victoria Heights
This project will build on the studies and strategies completed to date. This does not,
however, preclude an opportunity to re-evaluate and consider tools and practices previously
considered but not implemented. We recognize that today’s planning and market context may
offer opportunities for innovation and development.
RELEVANT FACTS AND FACTORS
This section draws on published data sources in order to present facts and factors that
influence housing needs in New Westminster. These include:
• Population growth and change
• Housing stock and starts
• Rents and vacancies
• Incomes and relationship to housing
To gain a more complete perspective on how New Westminster compares to the rest of the
region and similar municipalities, benchmark data is presented throughout the report. The
benchmark areas include: Port Coquitlam, Coquitlam, Burnaby, City of North Vancouver and
the Metro Vancouver region.
Affordable Housing
TOTAL POPULATION AND ANTICIPATED GROWTH Strategy Update -
• In 2006, New Westminster had a total population of 58,555, an increase of 7.1% or 3,900 Backgrounder 1
people since the previous Census in 2001. The population increased at a rate of 1.4% per
year, a faster pace than that experienced in any of the benchmark municipalities and
the region as a whole.
Prepared for the
Table 2: Regional Growth Between 2001 - 2006 City of New
% Change Westminster
Municipality/Region Population
2001 - 2006
New Westminster 58,555 7.1%
Port Coquitlam 52,670 2.8% September 2008
Burnaby 202,805 4.6%
Coquitlam 114,585 1.5%
North Vancouver City 45,175 2.0%
Metro Vancouver 2,116,565 6.5%
Source: Statistics Canada, Population Census, 2001, 2006
Page 6• By way of the Regional Context Statement in the 1998 OCP, the City of New Westminster
committed to population growth that achieves a total population of 66,000 residents in
34,000 housing units by 2008 and 84,000 residents in 43,000 housing units by 2021.
Table 3: Population Estimates and Forecasts
Growth Rate Low Medium High
Forecast Year 1.70% 1.85% 2.0%
2008 63,671 63,765 63,859
2016 72,864 72,971 73,079
2021 79,271 80,940 82,609
2031 93,827 97,263 100,699
Source: Coriolis Consulting, August 2008, Population Forecast Figures
• Recent population projections prepared on behalf of the City estimate that the current
population (2008) is in the range of 63,700 and 63,900 people (Coriolis Consulting).
Future population projections put the population in the range of 79,300 to 82,600 by
2021 and approaching 100,000 by 2031. In the highest growth scenario, the City would
begin to approach its regional commitment levels. In all cases, the projections point to
the need for a substantial increase in housing supply in order to accommodate the
anticipated population growth.
POPULATION CHANGE
• New Westminster has experienced population change that is notably different from
comparable municipalities in the region. For example, many municipalities in the region
experienced a decline in the under 14 population. For example, among the benchmark
municipalities, Port Coquitlam and Coquitlam faced a decline in the number of children Affordable Housing
of 11% and 8% respectively. New Westminster, however, saw a 10% increase in the Strategy Update -
number of children aged 0 to 14 (Figure 2).
Backgrounder 1
• Metro Vancouver experienced a 15% increase in the absolute number of seniors in the
60+ age groups, while New Westminster only experienced a 10% increase among the 60
to 74 and 5% increase among the 75+ age group (Figure 2).
Prepared for the
City of New
Westminster
September 2008
Page 7Figure 2: Change in Number of People by Age Groups, 2001 - 2006
20% New Westminster 21%
Metro Vancouver
18%
15%
15%
15%
10%
10%
10%
5%
5% 5%
3%
0.1%
0%
-2% -3%
-5%
0-14 15-29 30-44 45-60 60-74 75+
Source: Statistics Canada, Population Census, 2001, 2006
• In terms of the percentage distribution of the population, Metro Vancouver, and in fact
many comparable municipalities noticed a discrete aging of their population — a
declining share of people in the younger age groups and increasing share of the older Affordable Housing
age groups 45 years and older. By contrast, New Westminster saw an increase in the Strategy Update -
share of its population under 14 and a decline in its older age groups 75 plus (Figure 3). Backgrounder 1
• The percentage of 30 to 44 year olds in New Westminster declined by 9%, a loss that is
similar to the experience in the region as a whole. It is of interest to note that the
benchmark municipalities of Port Coquitlam, Coquitlam and North Vancouver City
experienced higher percentage losses of 13% and 12%. Prepared for the
City of New
• Region-wide, the percentage of older adults aged 45 plus increased between the two Westminster
census periods, a reflection of the aging of the Baby Boom generation into the older age
groups. This is the case in New Westminster where a percentage increase was seen
among the 45 to 75 year olds. However, the percentage share of seniors over 75 years
dropped in New Westminster by 2%. Comparatively, the percentage of seniors of this age
September 2008
group in the municipalities of Coquitlam and Port Coquitlam increased by 17% and 14%
respectively.
Page 8Figure 3: Change in Distribution of the Population by Age Groups, 2001 - 2006
15%
New Westminster 13%
Metro Vancouver
10% 11%
8%
8%
5%
3%
2%
0%
-1% -2%
-4%
-5% -6%
-9% -9%
-10%
0-14 15-29 30-44 45-60 60-75 75+
Source: Statistics Canada, Population Census, 2001, 2006
HOUSEHOLD TYPES AND SIZE
• There are over 27,000 households in New Westminster with an average of 2.1 persons
per household. Average household size in the region is much higher at 2.6 as is the case
in the suburban municipalities of Burnaby, Coquitlam and Port Coquitlam (2.6 to 2.8). Affordable Housing
• The smaller average household size of the cities of North Vancouver and New Strategy Update -
Westminster speaks to a greater level of housing demand. Both cities have a high Backgrounder 1
percentage of one-person households (39% and 40%) and a lower percentage of couple
families with children (24% and 25%). Comparatively, in Burnaby, Coquitlam and Port
Coquitlam, singles made up no more than 20% to 27% of households and couple families
with children were between 28% and 38%. Prepared for the
City of New
• As a result, there would likely be a greater demand for a smaller housing product that is
Westminster
suitable for one-person households relative to municipalities such as Burnaby,
Coquitlam, and Port Coquitlam where there would likely be a greater demand for units
with multiple bedrooms and houses with yards.
• “Other” household types refers to multiple family households, single parent households September 2008
and non-family households, which are essentially individuals residing in the same
dwelling who are not related (i.e. room-mates).
Page 9Table 4: Household Types, New Westminster, 2006
Household Types Number Percentage
Total Private Households 27,045 100%
Couple Households with Children 5,395 20%
Couple Households without Children 6,715 25%
One-Person Households 10,700 40%
Other Household Types 4,235 16%
Average Household Size 2.1
Source: Statistics Canada, Population Census, 2006
MIGRATION
• Given that BC has a below-replacement level fertility rate, a net positive migration of
new residents from outside a municipality is essential for achieving population growth.
A look at the two census years, 2001 and 2006, across 5-year cohorts highlights a shift
that is directly attributed to migration into the city and is not the result of the natural
process of aging. Please note that this cannot be directly compared to the population
shifts described in the earlier section “Population Change”.
• There was a large influx of 15 to 29 year olds moving to New Westminster between
2001 and 2006. In particular, there were 1,115 individuals aged 20 to 24 (15 to 19 in
2001) who moved to the city during this period. This represents a 45% increase that
is directly attributed to migration into the city.
• This is evidence of a notable movement into New Westminster by students and those
in the earlier years of the workforce which may be the result of proximity to post
secondary education, affordable rental housing, relatively affordable entry-level
Affordable Housing
ownership and adult children returning to live at home.
Strategy Update -
• There was a small migration of seniors over 60 years out of New Westminster. This Backgrounder 1
may be attributed to a lack of suitable housing options for seniors seeking ground-
oriented or accessible housing.
• Further investigation is required to confirm the reasons behind the above
observations. Prepared for the
City of New
Westminster
HOUSING STARTS
• According to Canada Mortgage and Housing Corporation, there was, between 2005 and
2007, an average of 763 starts per year in New Westminster, at a monthly average of 64
starts. The majority of the new starts were in apartment products (83%) and the
September 2008
remaining split between duplexes/townhouses and single detached units.
• No more than 10% of the units were fee simple ownership (i.e. where owners have
absolute ownership of the property and are not strata-titled condominiums) and there
were no new housing starts in the purpose-built rental market between 2005 and 2008.
Of the 2,358 starts constructed since 2005, 90% were strata-titled condominiums.
Page 10• It is important to note that the first six months of 2008 experienced much lower housing
starts than the past three years - 82% fewer starts.
HOUSING STOCK
• Due to the changes in the Census enumeration process, 2008 housing structure type data
at sub-category levels cannot be compared to those from previous Census years. For this
reason, the following analysis is restricted to an analysis of ground-oriented and
apartment housing forms.
• Among the benchmark municipalities, there appears to be a general relationship
between ground-oriented housing and home-ownership rates. The benchmark
municipalities of Coquitlam and Port Coquitlam have a large proportion of ground-
oriented dwellings (71% and 79% respectively) paralleled by high rates of
homeownership (75% and 80% dwellings that are owner-occupied). Those communities
with a large apartment stock, such as the City of North Vancouver (61% apartments) and
Burnaby (46%) have a larger share of dwellings that are rented (46% and 39%). Similarly,
New Westminster has a large apartment base (66%) compared to ground-oriented
dwellings (34%) and consequently a large share of housing that is rented (46%) compared
to owner-occupied (54%).
Table 5: Housing by Tenure and Structure Type, New Westminster, 2006
Structure Type/ Tenure Owned Rented
Ground-oriented 78% 22%
Apartment 41% 59%
Total 54% 46%
Source: Statistics Canada, Population Census, 2006
Affordable Housing
• While the total dwellings in New Westminster increased by 4% between 2001 and 2006,
Strategy Update -
the increase took place entirely on the side of owner-occupied dwellings. The total
dwelling stock was 27,050 units in 2006. Backgrounder 1
• Owner-occupied dwellings saw an 18% increase (2,170 units) while rented dwellings
declined by 8% (1,145 units). More specifically, owner-occupied apartments increased by
27% and rented ground-oriented units decreased by 22%. Prepared for the
City of New
Westminster
September 2008
Page 11Figure 4: Change in Housing Type (2001, 2006)
Owner-occupied
25% 27% Rented
Total
15% 18%
9%
5%
6%
0.4% 4%
-5%
-5%
-8%
-15%
-22%
-25%
Ground-oriented Apartment Total
• A clear shift towards higher density housing and owner-occupancy is also evident
throughout the region. Most municipalities, including New Westminster, experienced a
shift of the ground-oriented stock from rental to owner-occupied. The rise in owner-
occupied apartments is attributed to the conversion of condominium apartments that
were previously rented to being occupied by homeowners, plus the net addition of new
strata condominiums.
PURPOSE-BUILT RENTAL HOUSING
Affordable Housing
• CMHC undertakes an annual survey of rental vacancies and rental rates in purpose-built Strategy Update -
rental housing (three units or more). Since 2000, vacancy rates in New Westminster have
Backgrounder 1
ranged between 0.9% and 2.8%. Vacancy in 2007 continued to be low at 1.3%.
• The purpose-built structures tend to comprise the older rental housing stock as there
has been very limited development of new rental housing in recent years. This stock
experienced considerable development pressure in the past few years with many Prepared for the
municipalities seeing a loss of rental units due to conversion to strata condominiums. City of New
Due in part to the moratorium on strata conversion of older rental buildings in New Westminster
Westminster, the city has experienced a loss of no more than 2.9% or 244 units. Most of
these units were one and two-bedroom units.
• The average rent (among the purpose-built stock) increased by 28% between 2002 when
September 2008
the average rent was $666 and 2007 when rents were $751. That is an average increase
of 2.4% per year during that period. According to BC’s Residential Tenancy Regulation for
2008, the maximum allowable annual rent increase is 3.7%.
Page 12Table 6: Average Rent, Purpose-Built Rental Stock, 2007
Unit Size Rent Number of Units
Bachelor $590 784
1-Bedroom $709 5,172
2-Bedroom $893 2,043
3-Bedroom + $1,131 152
Total $751 8,151
Source: Canada Mortgage and Housing Corporation, Market Rental Report, October 2007
SECONDARY SUITES
• Secondary suites have come to be recognized as a legitimate and desirable form of
affordable rental housing. They are often an affordable option for students, single
people, young working couples and small families.
• New Westminster’s Secondary Suites Program began in 1998. Since then, 269 legal suites
have been implemented throughout the city with up to an additional 2,200 suites that
are not registered and legal. This would suggest that secondary suites could potentially
make up 10% of the housing stock in New Westminster.
• Based on an analysis of the City’s legal suites, we note that most of the secondary suites
that are legal are found in newer homes constructed in the past eight years.
HOUSING PRICES & ABSORPTION LEVELS
• In parallel with comparable municipalities, the resale price of all forms of housing
increased sharply from 2001 to 2007. In New Westminster, the resale prices of detached
homes listed on the Multiple Listing Service (MLS) increased by 113%, attached homes by
Affordable Housing
92%, and apartments by 122%.
Strategy Update -
Backgrounder 1
Figure 5: New Westminster Median Resale Prices, 1999 - 2007
600,000
Detached
Attached Prepared for the
$539,90 Apartment City of New
450,000
Westminster
$374,50
300,000
$268,25 September 2008
150,000
0
1999 2000 2001 2002 2003 2004 2005 2006 2007
Source: Greater Vancouver Real Estate Board, 1999-2007
Page 13• There is some evidence that the real estate market is moving into a period of stagnation
with a decline in prices and low absorption levels. In New Westminster, the percentage
of sales to listings declined from a high of 90% in 2005 to 46% in 2008.
• In 2008, real estate prices in New Westminster reached their peak in March. The past
few months (March to July) saw a decline of 10.8% in the median prices of detached
homes and a decline of 8.9% in apartments. Median sales prices were not available for
attached units during this period.
HOUSEHOLD INCOMES
• The taxfiler database provides information for individual taxfilers as well as family
households. It reveals that couple families have significantly higher incomes, and
therefore, much greater choice in the housing market. Single parents and single persons
have much less choice.
Table 7: Income by Household Type, 2006
Family Households Metro Vancouver New Westminster
Couple Families $68,600 $70,400
Single Parent Families $34,700 $34,300
Singles $24,100 $25,600
Source: Statistics Canada, Small Area Data Division, Taxfiler-Reported Statistics, 2006.
• The median income for singles in 2006 (most recent data available) was $25,600, which
is higher than the median income throughout Metro Vancouver ($24,100). Comparatively,
couple households earned almost three times that income with $70,400.
CORE NEED HOUSEHOLDS Affordable Housing
• CMHC defines households in “core housing need” as those who paying more than 30% of Strategy Update -
pre-tax income for shelter, live in crowded conditions, and/or if they live in a home in Backgrounder 1
need of major repairs. Metro Vancouver commissioned a Housing Affordability Study that
reports on core need data for municipalities in the region. Note: This analysis is limited
in that it is based on Census data from 2001 that has been cross-referenced with sales
data from 2007.
Prepared for the
• In New Westminster, 20% of households in 2001 were reported to be in core need, a City of New
higher percentage than in the region as a whole where 16% of households were found to Westminster
be in core need. The need in New Westminster is particularly pronounced among renter
households where 30% were found to be in core need compared to 9% among owner-
occupied households.
September 2008
• To afford a single detached home in New Westminster in 2007, the study reported a
household would require a qualifying income of $110,800 and $94,000 for a townhouse.
To purchase a typical two-bedroom condo, a household would need an income of
$76,800. According to the estimates reported in this document, it could be presumed
that a couple household earning the median income ($70,400) would not qualify to buy
an average-priced 2-bedroom condo in New Westminster.
Page 14AFFORDABILITY — THE RELATIONSHIP OF INCOME TO HOUSING PRICES/RENTS
• The relationship between housing prices/rents and incomes is a key measure to describe
housing affordability. Housing analysts use this relational measure for establishing what
constitutes housing that is affordable in a particular community for various households
types. We consider one of the better sources of income data to be the taxfiler-reported
data (prepared at a small area level by Statistics Canada). CitySpaces examined the
most recent data available from 2006 and adjusted it to 2008 levels using the provincial
average weekly wage earnings.
Table 8: Maximum Purchase Price by Household Type
August 2008 Maximum Maximum
Monthly
Household Types Median Income Mortgage/ Purchase Price
GDS (32%)
(estimate) Rent* (10% Down)
All Families $68,496 $1,827 $1,827 $340,571
Couple Families $76,421 $2,038 $2,038 $379,971
Lone Parent Family $37,233 $993 $993 $185,128
Non-Family Persons $27,789 $741 $741 $138,171
Source: Taxfiler-Reported Income Figures, 2006; CitySpaces Consulting Adjustments and Calculations
• The above table shows the maximum affordable monthly housing cost for households
earning the median income and spending no more than 32% of their income on housing. 1
In terms of both rental and ownership housing, couple families generally have a greater
range of housing choice compared to single parents or singles. In New Westminster,
couple families earning the median income had the ability to spend $2,038 on housing
(including utilities and maintenance fees) without spending more than 32% of their
income. Single parent families and singles earning the median income were limited in
terms of housing choice with the ability to spend no more than $993 and $741 Affordable Housing
respectively. Strategy Update -
• A couple household earning the median income estimate of $76,421 with 10% Backgrounder 1
downpayment can afford to purchase a home priced at $379,971.
• A single parent household earning the median income of $37,233 can afford to buy a
unit for $185,128. Prepared for the
• A single person household earning the median income of $27,789 can afford to buy a City of New
unit for $138,171. Westminster
September 2008
1The Gross Debt Service (GDS) ratio is the percentage of gross annual income required to cover costs associated with
housing. Costs typically include mortgage payments, property taxes, condominium/maintenance fees, and heating.
Financial lenders in Canada typically use a GDS ratio of 32% to determine whether a potential borrower qualifies for
a loan.
Page 15NON-MARKET HOUSING
• Between 6% and 7% of the private dwelling stock is categorized as non-market housing,
namely co-operative housing, family housing, seniors housing and housing for persons
with disabilities. The rest of the non-market stock is considered to be “collective”
dwelling and includes emergency shelters, recovery houses, rooming houses, group
homes , correctional facilities, transitional and supportive housing.
• New Westminster has a total of 1,904 units of non-market housing: 1,596 units of long-
term stay housing (84%) and an additional 308 units of temporary or transitional housing
(16%).
Table 9: Non-Market Housing Stock in New Westminster, 2008
Number of
Category # Units Average Rent
Developments
Co-operative Housing 8 415 $742/mo.
Mental Health Housing 9 110 IA Rates*
Social Housing 7 380 30% of income
Seniors Social Housing 7 691 30% of income
Emergency Shelter Beds 4 49 n/a
Recovery Housing 4 52 IA Rates*
Transitional/Correctional 4 59 IA Rates*
Transitional/Supportive 9 148 IA Rates*
Total 52 1904
*Income Assistance (IA) rates - $375 is the current shelter allowance provided by BC Income Assistance.
Source: City of New Westminster, 2008. Includes units currently under construction and not yet occupied. Affordable Housing
Strategy Update -
Backgrounder 1
NEW WESTMINSTER’S NEIGHBOURHOODS
Sub-area data available through Statistics Canada is categorized according to Census Tract
(CT) areas. These CT areas do not accurately correspond to the City’s official sub-areas —
Queensborough, Uptown, Downtown, Sapperton and West End — or those used in the Official Prepared for the
Community Plan and Neighbourhood Planning Area maps. City of New
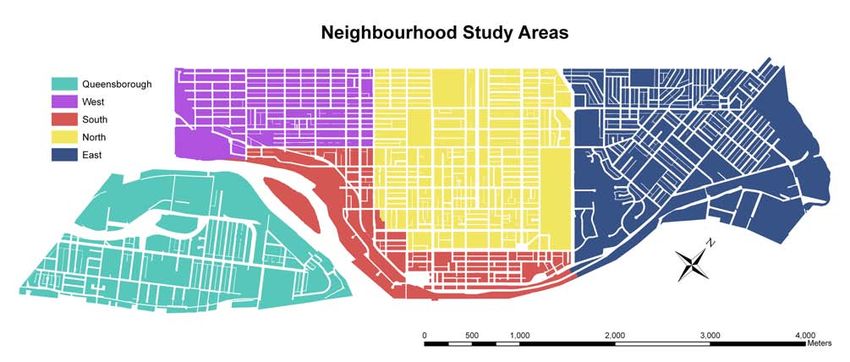
For the purposes of this Strategy work, Neighbourhood Study Areas have been identified that Westminster
correspond with Census data and, to a general extent, reflect the city’s major
neighbourhoods. The sub areas are outlined on the map (below) and are called
Queensborough, West, North, South, and East. The following section uses the below-
delineated boundaries for the sub-area analysis. September 2008
Page 16Figure 6: Neighbourhood Study Areas
Source: City of New Westminster using Statistics Canada Census Tract Boundaries
Housing by Neighbourhood Areas
• A look at the age of the housing stock shows that Queensborough has the largest share
of newly-constructed dwellings built between 2001 and 2006. A majority of the stock in
the South was constructed in the 1980s and 1990s and the housing stock in the
neighbourhood areas of the North, East and West was built largely before 1980.
Figure 7: Period of Construction by Neighbourhood
1.010
2001-2006
1981-2000
1946-1980 Affordable Housing
0.758 Before 1945 Strategy Update -
Backgrounder 1
0.505
Prepared for the
City of New
0.253 Westminster
0
North South Queensborough East West September 2008
Source: Statistics Canada, 2006 Census
Page 17• The neighbourhood distribution of residential dwellings is informative. The North area
has by far the largest share of residential units with 46% of the city’s housing stock in
this area (12,490 units) — more than half of which are rental. The South takes the next
largest share with 22% of the stock (5,940) and more than a third as renter-occupied.
• Analysis of the City’s secondary suites database shows that the majority of the
registered secondary suites (61%) can be found in Queensborough and in the West
neighbourhoods of the city. The South has the smallest share of legal suites (6%), largely
due to the small percentage of detached dwellings in this area, followed by the East
with 15% and the North with 18%.
Figure 8: Housing by Neighbourhood, 2006 Figure 9: Secondary Suites by Neighbourhood, 2008
West
8% North
West 18%
East 28%
17% South
North 6%
46%
Queensborough
7%
East
15% Queensborough
South
33%
22%
Affordable Housing
Source: Statistics Canada, 2006 Census Source: City of New Westminster, 2008 Strategy Update -
Backgrounder 1
• Building conditions vary from one study area to another. City-wide, 9.6% of rental
apartment units are in need of major repair compared to 8.1% of the rental apartment
Prepared for the
stock across the region of Metro Vancouver that is in a state of disrepair. More than half
City of New
of the rental apartments considered to be in poor condition were located in the North
and the rest were mostly in the South and East study areas. Westminster
September 2008
Page 18TOOLS AND APPROACHES
There are a number of interventions that local governments use to help meet affordable
housing needs. The use of these approaches varies considerably across British Columbia. In
some communities, local governments have become very actively involved in a number of
different ways. The following table presents a range of approaches/practices that
municipalities can do, and have been doing in BC, to facilitate the development of affordable
housing or to protect the loss of existing affordable housing.
Approach Description of Practice
Introducing policies and OCPs include policy statement regarding affordable, rental and
direction in OCP special needs housing.
Adopting an affordable Increasing number of municipalities in the region are adopting
housing strategy affordable housing strategies and dedicating additional staff
resources to affordable housing.
Encouraging private Waiving or streamlining development fees to remove financial
market development of barriers; reducing fees specifically for affordable housing, seniors
affordable housing housing, etc.
Introducing inclusionary Inclusionary housing policies and zoning requirements require
housing developers to construct a proportion of new residential
development for affordable housing. A variant of this is “linkage”
fees which are charged against commercial development.
Comprehensive Comprehensive development zoning allows flexibility in allocating
Development (CD) Zoning densities and specifying use and is commonly used by local
governments.
Supporting infill and Small lot zoning; infill or intensification (e.g. coach houses,
intensification courtyard housing) comprehensive development zoning; pre-
zoning and downzoning. Affordable Housing
Bonus density zoning Bonus density zoning is used to permit higher density or seek Strategy Update -
amenity contributions. Backgrounder 1
Zoning for housing above The creation of zoning districts for medium density development
shops along commercial corridors with residential housing above retail.
Facilitating secondary Secondary suites are an important way of meeting the demand for
Prepared for the
suites affordable rental housing and facilitating home ownership for
entry-level buyers. Secondary suites have been included in some City of New
apartment or townhouse units. Westminster
Prevent or replace the loss Limitations on conversion of rental housing and direct
of existing affordable replacement programs
rental housing
September 2008
Create incentives to Municipalities have a range of incentive tools to increase the
encourage the economic viability of affordable housing projects including using
development of non- City-owned land, waiving/reducing fees, loans and grants.
market housing
Page 19Approach Description of Practice
Demolition policies Rental housing is sometimes lost due to demolition and is most
often replaced with ownership housing in the form of
condominiums. Municipalities can introduce cash-in-lieu policies
to minimize the loss of affordable rental units and displacement
of renter households.
Housing reserve/ housing Housing reserve or trust funds are distinct funds established to
trust fund receive public revenues, which can only be spent on housing. A
key characteristic of HRFs is that they receive ongoing revenues
from dedicated sources of public funding such as development
fees or loan repayments.
Facilitate community Housing agreements and public/private partnerships can be
partnerships established to provide a means of securing affordable housing.
The terms of these agreements can specify the form of tenure,
the user groups, rent levels and management specifications.
Establish a housing Municipal housing corporations are public non-profits created and
corporation partially funded by municipalities. They work with neighbourhood
groups and agencies to provide affordable housing or use funds to
develop, own and manage their own affordable housing property.
Work with non-profit Identifying the needs through research and assessment is a key
housing providers to step in responding to change in a community. Municipalities can
respond to changing needs identify and work with potential partners to help address housing
of community needs.
Gift or long-term lease Life lease models and deed restricted housing are approaches by
municipally-owned land which municipalities can establish units that are to be used
perpetually for affordable housing.
Reducing land costs Local governments can reduce the developer’s costs by providing
land at a reduced cost. Units can be bought back and managed as
rental housing or sold at a reduced sale price to create affordable Affordable Housing
homeownership. Strategy Update -
Backgrounder 1
Prepared for the
City of New
Westminster
September 2008
Page 20EXAMPLES OF AFFORDABLE HOUSING PRACTICES
This document brings forward a small selection of examples of best practices from throughout
the Lower Mainland and other parts of BC. This is intended to initiate a discussion around
practices that may be replicated in a New Westminster context. The following list will be
expanded as needed to further inform strategic directions under consideration by the City.
INFILL AND INTENSIFICATION
• Southwest Coquitlam’s Housing Choice Study - The City undertook a study and
identified strategic recommendations to facilitate the implementation of infill and
intensification of low density neighbourhoods. This included neighbourhood area plan
policies, a zoning bylaw review and the development of checklists, design guidelines and
conditions to enable and encourage the redevelopment of single detached housing to
triplex, duplexes with coach houses, fourplexes and small lots.
• Vancouver’s Kingsway and Knight Housing Plan - A Housing Area Plan for the
Kingsway and Knight area was adopted in 2004 that proposed two new residential zones:
a Courtyard Rowhouse and a Small House/Duplex zone. These zones were intended to
deliver housing that is ground-oriented, suitable to a variety of family types and
designed to fit within the existing structure and scale of the neighbourhood. The Plan
allows for incremental development to occur in the existing neighbourhood without the
need for large land assemblies. All new development is subject to guidelines to ensure
attractive building design, quality materials, landscaping and neighbourhood fit.
• Delta’s Coach House Zones - The Corporation of Delta adopted zoning bylaw
amendments in 2007 on the RS9 coach house zone. The amendments provide
opportunities for alternate housing forms, more useable private open space, greener
sites, enhanced privacy, less interruption of existing street fronts, and greater
compatibility with adjacent residential development.
Affordable Housing
DENSITY BONUS INITIATIVES Strategy Update -
• Burnaby’s Community Benefit Bonus Program - Through the Community Benefit Bonus Backgrounder 1
Program, the City of Burnaby facilitates the development of affordable housing and
amenities in distinct parcels in the town centre areas. Bonus density is used here in
conjunction with comprehensive development zoning. The City of Burnaby adopted
Vancouver’s formula for calculating contributions: Prepared for the
Contribution = bonus floor area (ft2) x market land value ($ per buildable ft2) City of New
Thus the value of the amenity received is equivalent to the increased value of the Westminster
property arising from the density bonus. The density bonus bylaw sets the conditions by
which the maximum floor area ratio (FAR) may be increased.
• Density Bonusing in Vancouver - The City of Vancouver has density bonusing policies in
local area plans that permit more height, more density and less parking. Exchange is September 2008
often for the purpose of heritage preservation, but sometimes for affordable housing.
The Oakridge/Langara planning policies provide opportunities for an increase of up to
20% in density to encourage the provision of City-desired public amenities. The public
benefit priorities include improvements to existing parks and the walking environment,
affordable housing and neighbourhood traffic calming.
Page 21You can also read