Baited Remote Underwater Video (BRUV) survey of elasmobranchs on Bonaire's reefs - STINAPA Bonaire
←
→
Page content transcription
If your browser does not render page correctly, please read the page content below
Research report

Baited Remote Underwater Video (BRUV) survey
      of elasmobranchs on Bonaire’s reefs
                  Species composition, distribution, and relative abundance

                                                                            Mavelly Velandia

                                                              22nd of January 2018 on Bonaire

                                                                                           0
Research report

Baited Remote Underwater Video (BRUV) survey
      of elasmobranchs on Bonaire’s reefs
                  Species composition, distribution, and relative abundance

Picture on front page: Sander Delacauw & Mavelly Velandia

22nd of January 2018 on Bonaire

Author: Mavelly Velandia

Supervisor: Dr. Martin de Graaf, Wageningen Marine Research

                                                                              1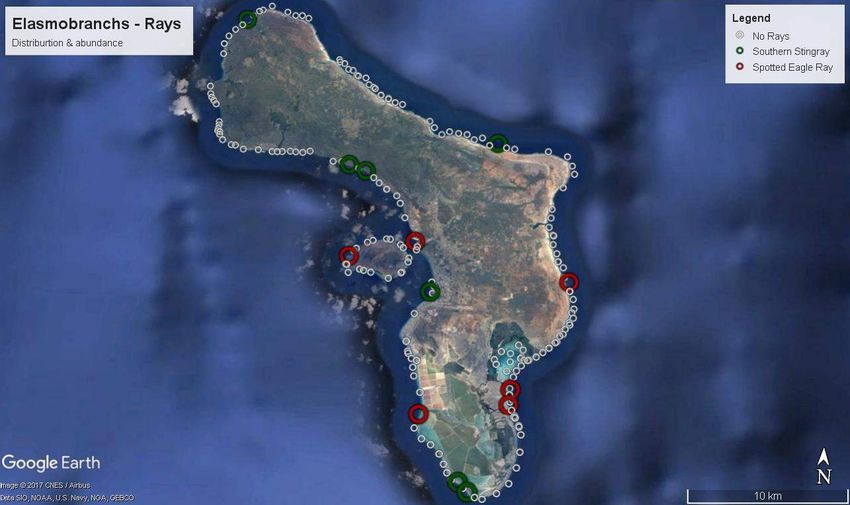
Research report

Table of Contents
Summary ........................................................................................................................................... 3
1.      Introduction .............................................................................................................................. 3
2.      Materials & method................................................................................................................... 4
     2.1       Area description ................................................................................................................. 4
     2.2       Baited Remote Underwater Video (BRUV) .......................................................................... 5
     2.3       Analysing video footage ..................................................................................................... 6
     2.4       Citizen science project........................................................................................................ 7
     2.5       Data analysis ...................................................................................................................... 7
3.      Results ....................................................................................................................................... 8
     3.1       Shark species composition, distribution, and abundance .................................................... 8
     3.2       Ray species composition, distribution, and abundance ..................................................... 10
     3.3       Citizen science project...................................................................................................... 12
4.      Discussion................................................................................................................................ 13
Acknowledgement........................................................................................................................... 14
References ...................................................................................................................................... 15
Appendix ......................................................................................................................................... 16
     Appendix 1 .................................................................................................................................. 16
     Appendix 2 .................................................................................................................................. 17
     Appendix 3 .................................................................................................................................. 18
        Appendix 3a............................................................................................................................. 18
        Appendix 3b ............................................................................................................................ 18

                                                                                                                                                       2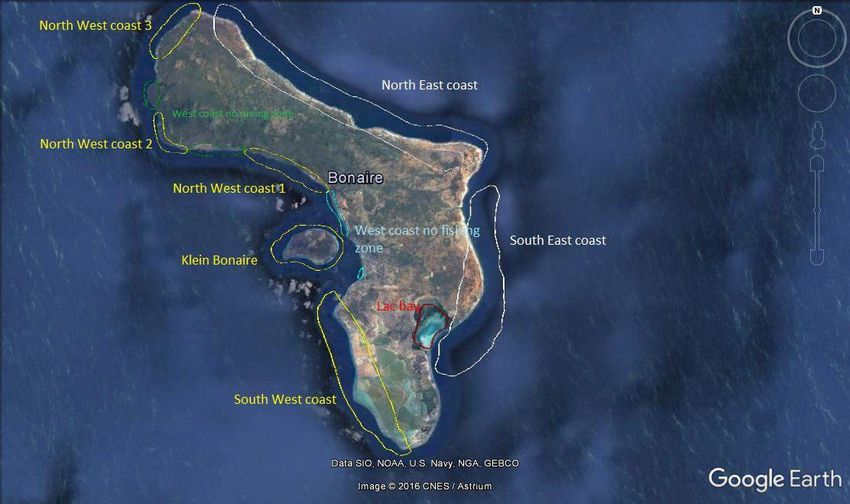
Research report

Summary

Elasmobranchs are suffering from habitat loss and are declining at a rapid pace. They are listed as
“Data Deficient” on the IUCN Red List of Threatened Species, as there has not been enough research
conducted on elasmobranchs. Contemporary and historical data are very limited. The worldwide
decline of elasmobranchs is largely due to the Asian shark fin trade.
However, in the Dutch Caribbean, sharks do not get targeted for artisanal fisheries, but are mostly
killed as bycatch. To conserve elasmobranch species, it is necessary to collect information related to
their diversity, distribution, and abundance. Baited Remote Underwater Video (BRUV) is used to
study marine environments and their inhabitants; it has become the standard approach to learn
about elasmobranchs in their representative habitats. BRUV deployments were done along the East
coast and a part of the West coast of Bonaire.

From the videos, the maximum numbers of individuals (MaxN) were counted. Also, a citizen science
project was undertaken and the presence or absence of elasmobranch species was noted. Data from
the video footage and the citizen science project were collected and used to compare Bonaire’s
shark and ray species compositions, distributions and abundances of the East coast with the West
coast.

    1. Introduction
Many marine species, populations, or entire functional groups are rapidly declining and suffering
from habitat loss in regional ecosystems such as estuaries (Lotze et al., 2006), coral reefs (Pandolfi et
al., 2003), and coastal (Jackson et al., 2001) and oceanic fish communities (Worm et al., 2005). The
International Union for Conservation of Nature (IUCN) Red List assesses the global risk of extinction
by established quantitative criteria for each species. According to Camhi et al. (2007), 32% of the
world’s elasmobranchs are threatened. Of these, 6% are endangered and 26% are vulnerable.
However, the most basic information about elasmobranchs is lacking and 46% are listed as ‘Data
Deficient’ on the IUCN Red List of Threatened Species (IUCN 2017). Elasmobranchs in ecosystems,
such as coral reefs, are poorly known because contemporary and historical data are very limited
(Dulvy et al., 2008). However, it is known that elasmobranchs use nearshore areas to target high
quality prey which could be unavailable in oceanic waters (Heithaus et al., 2002). Nearshore areas
contain highly productive habitats sustaining great abundances and diversities of fish and
invertebrates (Beck et al., 2001) and are also used as nursery grounds (Heupel et al., 2007), where
many elasmobranch species thrive.

Unfortunately, elasmobranchs populations have been rapidly declining worldwide (Myers & Worm,
2003) as a result of habitat degradation (Jennings et al., 2008), pollution (Gelsleichter et al., 2005),
and climate change (Chin et al., 2010). However, the greatest threat to the decline of elasmobranchs
is the Asian shark fin trade (Clark et al., 2006). In the Dutch Caribbean, elasmobranchs do not get
targeted by artisanal fisheries, but are killed as bycatch and are considered nuisance species by some
fisherman. As a result, the elasmobranchs are consumed locally, used as bait, or (reportedly) killed
and discarded at sea (Van Beek et al., 2013). Elasmobranchs are particularly vulnerable because of
their life history strategy: slow growth, late attainment of sexual maturity, long life span and low
fecundity (Stevens et al., 2000). Large predators strongly influence smaller-bodied mesoconsumers

                                                                                                        3
Research report

and the species that are eaten by mesoconsumers, and these processes demonstrate the
importance of top-down processes (Heithaus et al., 2008). For example, a study conducted by Myers
et al. (2007) in the northwest Atlantic Ocean found that the catch rate of cownose rays (Rhinoptera
bonasus) increased 9% per year as large shark populations declined. The exploding ray populations
are believed to have caused a rapid decline in bay scallop populations (Argopecten irradians), which
are an important food resource for that area.

Currently, not much is known about the presence of elasmobranchs in the Dutch Caribbean
(Meesters et al., 2010). For the development of adequate management and conservation initiatives,
it is necessary to collect ecological information related to the diversity, distribution, and abundance
of elasmobranchs (Garla et al., 2006). For over 40 years, underwater imaging has been used to study
marine environments and its inhabitants (Bailey et al., 2007). Baited Remote Underwater Video
(BRUV) surveys have currently become the standard approach to capturing elasmobranchs in their
representative habitats (Meekan et al., 2006). BRUV surveys provide many major benefits over
traditional survey methods. BRUV surveys are non-invasive, nondestructive and cause minimal
damage to the environment they are placed in (Brooks et al., 2011).

In a recent study conducted by Ruijs (2017) on elasmobranchs on Bonaire’s reef, it was concluded
that, in comparison to other islands in the Dutch Caribbean, Bonaire has a lower elasmobranch
abundance. But the deployments with the BRUV systems were mostly conducted on the West coast
of the island. During the same year, a citizen science project demonstrated a significant higher
abundance of elasmobranchs on the East coast of the island than on the West coast.

The current elasmobranch species composition, distribution and relative abundance on the East
coast and a small section of the West coast of Bonaire were collected during this study. Data were
collected using the standardized BRUV base-line survey with stereo BRUV systems and single-camera
BRUV systems. Aside from the BRUV base-line survey, dive guides from two dive centers (Bas Diving
and Carib Inn) participated in a citizen science project in which they noted the presence or absence,
location and abundance of elasmobranch species. Both the BRUV data and the citizen science data
were used to compare shark and ray species composition, distribution and relative abundance on
the East and West coasts of Bonaire.

    2. Materials & methods
    2.1     Area description

Bonaire’s coastal waters, from the high tide line to a depth of 60 meters, are designated as the
Bonaire National Marine Park. The park encircles Bonaire with 2,700 hectares of coral reefs, sea
grass and mangrove ecosystems. The sheltered West coast of the island is highly developed. Here is
where most local and touristic activities occur, because it is easily accessible. This is also where most
dive sites are located (Appendix 1). The East coast of the island is less accessible and is exposed to
constant eastern trade winds. It is difficult to access the reefs of the East coast, therefore there are
no official dive sites around this area of the island.

                                                                                                        4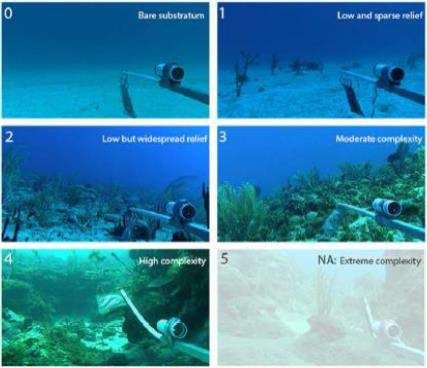
Research report

          The current study was conducted between September 2017 and December 2017 on Bonaire. This is
          the follow-up to the pilot study that was conducted by Nijs Ruijs throughout the period of
          September 2016 and December 2016. In 2016, a total of 110 BRUV deployments along most of the
          West coast and a part of the East coast were conducted (Fig. 1). This study completed a total of 12
          BRUV deployments on the West coast and a total of 78 deployments on the East coast of the island
          in 2017 (Fig. 1).

                                                  I
                                                                          North East coast

                                                      West coast

                                                                                                            South East coast

                                                                                        I
Figure 1: The purple circles indicate the BRUV drops done in the pilot study of 2016 by Nijs Ruijs. The yellow circles indicate the BRUV drops from
this follow-up study, conducted throughout the period of September 2017 and December 2017 along the North-East, South-East, and West coast.
The borders of the East coast and the West coast are displayed by the white markings on the top and the bottom of the island.

               2.2       Baited Remote Underwater Video (BRUV)

          To study elasmobranchs, a non-invasive method is used called the standardized Baited Remote
          Underwater Video base-line survey (Cappo et al., 2004). The standardized BRUV base-line survey
          was conducted using three stereo BRUV systems and three single-camera BRUV systems. Each
          stereo BRUV system consists of two Canon LEGRIA HF G10 cameras and each single-camera BRUV
          system consists of one GoPro HERO+ camera. Both systems were used to collect current
          elasmobranch abundance and distribution around the island of Bonaire. However, the stereo BRUV
          systems can also be used to compile species-specific length data (de Graaf et al., 2015), but will only
          be used in a further study to compare data with stereo BRUV surveys conducted on other Dutch
          Caribbean islands.

                                                                                                                                       5
Research report
The BRUV systems were deployed during daylight hours (08:00-17:00). Each system was deployed to
either the top of the coral reef drop-off (±10 m) or at the bottom of the coral reef (±40m) for
approximately 90 min and contained a bait bag attached to the BRUV systems. The bait bag was
positioned in front of the cameras with approximately 1 kg of tuna (Thunnini). A bathyscope (for
shallow drops) and a drop camera (for deep drops) were used to ensure that the BRUV systems
landed on rock or sand, rather than living coral. Between each deployment on the same day, a
distance of 500 m was maintained between drop sites to reduce overlap between bait odors (Willis
& Babcock, 2000, Harvey et al., 2007, Heagney et al., 2007). Furthermore, for each drop, the depth,
date, deployment time, and GPS coordinates were recorded. Wind speed, wind direction, percent
cloud coverage and surface chop were also noted.
2.3 Analyzing video footage
The video footage of the BRUV systems were analyzed by using a relative abundance index. This is
where the maximum number of individuals (MaxN) was counted within the frames of the videos
(Cappo et al., 2006). Hereby, repeated counts of individual elasmobranch species re-entering the
video frames were avoided. For each video, the visibility, management zone, habitat complexity,
habitat type, bait type and weight were noted. Bonaire is divided into 6 management zones; West
coast general use zone, which is divided into five sub zones: North-West coast 1, 2 & 3, Klein
Bonaire, and South-West coast and the East coast general use zone, which is divided into two sub-
zones: North-East coast and South-East coast. As well as the West coast no fishing zone, West coast
no diving zone, and Lac Bay (Appendix 2). A 6-point scale (Polunin & Roberts, 1993) was used to
determine the habitat complexity. Ranging from habitat category 0, bare substratum, to category 4,
high complexity. Category 5, extreme complexity, was not observed (Fig. 2). The macro-habitat types
are divided into four categories: sand, seagrass, macroalgae and coral reef.
6Research report
Figure 2: A 6-point scale as described by Polunin and Roberts (1993) was used to determine
the habitat complexity. 0=Bare substratum, 1=Low and sparse relief, 2=Low but widespread
relief, 3=Moderate complexity, 4=High complexity and 5=Extreme complexity (5 was not
observed in this study).
2.4 Citizen science project
Dive guides from two local dive centers collected elasmobranch presence or absence data for each
dive they conducted during the period of the study. For each dive, the dive guide recorded the date,
location, and the number and species of any elasmobranch species sighted, even if none were
sighted.
2.5 Data analysis
The data collected from the BRUV survey and the citizen science project were analyzed and used to
compare the species compositions, distributions and relative abundances on the West and East
coasts of Bonaire.
7Research report
3. Results
3.1 Shark species composition, distribution, and abundance
Out of a total of 83 BRUV drops on the East coast and a total of 92 drops on the West coast the
distribution and relative abundance of sharks was determined (Fig. 3 & 4). Three shark species were
found along the coasts of Bonaire; Caribbean reef shark (Carcharhinus perezii), Nurse shark
(Ginglymostoma cirratum) and Great hammerhead (Sphyrna mokarran). On the East coast, there
were 42 Caribbean reef sharks, 6 Nurse sharks and 4 Great hammerhead sharks observed and on the
West coast, only 7 Caribbean reef sharks were observed, totalling 59 sharks (Appendix 3a).
I
I
Figure 3: Shark species distribution along the coast of Bonaire. White circles indicate that there were no sharks seen on the BRUV video footage.
Blue circles indicate that Caribbean reef sharks were present on the video footage, red circles for Great hammerhead sharks, yellow circles for
Nurse sharks, and green circles for video footage that included Caribbean reef sharks (CRS) as well as Nurse sharks (NUS). The borders between
the East coast and the West coast are indicated by the white markings on the top and the bottom of the island.
8Research report
Sharks - East coast and West coast
40
35
Number of sharks per 50 drops
30
25
Caribbean reef shark
20
Great hammerhead
15 Nurse shark
10
5
0
East coast West coast
Figure 4: Mean number of sharks per 50 BRUV drops on the East coast and the West coast. A total of 59 sharks
were observed.
9Research report
3.2 Ray species composition, distribution, and abundance
Out of a total of 83 drops on the East coast and a total of 92 drops on the West coast, the
distribution and relative abundance of rays was also determined (Fig. 5 & 6). Two ray species were
seen in the BRUV footage from the coasts of Bonaire: Southern stingrays (Dasyatis americana) and
Spotted eagle rays (Aetobatus narinari). On the East coast, three Spotted eagle rays and one
Southern stingray were on the BRUV footage. On the West coast, five Spotted eagle rays and six
Southern stingrays (Appendix 3a) were recorded.
I
I
Figure 5: Ray species distribution along the coast of Bonaire. White circles indicate that there were no rays seen on the BRUV video footage. Red
circles indicate that Spotted eagle rays were present on the video footage and green circles indicate the presence of Southern stingrays. The
borders of the East coast and the West coast are indicated by the white markings on the top and the bottom of the island.
10Research report
Rays - East coast & West coast
14
12
Number of rays per 50 drops
10
8
Spotted eagle ray
6 Southern stingray
4
2
0
East coast West coast
Figure 6: Mean number of rays per 50 BRUV drops on the East coast and the West coast. A total of 15 rays
were recorded.
11Research report
3.3 Citizen science project
Shark and ray sighting information was collected from a total of 301 dives on the East coast and 705
dives on the West coast by the dive centers that contributed to this project. Three shark species
were sighted on the West coast: the Nurse shark (Ginglymostoma cirratum), the Bull shark
(Carcharhinus leucas) and the Caribbean reef shark (Carcharhinus perezii). On the East coast, the
Nurse shark and Caribbean reef shark were the only shark species sighted (Fig. 7). On the West coast
there were 10 Nurse sharks, 1 Bull shark, and 11 Caribbean reef sharks sighted. The East coast had
66 Nurse shark and 10 Caribbean reef shark sightings (Appendix 3b). This was a total of 98 shark
sightings.
Furthermore, there were three ray species sighted on the West coast and also on the East coast.
These ray species are: the Southern stingray (Dasyatis Americana), the Spotted eagle ray (Aetobatus
narinari), and the Manta ray (Manta sp.) (Fig. 8). On the West coast, there were 68 Southern
stingray, 79 Spotted eagle ray, and 6 Manta ray sightings. The East coast had a total of 102 Southern
stingrays, 366 Spotted eagle rays, and 5 Manta rays sighted (Appendix 3b). This was of a total of 626
rays sightings.
Citizen science project - Shark sightings
35
30
Number of sharks per 100 dives
25
20 Nurse shark
Bull shark
15
Caribbean reef shark
10
5
0
West Coast East Coast
Figure 7: Mean number of sharks sighted per 100 dives on the East coast and the West coast of Bonaire. There was a
total of 98 shark sightings.
12Research report
Citizen science project - Ray sightings
180
160
Number of rays per 100 dives
140
120
100 Southern stingray
80 Manta ray
Spotted eagle ray
60
40
20
0
West Coast East Coast
Figure 8: Mean number of rays sighted per 100 dives on the East coast and the West coast of Bonaire. There
was a total of 626 rays sighted.
4. Discussion
In this study, we used BRUV surveys to compare the distribution and relative abundance of
elasmobranchs on the East and West coasts of Bonaire. There were only 7 Caribbean reef sharks
seen on the BRUV footage from the West coast, whereas on the East coast there were 6 Nurse
sharks, 4 Great hammerheads and 42 Caribbean reef sharks seen on the BRUV footage. There was
also a difference between the East and West coast in relative abundance of sharks during the citizen
science project. A total of 22 sharks were sighted on the West coast, whereas a total of 76 sharks
were sighted on the East coast. A study done by Graham (2011) in Punta Gorda, Belize, recorded the
impact of divers and boat noise on sharks, which resulted in rapid evasive behavior of sharks. Since
there are more boats and divers on the West coast, the impact of noise on sharks could be a reason
there were fewer sharks sighted there.
Furthermore, there were hardly any rays encountered on the BRUV footage when compared to the
number of rays observed during the citizen science project. This could be because rays were not
attracted to the Tuna bait that was placed in the bait bag in front of the BRUV cameras. No Manta
rays were seen on the footage, and the reason for this could be that Manta rays are planktivorous
elasmobranchs (Marshall et al., 2009) and feed on small zooplankton (Couturier et al., 2013). A study
on vertical movements of satellite-tracked Reef manta rays in eastern Australia showed that the
longest periods of time were spent at depth in the epipelagic zone, which could be linked with their
feeding activity (Couturier et al., 2013). Furthermore, the relative abundance of the Southern
stingray seen on the BRUV footage differed from the sightings of the citizen science project. On
BRUV footage, only six Southern stingrays were seen on the West coast and one on the East coast,
whereas during the citizen science project, 102 Southern stingrays were seen on the East coast and
68 on the West coast. This could be because the Southern stingrays were not attracted to the bait.
During a study on stomach contents of Southern stingrays, Wrasses (Labridae), Gobbies (Gobiidae),
and Parotfish (Scaridae) were mostly found (David et al., 1993), which suggests that Southern
13Research report
stingrays may not feed on Tuna. Spotted eagle rays are not believed to feed on fish, as concluded in
multiple studies that monitored what this species fed on. A spotted eagle ray’s diet consists largely
of bivalve and gastropod mollusks (Ajeman et al., 2012 & Randall, 1967).
To discover more shark species around the island of Bonaire, BRUV surveys should be done during
the evening hours when different species are active. This could lead to a better insight on the
species richness of sharks around the island of Bonaire. Past studies have shown that sharks are
most likely to be in deeper waters during the day and in shallower waters at night. Papastamatiou et
al. (2015) studied daily routines in an ectothermic marine predator and found that sharks
demonstrated a peak in activity between 19:00-21:00 and the lowest levels of activity was between
10:00-15:00. Another suggestion for future research would be the collection of information on the
diet and trophic position of rays to improve the understanding of the movements and roles of rays
within the ecosystem (Couturier et al., 2013).
Acknowledgement
I would like to thank Caren Eckrich of STINAPA Bonaire and Dr. Martin de Graaf of Wageningen
Marine Research (formerly IMARES) for the very much appreciated guidance and help during this
research. Also, I must thank Twan Stoffers for the BRUV training and to Sander Delacauw, who also
worked on this project together with me. Really big thanks go to Ludson and Luti Craane for letting
us use their boat for the deployments and for generously helping us with the heavy lifting. I should
also mention the help provided by the STINAPA rangers for the transportation of all the equipment,
Desi, who provided us with Tuna bait and finally Bas Diving and Carib Inn who helped collect data for
the citizen science project. This research was made possible with the funding of the Nationale
Postcode Loterij as part of the Save Our Sharks project.
14Research report
References
Ajemian, M. J., Powers, S. P., Murdoch, T. J. T. (2012). Estimating the Potential Impacts of Large
Mesopredators on Benthic Resources: Integrative Assessment of Spotted Eagle Ray Foraging Ecology
in Bermuda.
Bailey, D. M., King, N. J., Priede, I. G. (2007). Cameras and carcasses: historical and current methods
for using artificial food falls to study deep-water animals. Marine Ecology-Progress Series 350: 179-
191.
Beck, M. W., Heck, K. L., Able, K. W., Childers, D. L., Eggleston, D. B., et al. (2001). The identification,
conservation, and management of estuarine and marine nurseries for fish and invertebrates.
BioScience 51: 633-641.
Brooks, E. J., Sloman, K. A., Sims, D. W., Danylchuk, A. J. (2011). Validating the use of baited remote
underwater video surveys for assessing the diversity, distribution and abundance of sharks in the
Bahamas. Endangered Species Research 13: 231-243.
Camhi, M. D., Valenti, S. V., Fordham, S. V., Fowler, S. L., Gibson, C. (2007). The Conservation Status
of Pelagic Sharks and Rays. Report of the IUCN Shark Specialist Group: Pelagic Shark Red List
Workshop. Tubney House, University of Oxford, UK, 19-23.
Cappo, M., Speare, P., De'ath, G. (2004). Comparison of baited remote underwater video stations
(BRUVS) and prawn (shrimp) trawls for assessment of fish biodiversity in inter-reefal areas of the
Great Barrier Reef Marine Park. Journal of Experimental Marine Biology and Ecology 302: 123-152.
Cappo, M., Harvey, E., Shortis, M. (2006). Counting and measuring fish with baited video — an
overview. In: Lyle JM, Furlani DM, Buxton CD (eds) Cutting-edge technologies in fish and fisheries
science. Australian Society for Fish Biology Workshop. Australian Society of Fish Biology, Hobart, p
101-115.
Chin, A., Kyne, P. M., Walker, T. I., McAuley, R. B. (2010). An integrated risk assessment for climate
change: analysing the vulnerability of sharks and rays on Australia’s Great Barrier Reef. Global
Change Biology 16: 1936-1953.
Clarke, S. C., McAllister, M. K., Milner-Gulland, E. J., Kirkwood, G. P., Michielsens, C. G. J., et al.
(2006). Global estimates of shark catches using trade records from commercial markets. Ecology
Letters 9: 1115-1126.
Couturier, L. I. E., Rohner, C. A., Richardson, A. J., Marshall, A. D., Jaine, F. R. A., et al. (2013). Stable
Isotope and Signature Fatty Acid Analyses Suggest Reef Manta Rays Feed on Demersal Zooplankton.
Dulvy, N. K., Baum, J. K., Clarke, S., Compagno, L. J. V., Cortes, E., et al. (2008). You can swim but you
can't hide: the global status and conservation of oceanic pelagic sharks and rays. Aquatic
Conservation: Marine and Freshwater Ecosystems.
Garla, R. C., Chapman, D. D., Wetherbee, B. M., Shivji, M. (2006). Movement patterns of young
Caribbean reef sharks, Carcharhinus perezi, at Fernando de Noronha Archipelago, Brazil: the
potential of marine protected areas for conservation of a nursery ground. Marine Biology 149: 189-
199.
15Research report
Gilliam, D. S. & Sullivan, K. M. (1993). Diet and Feeding Habits of the Southern Stingray Dasyatis
americana in the Central Bahamas. Bulletin of Marine Science 3: 1007-1013.
Gelsleichter, J., Manire, C. A., Szabo, N. J., Corte´s, E., Carlson, J., Lombardi-Carlson, L. (2005).
Organochlorine concentrations in bonnethead sharks (Sphyrna tiburo) from four Florida estuaries.
Archives of Environmental Contamination and Toxicology 48: 474–483.
Graaf de, M., Piontek, S., Miller, C. M., Brunel, T., Nagelkerke, L. A. J. (2015). Status and trends of St.
Eustatius coral reef ecosystem and fisheries: 2015 report card. IMARES Wageningen UR, Ijmuiden.
Graham, R. (2011). Rapid shark assessment: The Swan Islands, Honduras. Punta Gorda, Belize:
Wildlife Conservation Society.
Harvey, E. S., Cappo, M., Butler, J. J., Hall, N., Kendrick, G. A. (2007). Bait attraction affects the
performance of remote underwater video stations in assessment of demersal fish community
structure. Marine Ecology Progress Series 350: 245-254.
Heagney, E. C., Lynch, T. P., Babcock, R. C., Suthers, I. M. (2007). Pelagic fish assemblages assessed
using mid-water baited video: standardising fish counts using bait plume size. Marine Ecology
Progress Series 350: 255-266.
Heithaus, M. R., Dill, L. M., Marshall, G. J., Buhleier, B. M. (2002). Habitat use and foraging behaviour
of tiger sharks (Galeocerdo cuvier) in a seagrass ecosystem. Marine Biology 140: 237-248.
Heithaus, M. R., Frid, A., Wirsing, A. J., Worm, B. (2008). Predicting ecological consequences of
marine top predator declines. Trends in Ecology and Evolution Vol. 23 No. 4.
Heupel, M. R., Carlson, J. K., Simpfendorfer, C. A. (2007). Shark nursery areas: concepts, definitions,
characterization and assumptions. Marine Ecology-Progress Series 337: 287-297.
IUCN (2017). The IUCN Red List of Threatened Species. Version 2017-2.
Jackson, J. B. C., Kirby, M. X., Berger, W. H., Bjorndal, K. A., Botsford, L. W., Bourque, B. J., Bradbury,
R. H., Cooke, R., Erlandson, J., Estes, J. A., et al. (2001). Historical Overfishing and the Recent Collapse
of Coastal Ecosystems. Science 5530: 629-637.
Jennings, D. E., Gruber, S. H., Franks, B. R., Kessel, S. T., Robertson, A. L. (2008). Effects of large-scale
anthropogenic development on juvenile lemon shark (Negaprion brevirostris) populations of Bimini,
Bahamas. Environmental Biology of Fishes 83: 369-377.
Lotze, H. K., Lenihan, H. S., Bourque, B. J., Bradbury, R. H., Cooke, R. G., Kay, M. C., Kidwell, S. M.
Kirby, M. X., Peterson, C. H., Jackson, J. B. C. (2006). Depletion, Degradation, and Recovery Potential
of Estuaries and Coastal Seas. Science 5781: 1806-1809.
Marshall, A. D., Compagno, L. J. V., Bennett, M. B. (2009). Redescription of the genus Manta with
resurrection of Manta alfredi (Krefft, 1868) (Chondrichthyes; Myliobatoidei; Mobulidae). Zootaxa
2301: 1-28.
Meekan, M., Cappo, M., Carleton, J., Marriott, R. (2006). Surveys of sharks and fin-fish abundance on
reefs within the MOU74 Box and Rowley Shoals using baited remote underwater video systems.
Report prepared for the Department of the Environment and Heritage. Australian Institute of Marine
Science, Townsville.
16Research report
Meesters, H. W. G., Slijkerman, D. M. E., de Graaf, M., Debrot, A. O. (2010). Management plan for
the natural resources of the EEZ of the Dutch Caribbean. vol. C100/10: IMARES Wageningen UR.
Myers, R. A., Baum, J. K., Shepherd, T. D., Powers, S. P., Peterson, C. H. (2007). Cascading Effects of
the Loss of Apex Predatory Sharks from a Coastal Ocean. Science 315: 1846-1850.
Myers, R. A. & Worm, B. (2003). Rapid worldwide depletion of predatory fish communities. Nature
423: 280-283.
Pandolfi, J. M., Bradbury, R. H., Sala, E., Hughes, T. P., Bjorndal, K. A., Cooke, R. G., McArdle, D.,
McClenachan, L., Newman, M. J. H., Paredes, G., et al. (2003). Global Trajectories of the Long-Term
Decline of Coral Reef Ecosystems. Science 5635: 955-958.
Papastamatiou, Y. P., Watanabe, Y. Y., Bradley, D., Dee, L. E., Weng, K., Lowe, C. G., Caselle, J. E.
(2015). Drivers of Daily Routines in an Ectothermic Marine Predator: Hunt Warm, Rest Warmer?
Polunin, N. V. C. & Roberts, C. M. (1993). Greater biomass and value of target coral-reef fishes in two
small Caribbean marine reserves. Marine Ecology-Progress Series 100: 167-167.
Randall, J. E. (1967). Food habits of reef fishes of the West Indies. Stud. Trop. Oceanogr. 5: 665-847.
Ruijs, N. (2017). Baited Remote Underwater Video (BRUV) survey of elasmobranchs on Bonaire’s
reef.
Roberts, C. & Polunin, N. V. C. (1993). Marine Reserves: Simple Solutions to Managing Complex
Fisheries? Ambio 22: 363-368.
Stevens, J. D., Bonfil, R., Dulvy, N. K., Walker, P. A. (2000). The effects of fishing on sharks, rays, and
chimaeras (chondrichthyans), and the implications for marine ecosystems. ICES Journal of Marine
Science 57: 476-494.
Van Beek, I. J. M., Debrot, A. O., De Graaf, M. (2013). Elasmobranchs in the Dutch Caribbean: current
population status, fisheries and conservation. GCFI proceedings of the 65th GCFI meeting.
Willis, T. J., Babcock, R. C. (2000). A baited underwater video system for the determination of
relative density of carnivorous reef fish. Marine Freshwater Research 51:755-763.
Worm, B., Sandow, M., Oschlies, A., Lotze, H. K., Myers, R. A. (2005). Global Patterns of Predator
Diversity in the Open Oceans. Science 5739: 1365-1369.
17Research report
Appendix
Appendix 1
Figure 7: A map of Bonaire including dive sites.
16Research report
Appendix 2
Figure 8: Management zones around Bonaire. West coast no diving zone (green), West coast no fishing zone (blue), Lac Bay (red), West coast
general use zone (yellow) and East coast general use zone (white). West coast general use zone is divided into five sub zones: North-West coast
1, 2 & 3, Klein Bonaire, and South-West coast. East coast general use zone is divided into two sub zones: North-East coast and South-East coast.
17Research report
Appendix 3
Appendix 3a
Table 1: Number of sharks and rays observed in BRUV video footage.
East coast West coast
Sharks
Nurse shark 6 0
Great hammerhead 4 0
Caribbean reef
shark 42 7
Rays
Southern stingray 1 6
Spotted eagle ray 3 5
Appendix 3b
Table 2: Number of sharks and rays sighted during dives by dive guides.
East coast West coast
Sharks
Caribbean reef shark 10 11
Bull shark 0 1
Nurse shark 66 10
Rays
Spotted eagle ray 366 79
Southern stingray 102 68
Manta ray 5 6
18You can also read