BANK OF AMERICA MERRILL LYNCH FINANCIALS CONFERENCE - George Culmer | 25 September 2018 - Lloyds Banking ...

Page created by Helen Davidson
 
CONTINUE READING
BANK OF AMERICA MERRILL LYNCH FINANCIALS CONFERENCE - George Culmer | 25 September 2018 - Lloyds Banking ...
BANK OF AMERICA MERRILL LYNCH
FINANCIALS CONFERENCE

George Culmer | 25 September 2018
BANK OF AMERICA MERRILL LYNCH FINANCIALS CONFERENCE - George Culmer | 25 September 2018 - Lloyds Banking ...
Unique business model generating strong and sustainable returns

Distinctive competitive strengths                                                         Statutory profit before tax
                                                                                          £bn

                                   Differentiated multi-brand, multi-
                                   channel customer propositions
                                                                                                                                                          3.1
                                                                                                                          2.5             2.5

                                   Largest digital bank, branch reach                           0.9
                                                                                                           1.2
                                   and customer franchise
                                                                                                 H1        H1             H1              H1               H1
                                                                                                2014      2015           2016            2017             2018

                                   Market leading efficiency                              Return on tangible equity1
                                                                                          %

                                                                                                                                                         16.3
                                                                                                14.2      14.3                          14.0
                                   Prudent, low risk participation                                                       12.1                            12.1
                                   choices with strong capital position                                                                  8.9
                                                                                                                         6.6
                                                                                                4.4
                                                                                                           2.6
                                   Rigorous execution and
                                   management discipline
                                                                                                2014      2015           2016           2017            H1 2018
                                                                                                       Underlying RoTE     Statutory RoTE (after tax)
1 – 2014 to 2017 restated to show Remediation / Other Conduct within underlying profit.                                                                           1
Strategic plan targeting significant customer and business enhancements

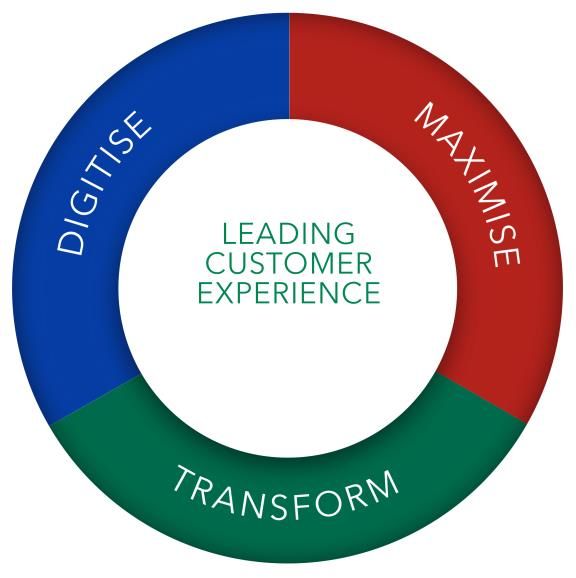
DIGITISING THE GROUP                                     MAXIMISING GROUP CAPABILITIES
• End to end transformation covering more               • £6bn loan growth in start-ups, SME and
  than 70% of our cost base                               Mid Market businesses
• Simplification and progressive                        • Sole integrated UK banking and insurance
  modernisation of IT and data architecture               provider targeting >1m new pensions
                                                          customers and £50bn AuA growth

 LEADING CUSTOMER EXPERIENCE                             TRANSFORMING WAYS OF WORKING

• #1 UK digital bank, with Open Banking                 • More than half of transformation
  functionality                                           delivered through Agile methodology
• #1 Branch network, serving complex                    • Biggest ever investment in our People
  needs                                                   with 50% increase in colleague training
                                                          and development to 4.4m hours pa
• Data-driven and personalised customer
  propositions
                                                                                                    2
Cost discipline enables greater investment capacity, improved customer
experience and increased returns
                                                                                                                 Market leading efficiency position
                                                                                                                 Cost:income ratio1, %
                                                                                                                                    51.9                                                      Low 40s incl
                                                                                                                                                                    47.7
                                                                                                                                                                                              remediation
                                           Market leading
                                             efficiency                        Freeing up                                           45.8                            44.9
          Higher NPS scores                                                capital for >£3.0bn
                                                                          strategic investment                                    H1 2017                        H1 2018                       2020 (Exit)
                                                                                                                                                Incl remediation           Excl remediation

           Improvement                                                            Greater                        Greater investment capacity
                                                                                                                 Total strategic investment
            to customer                       Statutory                         investment
             experience                                                           capacity                                                                        +40%                   >£3.0bn
                                                RoTE
                                            14–15% from
                                                2019
   Future proofing our                                                               End-to-end
    business model                                                                 transformation                                       2015–2017                                      2018–2020

                                                                                                                 Committing to net cost reductions
                                                                                                                 Operating costs2, £bn
                     Net cost                                       Enhancements                                                                                                        8.2
Low risk business model underpinned by prudent participation choices and
stringent underwriting
Asset quality ratio
bps
                                                            –10                       –7           • Gross AQR stable despite inclusion of MBNA; net
                               –13
                   28                          28                        27
                                                                                                     AQR up due to lower releases and write-backs
                                                           18                        20
                               15                                                                  • Underlying credit portfolio remains stable with no
                        2016                        2017                  H1 2018                    overall deterioration in credit risk indicators
                   Gross AQR                Net AQR             Releases and write-backs
                                                                                                   • Prudent participation choices
Mortgage portfolio quality
%
      56.4
                                                                                                     - Over 95% of assets in the UK (AA rated) and secured
                      53.3
                                     49.2                                                              assets represent over 2/3 of portfolio
                                                    46.1
                                                                  44.0        43.6         43.5
                                                                                                     - Unsecured consumer portfolio c.6% of loans
                                     81.9           86.4          89.0        89.5         88.8
                      70.4
        59.6                                                                                         - Run off balances (
Supporting the UK economy with growth in key banking and insurance segments

Continued growth in targeted segments
£bn, %
                   Credit cards                                   Net lending growth to
                                                                   SMEs since 2011             • Open mortgage book to grow moderately and expected
                              £18.5bn
                                                                                                 to be slightly higher at year end vs previous year
                                            MBNA
                                            £8.5bn              34%
         £10.0bn
                                                                                               • Continue to target prudent lending growth in consumer
                                                                                                 finance, SME and Mid Markets

                                                                                                 - Motor Finance to continue growing ahead of market
                                                                                     –12%
                                                                                      (14)
          2011               H1 2018                            LBG1                 Market2     - Credit cards expected to grow in line with the market
Growth in current accounts 2014 vs Jun 2018                                                      - £6bn growth in SME and Mid Markets by 2020
£bn

                                                                                               • Strategy to grow current accounts, reduce tactical
       2014                  £69bn                                                               balances and optimise liability mix
                                                                            +13% CAGR
                                                                                               • Sole integrated UK banking and insurance provider –
                                                                                                 targeting >1m new pensions customers and £50bn AuA
  H1 2018                               £107bn
                                                                                                 growth by year end 2020

1 – Includes SME, RBB and Commercial Cards. 2 – Source: Bank of England, Jun 2018.                                                                         5
H1 2018 results: strong and sustainable financial performance

£m                               H1 2018    H1 2017    Change
Net income                         8,971      8,778       2%     • Robust underlying profit supported by

Total costs                       (4,281)    (4,558)      6%       - Increasing income and margin
Impairment                          (456)      (268)    (70)%      - Lower costs despite increased investment and inclusion
                                                                     of MBNA; market leading cost:income ratio of 47.7%
Underlying profit                  4,234      3,952       7%

Volatility and other items          (190)       (37)        –      - Credit quality remaining strong with no overall
                                                                     deterioration in credit risk indicators
Restructuring costs                 (377)      (321)    (17)%

PPI                                 (550)    (1,050)     48%     • Strong statutory profit before tax of £3.1bn, up 23%

Statutory profit before tax        3,117      2,544      23%       - Gap between underlying and statutory continues to fall
                                                                   - Targeting further strong statutory profit growth
Net interest margin                2.93%      2.82%      11bp

Cost:income (incl remediation)     47.7%      51.9%    (4.2)pp   • Statutory return on tangible equity improved to 12.1%,
                                                                   up 3.9pp
Asset quality ratio                0.20%      0.12%       8bp
Return on tangible equity          12.1%       8.2%     3.9pp
                                                                                                                              6
Strong capital position and build enabling attractive shareholder returns

Pre dividend capital build per annum                                                                                  • Business model remains strongly capital generative
bps
                                                                                                                        - Pro forma1 CET1 capital build of 121bps in H1
                                                                                                                        - Capital build of c.200bps expected in 2018, pre dividend
                                                                                                                        - Plan guidance of 170–200bps pa, pre dividend, after
                                                                                                                          all known factors
               FY 2018                                                                            c.200

                                                                                                                      • Strong capital position
                                                                                                                        - Pro forma1 H1 CET1 of 15.1% (pre dividend accrual)
         GSR3 target                                                                         170–200
                                                                                                                      • Clear capital requirement
                                                                                                                        - CET1 target c.13% plus around 1% management buffer

        Peer average
                                                                                                                        - Pillar 2A reduced by 30bps to 2.7%
                                                                            c.130
        (2015–2017)                                                                                                     - Stress test results inform PRA buffer but no direct link

                                                                                                                      • Clear framework for capital return
                                                                                                                        - Progressive and sustainable ordinary dividend policy
                                                                                                                        - Flexibility to return surplus capital

1 – Pro forma the interim insurance dividend and the capital benefit from the sale of the Irish mortgage portfolio.                                                                  7
Clear strategy and competitive differentiation underpins financial guidance and
delivery of strong and sustainable returns to shareholders

                                                       • Targeted growth

                                                       • Resilient margin

                                                       • Market leading cost efficiency

                                                       • Strong asset quality

                                                       • Strong capital build

                                                       • Superior return on tangible equity

                                                       • Attractive capital returns
          >£3bn strategic investment
                                                                                              8
Forward looking statements and basis of presentation

Forward looking statements
This document contains certain forward looking statements with respect to the business, strategy, plans and /or results of Lloyds Banking Group (the “Group”) and its current goals and
expectations relating to its future financial condition and performance. Statements that are not historical facts, including statements about the Group's or its directors' and/or management's
beliefs and expectations, are forward looking statements. By their nature, forward looking statements involve risk and uncertainty because they relate to events and depend upon
circumstances that will or may occur in the future. Factors that could cause actual business, strategy, plans and/or results (including but not limited to the payment of dividends) to differ
materially from forward looking statements made by the Group or on its behalf include, but are not limited to: general economic and business conditions in the UK and internationally; market
related trends and developments; fluctuations in interest rates, inflation, exchange rates, stock markets and currencies; the ability to access sufficient sources of capital, liquidity and funding
when required; changes to the Group's credit ratings; the ability to derive cost savings and other benefits including, but without limitation as a result of any acquisitions, disposals and other
strategic transactions; changing customer behaviour including consumer spending, saving and borrowing habits; changes to borrower or counterparty credit quality; instability in the global
financial markets, including Eurozone instability, instability as a result of the exit by the UK from the European Union (EU) and the potential for other countries to exit the EU or the
Eurozone and the impact of any sovereign credit rating downgrade or other sovereign financial issues; technological changes and risks to the security of IT and operational infrastructure,
systems, data and information resulting from increased threat of cyber and other attacks; natural, pandemic and other disasters, adverse weather and similar contingencies outside the
Group's control; inadequate or failed internal or external processes or systems; acts of war, other acts of hostility, terrorist acts and responses to those acts, geopolitical, pandemic or other
such events; changes in laws, regulations, practices and accounting standards or taxation, including as a result of the exit by the UK from the EU, or a further possible referendum on Scottish
independence; changes to regulatory capital or liquidity requirements and similar contingencies outside the Group's control; the policies, decisions and actions of governmental or regulatory
authorities or courts in the UK, the EU, the US or elsewhere including the implementation and interpretation of key legislation and regulation together with any resulting impact on the future
structure of the Group; the ability to attract and retain senior management and other employees and meet its diversity objectives; actions or omissions by the Group's directors, management
or employees including industrial action; changes to the Group's post-retirement defined benefit scheme obligations; the extent of any future impairment charges or write-downs caused by, but
not limited to, depressed asset valuations, market disruptions and illiquid markets; the value and effectiveness of any credit protection purchased by the Group; the inability to hedge certain
risks economically; the adequacy of loss reserves; the actions of competitors, including non-bank financial services, lending companies and digital innovators and disruptive technologies; and
exposure to regulatory or competition scrutiny, legal, regulatory or competition proceedings, investigations or complaints. Please refer to the latest Annual Report on Form 20-F filed with the
US Securities and Exchange Commission for a discussion of certain factors and risks together with examples of forward looking statements. Except as required by any applicable law or
regulation, the forward looking statements contained in this document are made as of today's date, and the Group expressly disclaims any obligation or undertaking to release publicly any
updates or revisions to any forward looking statements contained in this document to reflect any change in the Group’s expectations with regard thereto or any change in events, conditions or
circumstances on which any such statement is based. The information, statements and opinions contained in this document do not constitute a public offer under any applicable law or an offer
to sell any securities or financial instruments or any advice or recommendation with respect to such securities or financial instruments.
Basis of presentation
The results of the Group and its business are presented in this presentation on an underlying basis. The principles adopted in the preparation of the underlying basis of reporting are set out
on the inside front cover of the 2018 Half-Year Results News Release.

© Lloyds Banking Group and its subsidiaries                                                                                                                                                            9
You can also read